
- Current
- Browse
- Collections
-
For contributors
- For Authors
- Instructions to authors
- Article processing charge
- e-submission
- For Reviewers
- Instructions for reviewers
- How to become a reviewer
- Best reviewers
- For Readers
- Readership
- Subscription
- Permission guidelines
- About
- Editorial policy
Articles
- Page Path
- HOME > Diabetes Metab J > Volume 44(3); 2020 > Article
-
Original ArticleComplications The Risk of Diabetes on Clinical Outcomes in Patients with Coronavirus Disease 2019: A Retrospective Cohort Study
-
Seung Min Chung1
 , Yin Young Lee1, Eunyeong Ha1, Ji Sung Yoon1, Kyu Chang Won1, Hyoung Woo Lee1, Jian Hur2, Kyung Soo Hong3, Jong Geol Jang3, Hyun Jung Jin3, Eun Young Choi3, Kyeong-Cheol Shin3, Jin Hong Chung3, Kwan Ho Lee3, June Hong Ahn3, Jun Sung Moon1
 -
Diabetes & Metabolism Journal 2020;44(3):405-413.
DOI: https://doi.org/10.4093/dmj.2020.0105
Published online: May 21, 2020
1Division of Endocrinology and Metabolism, Department of Internal Medicine, Yeungnam University Medical Center, Yeungnam University College of Medicine, Daegu, Korea.
2Division of Infectious Disease, Department of Internal Medicine, Yeungnam University Medical Center, Yeungnam University College of Medicine, Daegu, Korea.
3Division of Pulmonology and Allergy, Department of Internal Medicine, Respiratory Center, Yeungnam University Medical Center, Yeungnam University College of Medicine, Daegu, Korea.
- Corresponding author: June Hong Ahn. Division of Pulmonology and Allergy, Department of Internal Medicine, Respiratory Center, Yeungnam University Medical Center, Yeungnam University College of Medicine, 170 Hyeonchung-ro, Nam-gu, Daegu 42415, Korea. fireajh@gmail.com
- Corresponding author: Jun Sung Moon. Division of Endocrinology and Metabolism, Department of Internal Medicine, Yeungnam University Medical Center, Yeungnam University College of Medicine, 170 Hyeonchung-ro, Nam-gu, Daegu 42415, Korea. mjs7912@yu.ac.kr
Copyright © 2020 Korean Diabetes Association
This is an Open Access article distributed under the terms of the Creative Commons Attribution Non-Commercial License (http://creativecommons.org/licenses/by-nc/4.0/) which permits unrestricted non-commercial use, distribution, and reproduction in any medium, provided the original work is properly cited.
ABSTRACT
-
Background
- To determine the role of diabetes mellitus (DM) in the coronavirus disease 2019 (COVID-19), we explored the clinical characteristics of patients with DM and compared risk factors such as age, glycemic control, and medications to those without DM.
-
Methods
- This was a retrospective cohort study of 117 confirmed patients with COVID-19 which conducted at a tertiary hospital in Daegu, South Korea. The primary outcome was defined as the severe and critical outcome (SCO), of which the composite outcomes of acute respiratory distress syndrome, septic shock, intensive care unit care, and 28-day mortality. We analyzed what clinical features and glycemic control-related factors affect the prognosis of COVID-19 in the DM group.
-
Results
- After exclusion, 110 participants were finally included. DM patients (n=29) was older, and showed higher blood pressure compared to non-DM patients. DM group showed higher levels of inflammation-related biomarkers and severity score, and highly progressed to SCO. After adjustment with other risk factors, DM increased the risk of SCO (odds ratio [OR], 10.771; P<0.001). Among the DM patients, SCO was more prevalent in elderly patients of ≥70 years old and age was an independent risk factor for SCO in patients with DM (OR, 1.175; P=0.014), while glycemic control was not. The use of medication did not affect the SCO, but the renin-angiotensin system inhibitors showed protective effects against acute cardiac injury (OR, 0.048; P=0.045).
-
Conclusion
- The COVID-19 patients with DM had higher severity and resulted in SCO. Intensive and aggressive monitoring of COVID-19 clinical outcomes in DM group, especially in elderly patients is warranted.
- The severe acute respiratory syndrome coronavirus 2 (SARS-CoV-2) pandemic virus, which causes pneumonia, originated in Wuhan, China, in 2019 and is spreading rapidly to other countries [1]. By April 11, 2020, 1,610,909 cases of coronavirus disease 2019 (COVID-19) had been confirmed in 213 countries, and 99,690 COVID-19 patients had died worldwide. The Chinese Center for Disease Control and Prevention reported 81% as mild cases, 14% as severe cases, and 5% as critical cases [2].
- Diabetes mellitus (DM) has an estimated prevalence of 9.3% globally, and is a serious disease that impacts the health status associated with other diseases [3]. In a population-based cohort study, DM was clearly shown to be associated with increased mortality from pneumonia [4], and hyperglycemia on admission is associated with poor clinical outcome for both diabetic and nondiabetic patients with community-acquired pneumonia [5]. Respiratory tract infections, including bacterial pneumonia, influenza, and tuberculosis, are more common, and are more serious in patients with DM than in those without DM [6]. The pathophysiology of increased mortality in diabetic patients with pneumonia is as follows: (1) decreased T lymphocyte response; (2) decreased neutrophil function; (3) depression of the antioxidant system; and (4) disorders of humoral immunity by the complement system [6].
- Previous studies reported that 25% to 45% of patients with COVID-19 have more than one coexisting disorder. Among them, about 10% of patients in China have DM [78]. A recent study showed that diabetic patients are more susceptible to an inflammatory storm, eventually leading to rapid progression and poor prognosis in COVID-19 patients [9].
- In this study, we determined the clinical characteristics of COVID-19 patients with DM compared to those without DM. In addition, we analyzed the severity and clinical outcomes of COVID-19 patients with DM according to age, glycemic control status, and medications.
INTRODUCTION
- Study design and subjects
- We performed a retrospective cohort study of 117 patients with SARS-CoV-2 infection hospitalized at Yeungnam University Medical Center, in Daegu, South Korea. This study was conducted in accordance with the tenets of the Declaration of Helsinki, and was reviewed and approved by the Institutional Review Board of Yeungnam University Hospital (YUH IRB 2020-03-057). The requirement for informed consent was waived because of the retrospective study design.
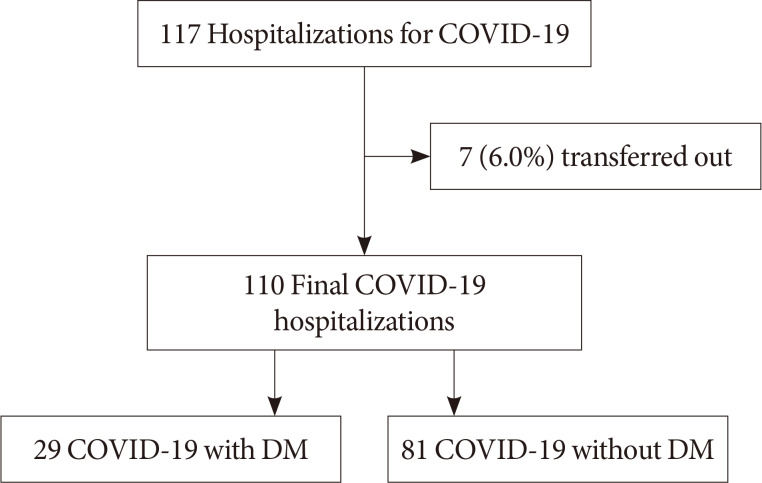
- During the study period, all consecutive adult patients (age >18 years) with SARS-CoV-2 infection admitted to the hospital were eligible for inclusion. SARS-CoV-2 infection was confirmed by real-time reverse transcriptase-polymerase chain reaction assay of nasal and pharyngeal swab samples. Patients who were taken to other hospitals and whose final clinical results were unknown were excluded from the analysis. After excluding seven patients, 110 patients were finally included in this study, and 26.4% (n=29) had DM (Fig. 1).
- Data collection and definitions
- The patients' electronic medical records were reviewed. Data on patients' age, sex, comorbidities, symptoms, vital signs, radiological findings, severity based on the National Early Waring Score (NEWS), treatment, and clinical outcomes were collected. DM was defined as any of the following criteria: (1) a known history of diabetes; (2) taking oral or injected antihyperglycemic agents; (3) history of abnormal blood glucose levels based on diagnostic criteria for type 2 DM of the Korean Diabetes Association [10]. Data on glycosylated hemoglobin (HbA1c) level, DM duration, oral antihyperglycemic agents (OHAs), insulin, and renin-angiotensin system (RAS) inhibitors were collected from patients with DM.
- NEWS [11] is an early warning score facilitating the early detection of and response to deterioration of patient's condition and consists of seven parameters: pulse oximetry, oxygen, pulse, systolic blood pressure, respiration rate, temperature, and central nervous system status. Each parameter is assigned a score of 0 to 3 points. The score reflects the degree to which the parameters differ from the normal range.
- Acute respiratory distress syndrome (ARDS) was diagnosed according to the Berlin definition [12]. Septic shock was defined according to the Third International Consensus Definitions for sepsis and septic shock (Sepsis-3) [13]. Acute cardiac injury was defined as a serum troponin I level above the 99th percentile upper reference limit or new abnormal electrocardiography and echocardiography findings [14]. Acute kidney injury was defined according to the Kidney Disease Improving Global Guidelines (KDIGO) for acute kidney injury [15].
- In this study, we used the term “severe and critical outcome (SCO)” as an index of poor clinical outcome. SCO was defined as the composite outcome of ARDS, septic shock, intensive care unit (ICU) care, and 28-day mortality, referring to the classification of the Chinese Center for Disease Control and Prevention [2].
- Statistical analysis
- Continuous variables are expressed as mean±standard deviation and were compared by Student's t-test or the Mann-Whitney U test. Categorical variables were compared by the chi-squared test or Fisher's exact test. To determine the effects of DM and medications on SCO, multiple logistic regression analysis was performed after adjusting for covariates. In all analyses, two-tailed P<0.05 was taken to indicate statistical significance. All statistical analyses were performed using SPSS software version 24.0 (IBM Co., Armonk, NY, USA).
METHODS
- Baseline characteristics and clinical outcomes of COVID-19 patients according to the presence of DM
- Table 1 shows the baseline characteristics of all patients and a comparison of patients with and without DM. The mean age of the total patient population was 56.9 years and the male to female ratio was 1:1.3. Smokers accounted for 14.5%. A total of 29 patients had DM (26.4%). DM patients had a higher mean age than patients without DM (n=81) (66.3±8.9 years vs. 53.5±17.9 years, respectively; P<0.001). Systolic and diastolic blood pressures were higher in patients with DM than in those without DM (both P<0.05). Hypertension was the most common comorbidity among all participants (33.6%), and more than half of the DM patients had a diagnosis or were taking medication for hypertension. On physical examination, there were no differences in symptoms between groups, except headaches were more frequent among non-DM patients (P=0.020). Bilateral pneumonia was common in DM patients, but the difference in radiologic findings (unilateral pneumonia, bilateral pneumonia, and multiple ground-glass opacity) compared to non-DM patients was not statistically significant (P=0.191). DM patients had higher white blood cell counts, neutrophil counts, lactate dehydrogenase, serum glucose, and C-reactive protein levels and lower albumin level compared to non-DM patients (all P<0.05).
- Table 2 shows the severity, clinical outcomes, and treatment strategy of COVID-19 patients with and without DM. DM patients, compared to subjects without DM, had higher NEWS (4.0±4.2 vs. 1.9±2.1, P=0.015) and rates of progression to mortality (17.2% vs. 1.2%), ARDS (37.9% vs. 8.6%), septic shock (24.1% vs. 1.2%), ICU care (27.6% vs. 6.2%), and acute cardiac injury (27.6% vs. 6.2%) (all P<0.01). In addition, DM patients had higher rates of oxygen and invasive mechanical ventilation treatments (both P<0.01) and prescription of hydroxychloroquine medication (P=0.022).
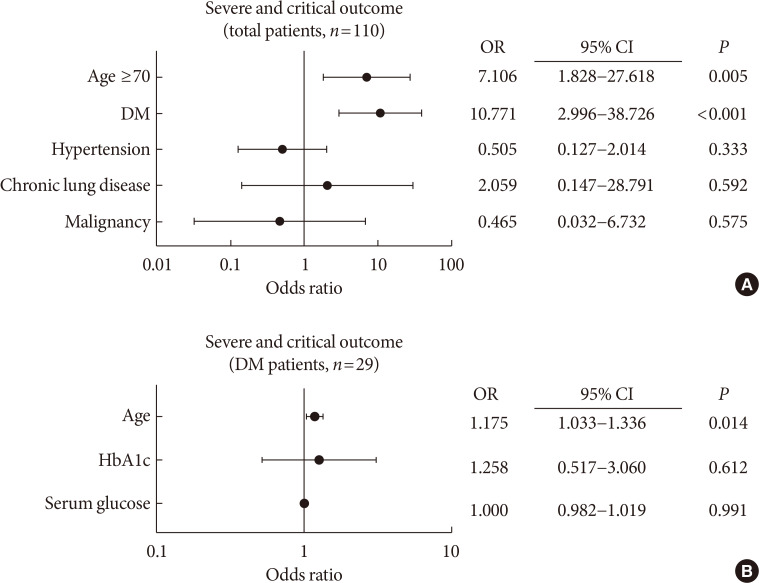
- The rates of progression to SCO were significantly higher with patients aged ≥70 years old compared to subjects <70 years old (42.3% vs. 9.6%, P=0.01), and in DM patients compared to subjects without DM (44.8% vs. 7.5%, P<0.001). The effect of age and DM on the risk of SCO in COVID-19 was analyzed (Fig. 2A). After adjustments for age, sex, smoking status, and the presence of comorbidities, age of ≥70 years old (odds ratio [OR], 7.106; P=0.005) and DM (OR, 10.771; P<0.001) significantly increased the risk of SCO, whereas hypertension, chronic lung disease, and malignancy had no effect on severity of outcomes.
- Analysis of factors affecting SCO in COVID-19 patients with DM
- We extracted diabetic patients (n=29) and explored the effects of age, DM control status, and medications on clinical outcomes. Twelve were newly diagnosed with DM on admission. Comparisons of clinical characteristics and outcomes according to age with a cutoff of 70 years are presented in Table 3. Compared to DM patients <70 years old (n=18), older DM patients (≥70 years old, n=11) were significantly older (60.9±6.2 years vs. 75.3±3.6 years, respectively; P<0.001) but there was no difference in sex ratio (P=0.702). The HbA1c and serum glucose levels, DM duration, and medication histories of OHAs, insulin and RAS inhibitors were not different between groups (all P>0.05). NEWS was not different between groups (3.3±4.1 vs. 5.3±4.5, respectively; P=0.204), but SCO was more frequent in DM patients ≥70 years old (27.8% vs. 72.7%, respectively; P=0.027).
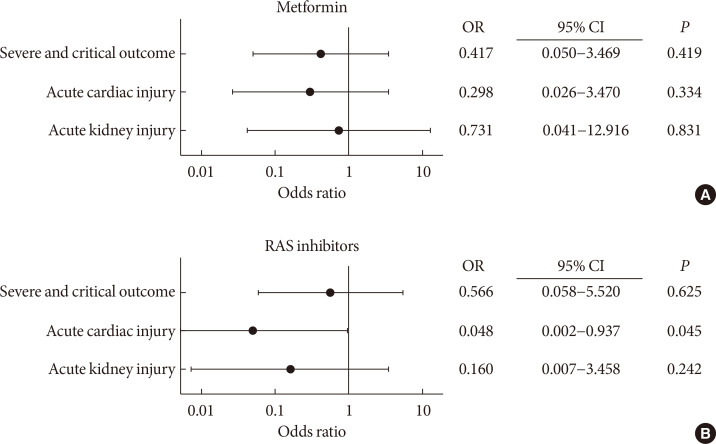
- The effects of age, HbA1c, and serum glucose level on SCO in COVID-19 patients with DM were evaluated (Fig. 2B). After adjustments, age significantly increased the risk of SCO (OR, 1.175; P=0.014), whereas HbA1c and serum glucose had no effect on SCO. We also evaluated the effects of medications on SCO, acute cardiac injury, and acute kidney injury in COVID-19 patients with DM (Fig. 3). The usage of metformin or RAS inhibitors had no effect on SCO, but RAS inhibitors showed protective effects against acute cardiac injury (OR, 0.048; P=0.045).
- We investigated whether poor glycemic control affects the prognosis of COVID-19 patients (Supplementary Table 1). Compared to diabetic patients with HbA1c <8% (n=21), poorly controlled (HbA1c ≥8%, n=8) patients had higher levels of HbA1c (6.9±0.5 vs. 10.0±1.9, respectively) and serum glucose (163.9±56.0 vs. 266.4±133.5, respectively), and had longer duration of DM (2.5±3.9 vs. 11.4±12.5, respectively) (all P<0.05). However, age, sex ratio, medication histories, NEWS, and SCO were not different between groups (all P>0.05).
RESULTS
- The results of the present study showed that the elderly over 70 years old and the presence of DM significantly impacted the clinical course of COVID-19. Patients with DM showed higher severity scores (NEWS) and more frequently progressed to SCO than patients without DM. Among DM patients, age significantly affected SCO, and RAS inhibitors showed beneficial effects against acute cardiac injury.
- In recent reports of COVID-19 from China, the prevalence of comorbid DM was 7.4% to 20%, and patients with cardiometabolic disease had a severe clinical course [16]. Various results have been reported as to whether DM is a significant risk factor for disease progression of COVID-19. Guo et al. [9] reported higher levels of inflammation-related biomarkers in DM patients compared to non-DM patients. Zhou et al. [17] reported significant numbers of patients with DM in the non-survivor group, but the presence of DM did not significantly increase the risk of mortality. Wu et al. [8] reported that, after 40 days of follow-up, the presence of DM increased the risk of progressing to ARDS but did not affect mortality rate. In the present study, patients with DM had high levels of inflammation-related biomarkers and increased risk of SCO, including 28-day mortality. These data indicate that special attention should be paid to COVID-19 patients with comorbid DM.
- The impacts of DM on the clinical course of SARS and Middle East respiratory syndrome (MERS) have been verified previously. The presence of DM and fasting plasma glucose level ≥126 mg/dL increased the risk of death in SARS by 6.3 and 3.3 times, respectively, and emphasized that adequate blood glucose control during treatment could improve prognosis [18]. In a meta-analysis in MERS cases, DM patients had 1.8 times increased risk of death [19]. In diabetic mice exposed to MERS-CoV, the duration of the severe disease phase was prolonged and the recovery was delayed, independently of viral titer, which was due to dysregulation of the immune response [20]. Previous reports and the results of the present study indicated that the progression of COVID-19 is also affected by DM.
- Angiotensin-converting enzyme 2 (ACE2) acts as a cellular receptor for SARS-CoV and SARS-CoV2 [21], enabling acute viral replication. Accordingly, the causes of increased susceptibility to COVID-19 in diabetic patients was suggested to be related to diminished T cell function, increased susceptibility to cytokine storm, and increased ACE2 expression [22]. In addition, there is emerging evidence that the usage of drugs that increase ACE2 expression, such as RAS inhibitors (ACE inhibitors and angiotensin II receptor blockers), thiazolidinediones, and ibuprofen, may accelerate the development of COVID-19 [23]. In addition, glucagon like peptide-1 agonist [24] and atorvastatin [25] upregulate ACE2, so they should be used with caution. In the case of MERS-CoV, dipeptidyl peptidase 4 (DPP4) was shown to be a functional cellular receptor [26], so it was suggested that the use of DPP4 inhibitors may slow the progression of COVID-19 infection [27]. In the present study, neither RAS inhibitors nor metformin exacerbated the course of COVID-19, so the discontinuation or modification of these drugs does not appear to be necessary.
- This study had some limitations. First, we included only our experience in a single tertiary center in Korea and recognize that there are limitations to generalizing these findings to other situations. However, the proportion of moderate to high-risk (NEWS ≥5) patients among the participants in this study was about 20%, which was a similar pattern to those of previous studies. Amidst the global pandemic of COVID-19, each country and city is showing quite different outcomes, depending on their healthcare systems and resources [28]. These findings may provide insight for the operation of healthcare systems that are similar to those of South Korea. Second, we cannot exclude the effects of glycemic control or DM complications on prognosis of COVID-19 patients. There are no data regarding the optimal glycemic target for patients with COVID-19 and DM, and our study only showed the clinical outcomes according to HbA1c level. In the present study, the poorly controlled group, as defined by HbA1c ≥8%, did not show different outcomes with regard to severity or mortality. Surprisingly, however, we found that about 40% of the patients in the DM group had been newly diagnosed with DM, indicating heterogeneity within the DM group. Further large-scale studies on glycemic control and COVID-19 prognosis would provide more insight. Meanwhile, healthcare providers should pay attention to the possibility of “hidden diabetes” in COVID-19 patients.
- This study had some strengths. To our knowledge, this is the first study suggesting effects of antidiabetic medications or glycemic control (indicated by HbA1c) on the clinical course of COVID-19. These findings provide insight into factors that affect the course of COVID-19 in patients with DM. In contrast to concerns raised previously, OHA and RAS inhibitors did not significantly affect the severity of COVID-19, suggesting that patients with DM do not have to stop taking their medications.
- In conclusion, COVID-19 patients with DM had higher severity and higher rates of severe outcomes, including 28-day mortality, than those without DM. After adjustment for other risk factors, DM was an independent risk factor for SCO in COVID-19 patients. Among patients with DM, older age significantly increased the risk of SCO but RAS inhibitors and OHA did not affect the outcomes. Given these potentially devastating effects of DM, especially in older patients, intensive and aggressive monitoring is needed in COVID-19.
DISCUSSION
-
Acknowledgements
- The present study was supported by a National Research Foundation of Korea grant funded by the Korean government (grant no. NRF-2019M3E5D1A02068242, NRF-2019M3E5D1A02068104). The funders had no role in study design, data collection and analysis, decision to publish or preparation of the manuscript.
- We thank the staff who helped to care for the COVID-19 patients at Yeungnam University Medical Center, Daegu, Korea.
ACKNOWLEDGMENTS
-
CONFLICTS OF INTEREST: No potential conflict of interest relevant to this article was reported.
-
AUTHOR CONTRIBUTIONS:
NOTES
SUPPLEMENTARY MATERIALS
Supplement Table 1
- 1. Huang C, Wang Y, Li X, Ren L, Zhao J, Hu Y, Zhang L, Fan G, Xu J, Gu X, Cheng Z, Yu T, Xia J, Wei Y, Wu W, Xie X, Yin W, Li H, Liu M, Xiao Y, Gao H, Guo L, Xie J, Wang G, Jiang R, Gao Z, Jin Q, Wang J, Cao B. Clinical features of patients infected with 2019 novel coronavirus in Wuhan, China. Lancet 2020;395:497-506. ArticlePubMedPMC
- 2. Wu Z, McGoogan JM. Characteristics of and important lessons from the coronavirus disease 2019 (COVID-19) outbreak in China: summary of a report of 72,314 cases from the Chinese Center for Disease Control and Prevention. JAMA 2020 2 24 [Epub].
- 3. Saeedi P, Petersohn I, Salpea P, Malanda B, Karuranga S, Unwin N, Colagiuri S, Guariguata L, Motala AA, Ogurtsova K, Shaw JE, Bright D, Williams R. IDF Diabetes Atlas Committee. Global and regional diabetes prevalence estimates for 2019 and projections for 2030 and 2045: results from the International Diabetes Federation Diabetes Atlas, 9th edition. Diabetes Res Clin Pract 2019;157:107843. ArticlePubMed
- 4. Kornum JB, Thomsen RW, Riis A, Lervang HH, Schonheyder HC, Sorensen HT. Type 2 diabetes and pneumonia outcomes: a population-based cohort study. Diabetes Care 2007;30:2251-2257. PubMed
- 5. McAlister FA, Majumdar SR, Blitz S, Rowe BH, Romney J, Marrie TJ. The relation between hyperglycemia and outcomes in 2,471 patients admitted to the hospital with community-acquired pneumonia. Diabetes Care 2005;28:810-815. ArticlePubMedPDF
- 6. Casqueiro J, Casqueiro J, Alves C. Infections in patients with diabetes mellitus: a review of pathogenesis. Indian J Endocrinol Metab 2012;16 Suppl 1(Suppl1):S27-S36. PubMed
- 7. Guan WJ, Ni ZY, Hu Y, Liang WH, Ou CQ, He JX, Liu L, Shan H, Lei CL, Hui DSC, Du B, Li LJ, Zeng G, Yuen KY, Chen RC, Tang CL, Wang T, Chen PY, Xiang J, Li SY, Wang JL, Liang ZJ, Peng YX, Wei L, Liu Y, Hu YH, Peng P, Wang JM, Liu JY, Chen Z, Li G, Zheng ZJ, Qiu SQ, Luo J, Ye CJ, Zhu SY, Zhong NS. China Medical Treatment Expert Group for Covid-19. Clinical characteristics of coronavirus disease 2019 in China. N Engl J Med 2020;382:1708-1720. ArticlePubMed
- 8. Wu C, Chen X, Cai Y, Xia J, Zhou X, Xu S, Huang H, Zhang L, Zhou X, Du C, Zhang Y, Song J, Wang S, Chao Y, Yang Z, Xu J, Zhou X, Chen D, Xiong W, Xu L, Zhou F, Jiang J, Bai C, Zheng J, Song Y. Risk factors associated with acute respiratory distress syndrome and death in patients with coronavirus disease 2019 pneumonia in Wuhan, China. JAMA Intern Med 2020;e200994.Article
- 9. Guo W, Li M, Dong Y, Zhou H, Zhang Z, Tian C, Qin R, Wang H, Shen Y, Du K, Zhao L, Fan H, Luo S, Hu D. Diabetes is a risk factor for the progression and prognosis of COVID-19. Diabetes Metab Res Rev 2020;e3319. PubMedPMC
- 10. Kim MK, Ko SH, Kim BY, Kang ES, Noh J, Kim SK, Park SO, Hur KY, Chon S, Moon MK, Kim NH, Kim SY, Rhee SY, Lee KW, Kim JH, Rhee EJ, Chun S, Yu SH, Kim DJ, Kwon HS, Park KS. Committee of Clinical Practice Guidelines, Korean Diabetes Association. 2019 Clinical practice guidelines for type 2 diabetes mellitus in Korea. Diabetes Metab J 2019;43:398-406. ArticlePubMedPMCPDF
- 11. Smith GB, Prytherch DR, Meredith P, Schmidt PE, Featherstone PI. The ability of the National Early Warning Score (NEWS) to discriminate patients at risk of early cardiac arrest, unanticipated intensive care unit admission, and death. Resuscitation 2013;84:465-470. ArticlePubMed
- 12. ARDS Definition Task Force. Ranieri VM, Rubenfeld GD, Thompson BT, Ferguson ND, Caldwell E, Fan E, Camporota L, Slutsky AS. Acute respiratory distress syndrome: the Berlin Definition. JAMA 2012;307:2526-2533. PubMed
- 13. Singer M, Deutschman CS, Seymour CW, Shankar-Hari M, Annane D, Bauer M, Bellomo R, Bernard GR, Chiche JD, Coopersmith CM, Hotchkiss RS, Levy MM, Marshall JC, Martin GS, Opal SM, Rubenfeld GD, van der Poll T, Vincent JL, Angus DC. The third international consensus definitions for sepsis and septic shock (Sepsis-3). JAMA 2016;315:801-810. ArticlePubMedPMC
- 14. Wang D, Hu B, Hu C, Zhu F, Liu X, Zhang J, Wang B, Xiang H, Cheng Z, Xiong Y, Zhao Y, Li Y, Wang X, Peng Z. Clinical characteristics of 138 hospitalized patients with 2019 novel coronavirus-infected pneumonia in Wuhan, China. JAMA 2020;323:1061-1069.ArticlePubMedPMC
- 15. Khwaja A. KDIGO clinical practice guidelines for acute kidney injury. Nephron Clin Pract 2012;120:c179-c184. ArticlePubMedPDF
- 16. Li B, Yang J, Zhao F, Zhi L, Wang X, Liu L, Bi Z, Zhao Y. Prevalence and impact of cardiovascular metabolic diseases on COVID-19 in China. Clin Res Cardiol 2020;109:531-538. ArticlePubMedPMCPDF
- 17. Zhou F, Yu T, Du R, Fan G, Liu Y, Liu Z, Xiang J, Wang Y, Song B, Gu X, Guan L, Wei Y, Li H, Wu X, Xu J, Tu S, Zhang Y, Chen H, Cao B. Clinical course and risk factors for mortality of adult inpatients with COVID-19 in Wuhan, China: a retrospective cohort study. Lancet 2020;395:1054-1062. ArticlePubMedPMC
- 18. Yang JK, Feng Y, Yuan MY, Yuan SY, Fu HJ, Wu BY, Sun GZ, Yang GR, Zhang XL, Wang L, Xu X, Xu XP, Chan JC. Plasma glucose levels and diabetes are independent predictors for mortality and morbidity in patients with SARS. Diabet Med 2006;23:623-628. ArticlePubMed
- 19. Matsuyama R, Nishiura H, Kutsuna S, Hayakawa K, Ohmagari N. Clinical determinants of the severity of Middle East respiratory syndrome (MERS): a systematic review and meta-analysis. BMC Public Health 2016;16:1203. ArticlePubMedPMCPDF
- 20. Kulcsar KA, Coleman CM, Beck SE, Frieman MB. Comorbid diabetes results in immune dysregulation and enhanced disease severity following MERS-CoV infection. JCI Insight 2019;4:e131774.ArticlePubMedPMC
- 21. Li W, Moore MJ, Vasilieva N, Sui J, Wong SK, Berne MA, Somasundaran M, Sullivan JL, Luzuriaga K, Greenough TC, Choe H, Farzan M. Angiotensin-converting enzyme 2 is a functional receptor for the SARS coronavirus. Nature 2003;426:450-454. ArticlePubMedPMCPDF
- 22. Muniyappa R, Gubbi S. COVID-19 pandemic, coronaviruses, and diabetes mellitus. Am J Physiol Endocrinol Metab 2020;318:E736-E741. ArticlePubMedPMC
- 23. Fang L, Karakiulakis G, Roth M. Are patients with hypertension and diabetes mellitus at increased risk for COVID-19 infection? Lancet Respir Med 2020;8:e21. ArticlePubMedPMC
- 24. Romani-Perez M, Outeirino-Iglesias V, Moya CM, Santisteban P, Gonzalez-Matias LC, Vigo E, Mallo F. Activation of the GLP-1 receptor by liraglutide increases ACE2 expression, reversing right ventricle hypertrophy, and improving the production of SP-A and SP-B in the lungs of type 1 diabetes rats. Endocrinology 2015;156:3559-3569. ArticlePubMedPDF
- 25. Tikoo K, Patel G, Kumar S, Karpe PA, Sanghavi M, Malek V, Srinivasan K. Tissue specific up regulation of ACE2 in rabbit model of atherosclerosis by atorvastatin: role of epigenetic histone modifications. Biochem Pharmacol 2015;93:343-351. ArticlePubMed
- 26. Raj VS, Mou H, Smits SL, Dekkers DH, Müller MA, Dijkman R, Muth D, Demmers JA, Zaki A, Fouchier RA, Thiel V, Drosten C, Rottier PJ, Osterhaus AD, Bosch BJ, Haagmans BL. Dipeptidyl peptidase 4 is a functional receptor for the emerging human coronavirus-EMC. Nature 2013;495:251-254. ArticlePubMedPMCPDF
- 27. Iacobellis G. COVID-19 and diabetes: can DPP4 inhibition play a role? Diabetes Res Clin Pract 2020;162:108125. ArticlePubMedPMC
- 28. World Health Organization. Coronavirus disease (COVID-2019) situation reports updated 2020 May 15. Available from: https://www.who.int/emergencies/diseases/novel-coronavirus-2019/situation-reports.
REFERENCES

Diabetes mellitus (DM) and age as a risk factor for severe and critical outcomes in patients with coronavirus disease 2019. Severe and critical outcomes: composite outcome of acute respiratory distress syndrome, septic shock, intensive care unit care, and mortality within 28 days. Multivariate logistic regression analysis was adjusted by (A) age (<70:≥70 years old), sex, smoking status, and the presence of comorbidities (diabetes mellitus, hypertension, chronic lung disease, and malignancy) in the total number of patients and (B) age (continuous), sex, smoking status, and glycosylated hemoglobin (HbA1c), and serum glucose levels among diabetic patients. The odds ratios (ORs) are presented in log10. CI, confidence interval.
Effects of (A) metformin and (B) RAS inhibitors on severe and critical outcomes, acute cardiac injury, and acute kidney injury in diabetic patients with coronavirus disease 2019. Severe and critical outcomes: composite outcome of acute respiratory distress syndrome, septic shock, intensive care unit care, and mortality within 28 days. Multivariate logistic regression analysis was adjusted by age, sex, smoking status, and glycosylated hemoglobin level. The odds ratios (ORs) are presented in log10. CI, confidence interval.
Comparison of baseline anthropometric, symptom, and laboratory characteristics between coronavirus disease 2019 patients with and without diabetes
Comparison of clinical outcomes and treatment between coronavirus disease 2019 patients with and without diabetes
Values are presented as mean±standard deviation or number (%).
NEWS, National Early Warning Score; ARDS, acute respiratory distress syndrome; ICU, intensive care unit; HFNC, high flow nasal cannula; IMV, invasive mechanical ventilation; CRRT, continuous renal replacement therapy; ECMO, extracorporeal membrane oxygenation.
Comparison of clinical characteristics and outcomes between younger (<70 years) and older (≥70 years) coronavirus disease 2019 patients with diabetes
Values are presented as mean±standard deviation or number (%).
HbA1c, glycosylated hemoglobin; DM, diabetes mellitus; DPP4i, dipeptidyl peptidase 4 inhibitor; TZD, thiazolidinedione; SGLT2i, sodium-glucose transport protein 2 inhibitor; AGI, α-glucosidase inhibitor; NEWS, National Early Warning Score.
aComposite outcome of acute respiratory distress syndrome, septic shock, intensive care unit care, and mortality within 28 days.
Figure & Data
References
Citations
- Adult-Onset Type 1 Diabetes Development Following COVID-19 mRNA Vaccination
Hyeyeon Moon, Sunghwan Suh, Mi Kyoung Park
Journal of Korean Medical Science.2023;[Epub] CrossRef - Severity of Symptoms and Mortality in Diabetic Patients with COVID- 19 Infection. Review
Zahraa ALBasry, Abeer Abdulhadi Rashid, Shaymaa Hasan Abbas
Al Mustansiriyah Journal of Pharmaceutical Sciences.2023; 23(1): 91. CrossRef - Risk phenotypes of diabetes and association with COVID-19 severity and death: an update of a living systematic review and meta-analysis
Sabrina Schlesinger, Alexander Lang, Nikoletta Christodoulou, Philipp Linnerz, Kalliopi Pafili, Oliver Kuss, Christian Herder, Manuela Neuenschwander, Janett Barbaresko, Michael Roden
Diabetologia.2023; 66(8): 1395. CrossRef - COVID-19 and Cardiovascular Comorbidities
Dirk Müller-Wieland, Nikolaus Marx, Michael Dreher, Katharina Fritzen, Oliver Schnell
Experimental and Clinical Endocrinology & Diabetes.2022; 130(03): 178. CrossRef - Prevalence and impact of diabetes in hospitalized COVID‐19 patients: A systematic review and meta‐analysis
Sian A. Bradley, Maciej Banach, Negman Alvarado, Ivica Smokovski, Sonu M. M. Bhaskar
Journal of Diabetes.2022; 14(2): 144. CrossRef - Does metformin affect outcomes in COVID‐19 patients with new or pre‐existing diabetes mellitus? A systematic review and meta‐analysis
Adithan Ganesh, Michael D. Randall
British Journal of Clinical Pharmacology.2022; 88(6): 2642. CrossRef - Cardioprotective effect of extracellular vesicles derived from ticagrelor-pretreated cardiomyocyte on hyperglycemic cardiomyocytes through alleviation of oxidative and endoplasmic reticulum stress
Ceylan Verda Bitirim, Zeynep Busra Ozer, Dunya Aydos, Kardelen Genc, Seyma Demirsoy, Kamil Can Akcali, Belma Turan
Scientific Reports.2022;[Epub] CrossRef - Impact of diabetes on COVID‐19 mortality and hospital outcomes from a global perspective: An umbrella systematic review and meta‐analysis
Stavroula Kastora, Manisha Patel, Ben Carter, Mirela Delibegovic, Phyo Kyaw Myint
Endocrinology, Diabetes & Metabolism.2022;[Epub] CrossRef - Glycated Albumin and Glycated Albumin/HbA1c Predict the Progression of Coronavirus Disease 2019 from Mild to Severe Disease in Korean Patients with Type 2 Diabetes
Jeongseon Yoo, Youngah Choi, Shin Ae Park, Ji Yeon Seo, Chul Woo Ahn, Jaehyun Han
Journal of Clinical Medicine.2022; 11(9): 2327. CrossRef - Novel Glycemic Index Based on Continuous Glucose Monitoring to Predict Poor Clinical Outcomes in Critically Ill Patients: A Pilot Study
Eun Yeong Ha, Seung Min Chung, Il Rae Park, Yin Young Lee, Eun Young Choi, Jun Sung Moon
Frontiers in Endocrinology.2022;[Epub] CrossRef - Renin‐Angiotensin Aldosterone System Inhibitors and COVID‐19: A Systematic Review and Meta‐Analysis Revealing Critical Bias Across a Body of Observational Research
Jordan Loader, Frances C. Taylor, Erik Lampa, Johan Sundström
Journal of the American Heart Association.2022;[Epub] CrossRef - The relationship of age, sex and prothrombin time related to the severity and mortality of COVID-19 patients with diabetes mellitus: a systematic review and meta analysis
Audrey Fabianisa Mirza, Ceria Halim, Mutiara Indah Sari
F1000Research.2022; 11: 729. CrossRef - Evaluating the effect of COVID-19 on quality measures of patients with type 2 diabetes in two family nurse practitioner–owned clinics
Wendy L. Wright, Patricia A. White, Meredith Welsh, Kelly Cutting
Journal of the American Association of Nurse Practitioners.2022; 34(9): 1090. CrossRef - Early glycaemic variability increases 28-day mortality and prolongs intensive care unit stay in critically ill patients with pneumonia
Seong Ho Kim, Ji Young Kim, Eun Song Kim, Il Rae Park, Eun Yeong Ha, Seung Min Chung, Jun Sung Moon, Ji Sung Yoon, Kyu Chang Won, Hyoung Woo Lee
Annals of Medicine.2022; 54(1): 2724. CrossRef - Anti-inflammatory drugs and the renin-angiotensin-aldosterone system: Current knowledge and potential effects on early SARS-CoV-2 infection
Iris Louise N. Cabbab, Rafael Vincent M. Manalo
Virus Research.2021; 291: 198190. CrossRef - The Effect of Prior Angiotensin-Converting Enzyme Inhibitor and Angiotensin Receptor Blocker Treatment on Coronavirus Disease 2019 (COVID-19) Susceptibility and Outcome: A Systematic Review and Meta-analysis
Jiuyang Xu, Yaqun Teng, Lianhan Shang, Xiaoying Gu, Guohui Fan, Yijun Chen, Ran Tian, Shuyang Zhang, Bin Cao
Clinical Infectious Diseases.2021; 72(11): e901. CrossRef - Diabetes predicts severity of COVID‐19 infection in a retrospective cohort: A mediatory role of the inflammatory biomarker C‐reactive protein
Huilin Koh, Angela Mei Chung Moh, Ester Yeoh, Yi Lin, Serena Kiat Mun Low, Say Tat Ooi, Seng Kiong Tan, Jaime Hui Xian Lin, Caroline Wei Shan Hoong
Journal of Medical Virology.2021; 93(5): 3023. CrossRef - Susceptibility for Some Infectious Diseases in Patients With Diabetes: The Key Role of Glycemia
Jesús Chávez-Reyes, Carlos E. Escárcega-González, Erika Chavira-Suárez, Angel León-Buitimea, Priscila Vázquez-León, José R. Morones-Ramírez, Carlos M. Villalón, Andrés Quintanar-Stephano, Bruno A. Marichal-Cancino
Frontiers in Public Health.2021;[Epub] CrossRef - Diabetes is most important cause for mortality in COVID-19 hospitalized patients: Systematic review and meta-analysis
Giovanni Corona, Alessandro Pizzocaro, Walter Vena, Giulia Rastrelli, Federico Semeraro, Andrea M Isidori, Rosario Pivonello, Andrea Salonia, Alessandra Sforza, Mario Maggi
Reviews in Endocrine and Metabolic Disorders.2021; 22(2): 275. CrossRef - COVID-19 and diabetes: Analysis of the scientific production indexed in Scopus
Ibraín Enrique Corrales-Reyes, Frank Hernández-García, Christian R. Mejia
Diabetes & Metabolic Syndrome: Clinical Research & Reviews.2021; 15(3): 765. CrossRef - Impact of diabetes mellitus on in-hospital mortality in adult patients with COVID-19: a systematic review and meta-analysis
Halla Kaminska, Lukasz Szarpak, Dariusz Kosior, Wojciech Wieczorek, Agnieszka Szarpak, Mahdi Al-Jeabory, Wladyslaw Gawel, Aleksandra Gasecka, Milosz J. Jaguszewski, Przemyslawa Jarosz-Chobot
Acta Diabetologica.2021; 58(8): 1101. CrossRef - Risk phenotypes of diabetes and association with COVID-19 severity and death: a living systematic review and meta-analysis
Sabrina Schlesinger, Manuela Neuenschwander, Alexander Lang, Kalliopi Pafili, Oliver Kuss, Christian Herder, Michael Roden
Diabetologia.2021; 64(7): 1480. CrossRef - Evolution of a Cohort of COVID-19 Infection Suspects Followed-Up from Primary Health Care
Valle Coronado-Vázquez, Maria del Valle Ramírez-Durán, Juan Gómez-Salgado, María Silvia Dorado-Rabaneda, Elena Benito-Alonso, Marina Holgado-Juan, Cristina Bronchalo-González
Journal of Personalized Medicine.2021; 11(6): 459. CrossRef - Efficacy and safety of dulaglutide 3.0 and 4.5 mg in patients aged younger than 65 and 65 years or older: Post hoc analysis of the AWARD‐11 trial
Juan P. Frias, Enzo Bonora, Luis Nevárez Ruiz, Stanley H. Hsia, Heike Jung, Sohini Raha, David A. Cox, M. Angelyn Bethel, Manige Konig
Diabetes, Obesity and Metabolism.2021; 23(10): 2279. CrossRef - Renin‐Angiotensin Aldosterone System Inhibitors in Primary Prevention and COVID‐19
Jordan Loader, Erik Lampa, Stefan Gustafsson, Thomas Cars, Johan Sundström
Journal of the American Heart Association.2021;[Epub] CrossRef - Predictive value of HbA1c for in-hospital adverse prognosis in COVID-19: A systematic review and meta-analysis
Zheng Zhu, Yaqian Mao, Gang Chen
Primary Care Diabetes.2021; 15(6): 910. CrossRef - High Fibrosis-4 Index Is Related with Worse Clinical Outcome in Patients with Coronavirus Disease 2019 and Diabetes Mellitus: A Multicenter Observational Study
Sung-Woo Kim, Jae-Han Jeon, Jun Sung Moon, Mi Kyung Kim
Endocrinology and Metabolism.2021; 36(4): 800. CrossRef - COVID-19 Vaccination for Endocrine Patients: A Position Statement from the Korean Endocrine Society
Cheol Ryong Ku, Kyong Yeun Jung, Chang Ho Ahn, Jun Sung Moon, Ju Hee Lee, Eun Heui Kim, Hyemi Kwon, Hee Kyung Kim, Sunghwan Suh, Sangmo Hong, Jeonghoon Ha, Eun Roh, Jin Hwa Kim, Mi-kyung Kim
Endocrinology and Metabolism.2021; 36(4): 757. CrossRef - A Systematic Review and Meta-analysis of Diabetes Associated Mortality in Patients with COVID-19
Puneeta Gupta, Meeta Gupta, Neena KAtoch, Ketan Garg, Bhawna Garg
International Journal of Endocrinology and Metabolism.2021;[Epub] CrossRef - Diabetes, Drug Treatment, and Mortality in COVID-19: A Multinational Retrospective Cohort Study
Jennifer E. Nyland, Nazia T. Raja-Khan, Kerstin Bettermann, Philippe A. Haouzi, Douglas L. Leslie, Jennifer L. Kraschnewski, Leslie J. Parent, Patricia Sue Grigson
Diabetes.2021; 70(12): 2903. CrossRef - Impact of Diabetes on COVID-19 Mortality and Hospital Outcomes, a Global Perspective: An ONTOP Systematic Review and Meta-Analysis
Stavroula Kastora, Manisha Patel, Ben Carter, Mirela Delibegovic, Phyo Kyaw Myint
SSRN Electronic Journal .2021;[Epub] CrossRef - Response: Acute Hyperglycemic Crises with Coronavirus Disease-19: Case Reports (Diabetes Metab J 2020;44:349–53)
Na-young Kim, Eunyeong Ha, Jun Sung Moon, Yong-Hoon Lee, Eun Young Choi
Diabetes & Metabolism Journal.2020; 44(3): 484. CrossRef - Diabetes Mellitus is Associated with Severe Infection and Mortality in Patients with COVID-19: A Systematic Review and Meta-analysis
Luxiang Shang, Mengjiao Shao, Qilong Guo, Jia Shi, Yang Zhao, Jiasuoer Xiaokereti, Baopeng Tang
Archives of Medical Research.2020; 51(7): 700. CrossRef - Clinical Characteristics and Mortality Predictors of COVID-19 Patients Hospitalized at Nationally-Designated Treatment Hospitals
Seong-Su Moon, Kwan Lee, Jungi Park, Seongcheol Yun, Yun Sik Lee, Dong Seok Lee
Journal of Korean Medical Science.2020;[Epub] CrossRef - Mortality Rate and Predictors of Mortality in Hospitalized COVID-19 Patients with Diabetes
Dilaram Acharya, Kwan Lee, Dong Seok Lee, Yun Sik Lee, Seong-Su Moon
Healthcare.2020; 8(3): 338. CrossRef - Letter: The Risk of Diabetes on Clinical Outcomes in Patients with Coronavirus Disease 2019: A Retrospective Cohort Study (Diabetes Metab J 2020;44:405–13)
So-Yeon Kim, Kyung-Soo Kim
Diabetes & Metabolism Journal.2020; 44(4): 621. CrossRef - Response: The Risk of Diabetes on Clinical Outcomes in Patients with Coronavirus Disease 2019: A Retrospective Cohort Study (Diabetes Metab J 2020;44:405–13)
Seung Min Chung, June Hong Ahn, Jun Sung Moon
Diabetes & Metabolism Journal.2020; 44(4): 625. CrossRef - The Clinical Characteristics and Outcomes of Patients with Moderate-to-Severe Coronavirus Disease 2019 Infection and Diabetes in Daegu, South Korea
Mi Kyung Kim, Jae-Han Jeon, Sung-Woo Kim, Jun Sung Moon, Nan Hee Cho, Eugene Han, Ji Hong You, Ji Yeon Lee, Miri Hyun, Jae Seok Park, Yong Shik Kwon, Yeon-Kyung Choi, Ki Tae Kwon, Shin Yup Lee, Eon Ju Jeon, Jin-Woo Kim, Hyo-Lim Hong, Hyun Hee Kwon, Chi Yo
Diabetes & Metabolism Journal.2020; 44(4): 602. CrossRef - Fasting Plasma Glucose Level Independently Predicts the Mortality of Patients with Coronavirus Disease 2019 Infection: A Multicenter, Retrospective Cohort Study
Min Cheol Chang, Jong-Moon Hwang, Jae-Han Jeon, Sang Gyu Kwak, Donghwi Park, Jun Sung Moon
Endocrinology and Metabolism.2020; 35(3): 595. CrossRef - Diabetes Mellitus and COVID-19
Jeong Hyun Park
The Journal of Korean Diabetes.2020; 21(3): 116. CrossRef - Management of Diabetes in Coronavirus Disease 2019: Prognosis and Practical Issues
Hye Soon Kim
The Journal of Korean Diabetes.2020; 21(3): 120. CrossRef - Independent Impact of Diabetes on the Severity of Coronavirus Disease 2019 in 5,307 Patients in South Korea: A Nationwide Cohort Study
Sun Joon Moon, Eun-Jung Rhee, Jin-Hyung Jung, Kyung-Do Han, Sung-Rae Kim, Won-Young Lee, Kun-Ho Yoon
Diabetes & Metabolism Journal.2020; 44(5): 737. CrossRef - Adverse impact of renin–angiotensin system blockade on the clinical course in hospitalized patients with severe COVID-19: a retrospective cohort study
Jeong-Hoon Lim, Jang-Hee Cho, Yena Jeon, Ji Hye Kim, Ga Young Lee, Soojee Jeon, Hee Won Noh, Yong-Hoon Lee, Jaehee Lee, Hyun-Ha Chang, Hee-Yeon Jung, Ji-Young Choi, Sun-Hee Park, Chan-Duck Kim, Yong-Lim Kim, Shin-Woo Kim
Scientific Reports.2020;[Epub] CrossRef - Coronavirus Disease 2019 and Diabetes: The Epidemic and the Korean Diabetes Association Perspective
Junghyun Noh, Hyun-Ha Chang, In-Kyung Jeong, Kun Ho Yoon
Diabetes & Metabolism Journal.2020; 44(3): 372. CrossRef - Diabetes and COVID-19: Global and regional perspectives
In-Kyung Jeong, Kun Ho Yoon, Moon Kyu Lee
Diabetes Research and Clinical Practice.2020; 166: 108303. CrossRef
 PubReader
 Cite
Cite- Figure
-


- Related articles
-
- Clinical Effects of a Home Care Pilot Program for Patients with Type 1 Diabetes Mellitus: A Retrospective Cohort Study
- Glycemic Control and Adverse Clinical Outcomes in Patients with Chronic Kidney Disease and Type 2 Diabetes Mellitus: Results from KNOW-CKD
- Rising Incidence of Diabetes in Young Adults in South Korea: A National Cohort Study


