
- Current
- Browse
- Collections
-
For contributors
- For Authors
- Instructions to authors
- Article processing charge
- e-submission
- For Reviewers
- Instructions for reviewers
- How to become a reviewer
- Best reviewers
- For Readers
- Readership
- Subscription
- Permission guidelines
- About
- Editorial policy
Articles
- Page Path
- HOME > Diabetes Metab J > Volume 42(2); 2018 > Article
-
ReviewClinical Diabetes & Therapeutics Effects of Omega-3 Supplementation on Adipocytokines in Prediabetes and Type 2 Diabetes Mellitus: Systematic Review and Meta-Analysis of Randomized Controlled Trials
-
Tarik Becic
 , Christian Studenik
 -
Diabetes & Metabolism Journal 2018;42(2):101-116.
DOI: https://doi.org/10.4093/dmj.2018.42.2.101
Published online: April 19, 2018
Department of Pharmacology and Toxicology, Faculty of Life Sciences, University of Vienna, Vienna, Austria.
- Corresponding author: Tarik Becic. Department of Pharmacology and Toxicology, Faculty of Life Sciences, University of Vienna, Althanstrasse 14, 1090 Vienna, Austria. tarikbecix@gmail.com
Copyright © 2018 Korean Diabetes Association
This is an Open Access article distributed under the terms of the Creative Commons Attribution Non-Commercial License (http://creativecommons.org/licenses/by-nc/4.0/) which permits unrestricted non-commercial use, distribution, and reproduction in any medium, provided the original work is properly cited.
ABSTRACT
-
Background
- The objective of this systematic review and meta-analysis was to determine the effects of omega-3 supplementation on adipocytokine levels in adult prediabetic and diabetic individuals.
-
Methods
- We searched PubMed, Medline, EMBASE, Scopus, Web of Science, Google Scholar, Cochrane Trial Register, World Health Organization Clinical Trial Registry Platform, and Clinicaltrial.gov Registry from inception to August 1, 2017 for randomized controlled trials. Pooled effects of interventions were assessed as mean difference using random effects model. We conducted a sensitivity, publication bias and subgroup analysis.
-
Results
- Fourteen studies individuals (n=685) were included in the meta-analysis. Omega-3 supplementation increased levels of adiponectin (0.48 µg/mL; 95% confidence interval [CI], 0.27 to 0.68; P<0.00001, n=10 trials), but effects disappeared after sensitivity analysis. Tumor necrosis factor α (TNF-α) levels were reduced (−1.71; 95% CI, −3.38 to −0.14; P=0.03, n=8 trials). Treatment duration shorter than 12 weeks was associated with greater reduction than longer treatment duration. Levels of other adipocytokines were not significantly affected. Publication bias could generally not be excluded.
-
Conclusion
- Eicosapentaenoic acid and docosahexaenoic acid supplementation may increase adiponectin and reduce TNF-α levels in this population group. However, due to overall study heterogeneity and potential publication bias, a cautious interpretation is needed.
- Global rates of diabetes mellitus have reached epidemic proportions and are associated with an ever-growing health and socioeconomic burden. The World Health Organization (WHO) estimates that the number of diabetic individuals rose from 108 million in 1980 to 422 million in 2014, whereas low- and middle-income countries have experienced a particularly high increase in diabetes prevalence [1]. With this enormous increase in global rates of diabetes also rises the economic cost, e.g., US data show that the total economic cost of diagnosed cases of diabetes amounted to USD 174 billion in 2007 and rose to 245 billion in 2012 [2]. A large part of the growing diabetes rates can be explained by the enormous increase in the global burden of obesity [3]. According to data from WHO, more than 1.9 billion adults were overweight in 2014; of these 600 million were obese [4]. Diabetes is associated with a significantly increased risk for all-cause mortality [5]. From the pathological perspective, there are two main types of diabetes: type 1 diabetes mellitus (T1DM), which is characterized by pancreatic β-cell secretion deficiency, and type 2 diabetes mellitus (T2DM), which is preceded by prediabetes in most individuals [6], and is caused by a complex interplay between insulin resistance and β-cell dysfunction [7].
- Increased body adiposity leads to a greater risk of developing T2DM even with at normal body mass index (BMI) [8]. Dysfunction at the cellular level within the adipose tissue has been linked to insulin resistance and T2DM [9]. It is now well-established that adipose tissue is a metabolically highly active organ, secreting a plethora of molecules, with more than 600 identified so far [10]. These biologically active molecules, collectively known as adipocytokines, have been suggested to play a significant role in insulin resistance [11], β-cell dysfunction [12], as well as the occurrence of diabetes [13] and associated comorbidities [1415].
- Omega-3 fatty acids, a group of polyunsaturated fatty acids, have gained increasing popularity among general population and clinicians for their suggested positive modulatory effects on a variety of physiological function. Eicosapentaenoic acid (EPA) and docosahexaenoic acid (DHA) represent the two major types of omega-3 fatty acids. EPA and DHA are mainly gained from seafood consumption, such as from fatty fish. These fatty acids are essential, as they cannot be produced by the human body, but have to be obtained by consuming marine food, such as fatty fish and fish oil. Supplementing omega- 3 fatty acids was estimated to costs of 34.7 billion USD in 2016 [16]. These supplements have been used in managing a variety of clinical conditions and are believed to have a plethora of health benefits [17].
- Regarding the effects of omega-3 fatty acids on the risk of developing diabetes, studies have shown mixed results [1819]. Positive effects have been reported in relation to diabetic complications [20]. Omega-3 fatty acids have also been associated with favourable outcomes on adiponectin and leptin [21] and a range of inflammatory cytokines [22].
- Given their ever-increasing popularity and the emerging evidence suggesting positive modulatory effects on signalling molecules, including adypocytokines, it is of high relevance to investigate the influence of omega-3 fatty acid supplementation on adipocytokine plasma concentration in prediabetic and diabetic individuals.
INTRODUCTION
- Literature search
- PubMed, Medline, EMBASE, Scopus, Web of Science, Google Scholar, Cochrane Trial Register, WHO Clinical Trial Registry Platform, and Clinicaltrial.gov Registry were used to systematically search for randomized controlled trials. We did not use any language restriction in the search. The literature was searched from inception to August 1, 2017. Key words included, among others: fatty acids, omega-3, fish oil, EPA, DHA, adipokines, adipocytokines, leptin, adiponectin, and clinical trial. In addition, related articles in electronic databases were also searched. Retrieved articles, systematic reviews and meta-analyses were searched manually in order to identify any overlooked additional potentially relevant trials.
- Study selection
- We used the following inclusion criteria: (1) intervention involving supplementation with EPA, DHA, both EPA and DHA, and fish oil; (2) randomized controlled trials with parallel or cross-over design; (3) involving adult (≥18 years) human subjects diagnosed with any of the following clinical conditions: insulin resistance, impaired glucose tolerance, impaired fasting glucose, or T2DM; (4) a minimum of 4 weeks intervention period; (5) encompassed the evaluation the outcome of interest to this meta-analysis; and (6) reported post-intervention mean values or change from baseline values with standard deviation (SD).
- We applied the following exclusion criteria: (1) non-interventional studies, (2) uncontrolled studies, (3) lack of sufficient information on baseline or follow-up plasma concentration values of the selected adipocytokines, and (4) reviews, conference abstracts, commentaries, case reports, or duplicate publication from the same study.
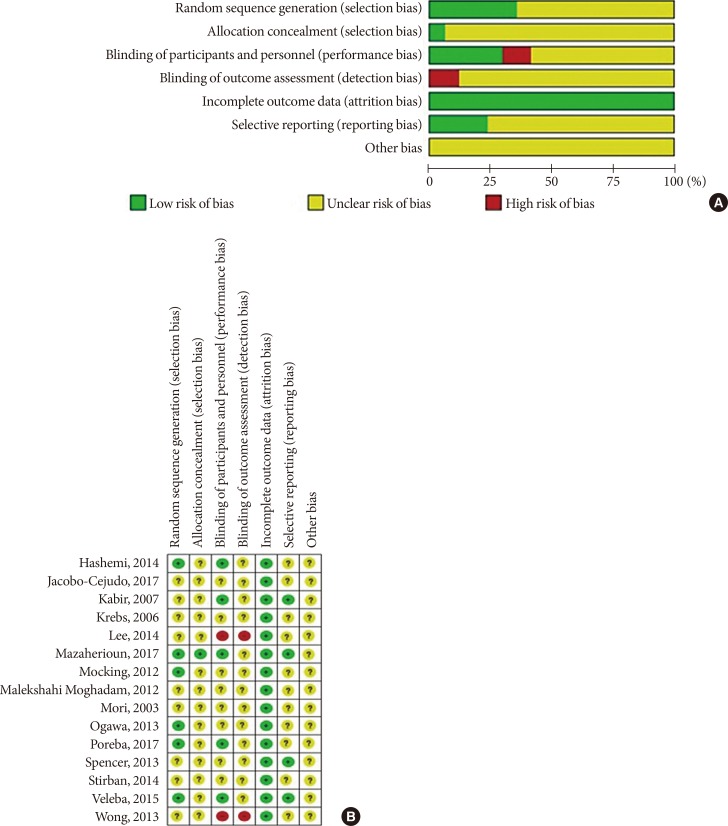
- Risk of bias assessment
- We used Cochrane Collaboration's tool for assessing the risk of bias in randomized trials in order to assess the risk of bias of included studies (low, unclear, high) with respect to following study characteristics: random sequence generation (selection bias), allocation concealment (selection bias), blinding of participants and personnel (performance bias), blinding of outcome assessment (detection bias), incomplete outcome data (attrition bias), selective reporting (reporting bias), and others [23].
- Data extraction and statistical analysis
- From every study included, the two authors independently extracted the following information into a data spread sheet: family name of the first author of the study; publication year; characteristics of trial participants (number, age and gender); duration of the intervention; definition of the intervention and respective control; and assessed outcomes.
- We extracted values of group means and corresponding SD. Where medians or interquartile ranges were reported instead of means, we used formulas proposed by Hozo et al. [24] to calculate the means and SD values. Where standard error of the mean (SEM) was only reported, SD was estimated using the following formula: SD=SEM×square root (n), where n is the number of subjects. The primary end point was change in circulating levels of adipocytokines, which were reported as changes between the values of arithmetic means at the end of the study-baseline [25]. SD of mean differences (MDs) were calculated as SD=square root [(SDbaseline)2+(SDend of treatment)2−(2r×SDbaseline×SDend of treatment)] for each group, assuming that r=0.5 [26].
- We used the software Review Manager 5.3 as provided by the Cochrane Collaboration [27]. We applied the inverse-variance, random effects model of DerSimonian and Laird [28] to calculate the pooled estimates of the weighted MDs between the intervention and control groups, because this model incorporates between-study variability and provides a more conservative estimate of the average effect size.
- The standard chi-square test was used as a statistical measure of heterogeneity between the different studies. The I2 value was applied to determine the magnitude of inconsistency [29], calculated as I2=[(Q−df)]/Q×100%, Q being the χ2 value and df the corresponding degree of freedom. An I2 value of greater than 50.0% was defined as a cut-off to determine considerable heterogeneity between the included studies.
- Sensitivity analysis through the leave-one-out method was employed to explore whether the dependency of the results on individual studies when these reported substantially different effect-sizes than the other studies.
- We used the funnel-plot method to test for publication bias. In this method, the difference in mean changes were plotted against their standard errors to measure the precision of the studies. Where there was any disagreement between the authors, the data were revisited and agreed on by discussion by the authors.
METHODS
- Literature search and study characteristics
- After applying all the selection criteria, 15 studies were included in the systematic review [303132333435363738394041424344]. These studies reported the following outcomes: plasminogen-activator inhibitor 1 (PAI-1), adiponectin, leptin, resistin, tumor necrosis factor α (TNF-α), and interleukin 6 (IL-6). One study [42] had a cross-over design, and could not be included in the quantitative synthesis (meta-analysis) in Review Manager; hence, 14 studies with parallel design were included in the meta-analysis [3031323334353637383940414344]. Fig. 1 shows a detailed overview of the search strategy. Fig. 2A represents the overall risk of bias summary according to the defined characteristics, and Fig. 2B provides an overview across all individual studies included in the systematic review.
- The studies included in the meta-analysis included a total of 29 treatment arms, comprising a total of 685 trial participants (Table 1). Most studies involved subjects with T2DM; Krebs et al. [33], Spencer et al. [41], and Wong et al. [44] enrolled patients with prediabetes. One study [33] was conducted only with female subjects, otherwise both sexes were represented. The trial duration ranged from 6 to 24 weeks. Interventions in most studies consisted of omega-3 supplementation alone, in two studies [3344] intended weight loss was a part of the intervention. Most studies used both EPA and DHA in the intervention, one study [30] used only EPA, and in one study EPA and DHA [38] were two different treatment arms, so that effect sizes were pooled separately.
- Influence of omega-3 supplementation on plasma concentrations of adipocytokines
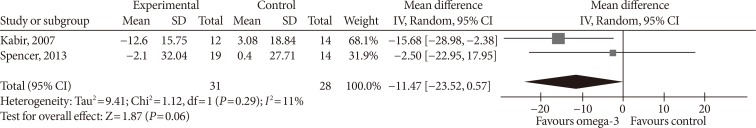
- Two studies reported PAI-1 levels. Kabir et al. [32] used IU/mL as unit, and conversion was done to ng/mL [45]. Omega-3 supplementation did not significantly affect PAI-1 levels (MD, −11.47 ng/mL; 95% confidence interval [CI], −23.52 to 0.57; P=0.06, I2=11%) (Fig. 3).
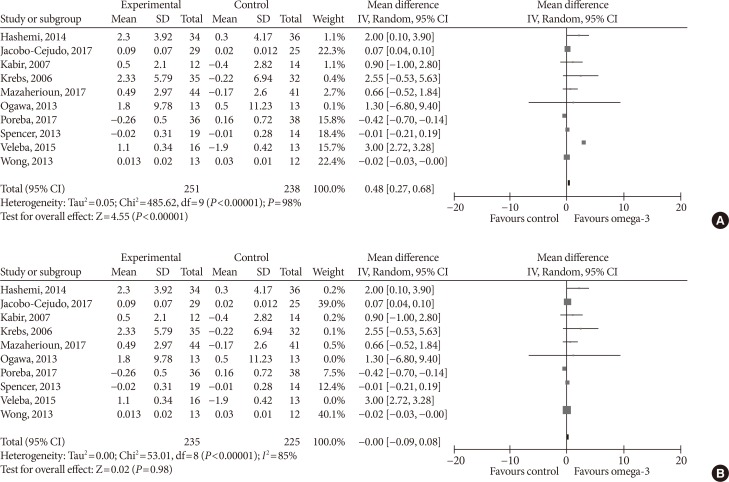
- Effect sizes for adiponectin were pooled from a total of 10 studies. Omega-3 supplementation significantly increased plasma adiponectin concentration (MD, 0.48 µg/mL; 95% CI, 0.27 to 0.68; P<0.00001, I2=98%) (Fig. 4A). For the sensitivity analysis, we eliminated Veleba et al. [43], because this study reported an effect which was significantly greater than that of other individual studies. No effects of omega-3 supplementation on adiponectin concentration were observed (MD, 0.00 µg/mL; 95% CI, −0.09 to 0.08; P=0.98, I2=85%) (Fig. 4B) in this sensitivity analysis.
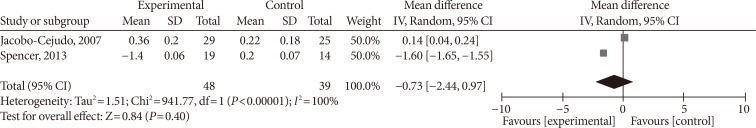
- With regards to effects on resistin, omega-3 supplementation did not affect its levels in a statistically significant way (MD, −0.77 ng/mL; 95% CI, −2.44 to 0.97; P=0.4, I2=100%) (Fig. 5).
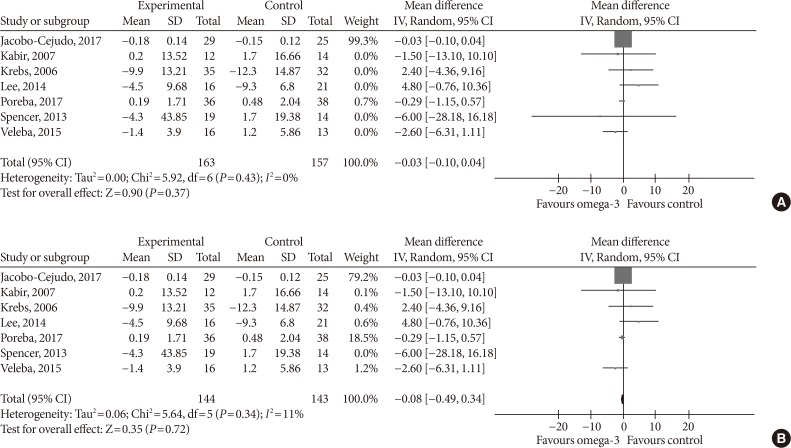
- Supplementing omega-3 fatty acids did not significantly alter leptin levels (MD, −0.03 ng/mL; 95% CI, −0.10 to 0.04; P=0.37, I2=0%) (Fig. 6A). As the effect reported in Spencer et al. [41] was considerably different compared with that of other individual studies, we eliminated it from the analysis, this did result in a significant change in effect size (MD, −0.08 ng/mL; 95% CI, −0.49 to 0.34; P=0.72, I2=11%) (Fig. 6B).
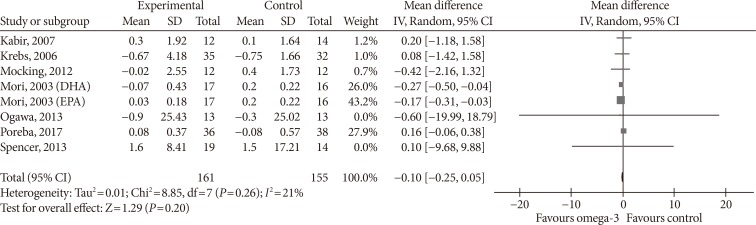
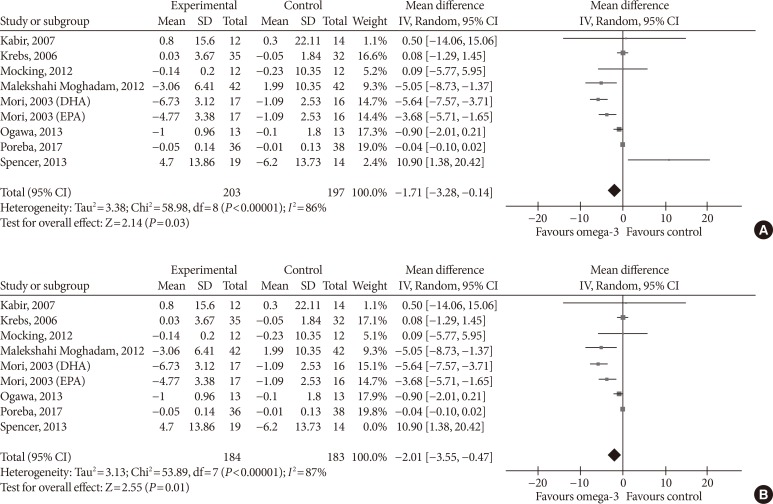
- Omega-3 supplementation also exerted an effect on plasma concentrations of inflammatory cytokines IL-6 and TNF-α. The effects on IL-6 did not reach statistical significance (MD, −0.10 pg/mL; 95% CI, −0.25 to 0.05; P=0.2, I2=21%) (Fig. 7), but TNF-α levels significantly reduced (MD, −1.71; 95% CI, −3.38 to −0.14; P=0.03, I2=86%) (Fig. 8A), this effect also remained after removing Spencer et al. [41] for the sensitivity analysis, as this was the only study which reported an increase in TNF-α levels in the primary analysis (MD, −2.01 pg/mL; 95% CI, −3.55 to −0.47; P=0.01, I2=87%) (Fig. 8B).
- Subgroup-analysis
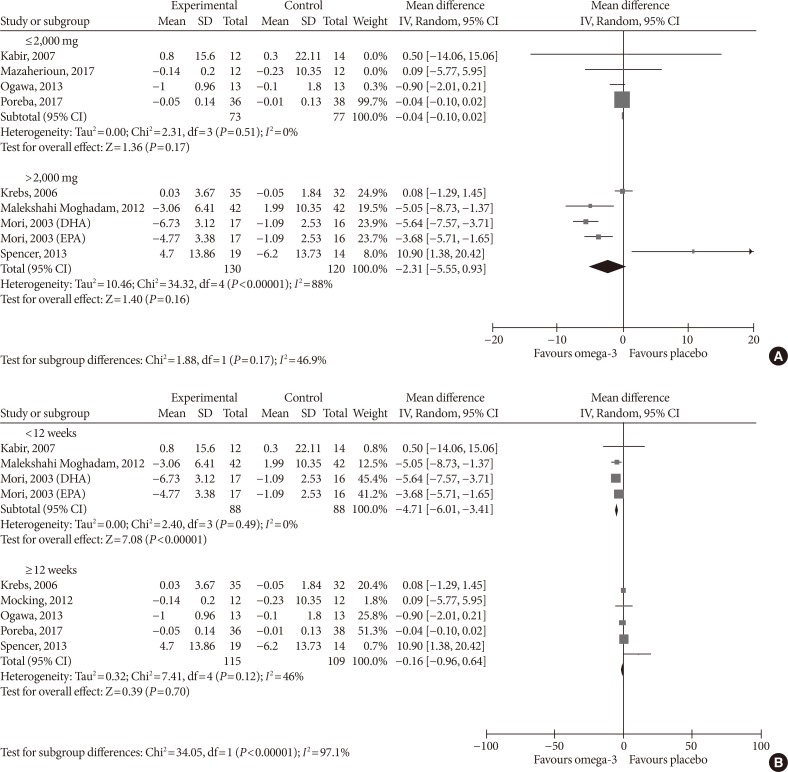
- As adiponectin and TNF-α were the only two outcomes whose blood levels were significantly affected by omega-3 supplementation in the primary analysis and we found considerable study heterogeneity, we conducted a subgroup analysis by dose (low ≤2,000 mg, high >2,000 mg) and treatment duration (<12, ≥12 weeks) to investigate whether the effect of the intervention in these outcomes varied between the subgroups.
- For adiponectin, omega-3 significantly increased its levels when supplemented in high dose (MD, 0.62 µg/mL; 95% CI, 0.40 to 0.85; P<0.00001, I2=99%); low-dose supplementation did not lead to significant changes (MD, 0.48 µg/mL; 95% CI, −0.73 to 1.69; P=0.44, I2=67%; test for subgroup differences: P=0.82, I2=0%) (Fig. 9A). As for treatment duration, we found significant effects in the subgroup ≥12 weeks (MD, 0.47 µg/mL; 95% CI, 0.26 to 0.68; P<0.00001, I2=99%), while shorter treatment duration did not produce statistically significant effects (MD, 0.73 µg/mL; 95% CI, −0.28 to 1.73; P=0.16, I2=0%; test for subgroup differences: P=0.62, I2=0%) (Fig. 9B).
- For TNF-α, omega-3 did not significantly change the levels neither in the low-dose (MD, −0.04 pg/mL; 95% CI, −0.10 to 0.02; P=0.17, I2=0%) nor in the high-dose group (MD, −2.31 pg/mL; 95% CI, −5.55 to 0.93; P=0.16, I2=88%; test for subgroup differences: P=0.17, I2=46.9%) (Fig. 10A). Supplementing omega-3 for less than 12 weeks significantly reduced TNF-α levels (MD, −4.71 pg/mL; 95% CI, −6.01 to −3.41; P<0.00001, I2=0%); whilst no statistically significant effects were found with longer supplementation (MD, −0.16 pg/mL; 95% CI, −0.96 to 0.64; P=0.7, I2=46%; test for subgroup differences: P<0.00001, I2=97.1%) (Fig. 10B).
- Publication bias
- Visual inspection of funnel plots for adiponectin, leptin, IL-6, and TNF-α (Fig. 11) revealed a moderate asymmetry in all of the outcomes, so that a publication bias cannot be excluded and we cannot ascertain that a non-publication of negative or inconclusive data did not influence our meta-analysis.
RESULTS
- To the best of our knowledge, this is the first meta-analysis to investigate the results of omega-3 supplementation on adipocytokine levels in prediabetic and diabetic individuals. We found that omega-3 supplementation has no statistically significant effects on levels of PAI-1, resistin, leptin, and IL-6. We found that omega-3 can significantly increase adiponectin levels, but study heterogeneity was very high in this analysis (I2=98%). Moreover, this effect was dependent on one individual study, as it completely disappeared once we conducted sensitivity analysis. Regarding TNF-α, omega-3 supplementation reduced its levels both in the primary as well in the sensitivity analysis, but with considerable study heterogeneity in both analyses. We conducted a subgroup analysis based on omega-3 dose and treatment duration for these two outcomes in order to elucidate whether the effects of omega-3 supplementation in the primary outcomes varied between the subgroups via a test of interaction (indicating effect modification). We found that for TNF-α, omega-3 supplementation has different effects in subgroups with different treatment durations while using 12 weeks as the cut-off value, i.e., there was significant effect modification based on treatment duration. Interestingly, lower treatment duration significantly reduced TNF-α levels as compared to longer treatment duration. We found no effect modification in the dose subgroup analysis for TNF-α levels, nor for dose or treatment duration for adiponectin levels.
- PAI-1's associations with obesity and diabetes have been established in the 1980s [46], and it is nowadays well established that elevated levels of PAI-1 are associated with the development of T2DM [47] and cardiovascular events and mortality [48]. Intervention to reduce the levels of PAI-1 have therefore been recognized as a priority in this population [49].
- Leptin could be righteously called the master hormone of all adipokines, because of the variety of physiological functions that it controls and they are all of great relevance in diabetes [50]. Body fat mass is the single most important determinant of leptin levels in individuals, but insulin resistance that occurs in T2DM was found to be associated with higher leptin levels independently of body fat mass [51]. Hyperleptinaemia is a marker of leptin resistance, a pathophysiological condition where tissues do not respond to leptin signaling, which further potentiates the metabolic and cardiovascular disarrangements that occur in face of diabetes [52]. Consequently, reducing blood leptin levels is suggested to ameliorate leptin sensitivity [53], but a recently conducted meta-analysis, which was not only constrained to prediabetic and diabetic individuals, found that moderate, but significant reduction in leptin levels was achieved with omega-3 fatty acid supplementation in non-obese individuals, whereas smaller and non-significant effects were observed in obese individuals [54], but the grade of reduction was greater than the one revealed in our analysis in both groups.
- Adiponectin circulates in relatively high concentrations (µg/mL) as compared to other adipokines, and has unique physiological properties with a profound impact on glucose and fatty acid metabolism as well as the cardiovascular system, which has placed it in the center of interest of the scientific community. Hypoadiponectinaemia paradoxically occurs in obesity and diabetes, and due to its insulin-sensitizing and anti-inflammatory properties, increasing circulating levels of adiponectin is believed to result to improved metabolic and cardiovascular functions [55]. Our results are in line with those previously reported in meta-analysis [56] and narrative reviews [21]. Interestingly, the increase in adiponectin levels we observed was largely dependent on one study and there was unexplained study heterogeneity, as we could not infer effect modification neither to treatment duration nor omega-3 dose used. The unexplained heterogeneity in adiponectin levels was also found in previous meta-analysis [56].
- Resistin is a relatively newly discovered adipocytokine which is suggested to exert very important effects that link obesity to insulin resistance and T2DM [57], and evidence also amounts with regards to its role in mechanisms leading to cardiovascular disease, including inflammation, endothelial dysfunction, thrombosis, angiogenesis, and smooth muscle function. Reducing the levels of resistin is therefore seen as a promising strategy [58]. To our knowledge, this is the first meta-analysis that investigated the effects of omega-3 supplementation on resistin, and even though the effect was non-significant with a very high degree of study heterogeneity, our results suggest a potential modulatory role of omega-3 fatty acids on this interesting adipocytokine.
- TNF-α and IL-6 are one of the main proinflammatory cytokines that are also secreted to a large part from the adipose tissue which is infiltrated by macrophages and other immune cells and their levels are elevated in diabetic individuals, resulting to inflammation [59]. Inflammation not only contributes to the etiology of diabetes, but once the disease has set on, it aggravates its clinical course and is associated with a range of complications [60]. The reducing effects of omega-3 fatty acids on these two cytokines might be explained by their general anti-inflammatory properties [23]. The reduction in subclinical inflammation by supplementing EPA and DHA along with potential positive modulation of other physiological pathways that are brought about by changes in plasma concentrations of herein investigates cytokines may contribute to improved management of patients suffering from prediabetes or T2DM. Interestingly, our work identified that for TNF-α, treatment duration infers effect modification, where shorter treatment duration is associated with higher reductions in TNF-α levels.
- However, our systematic review and meta-analysis has several limitations. In general, most studies which were included did not provide sufficient information to be able to assess the risk of bias across many of the pre-set out criteria. Based on the I2 measure of greater than 50%, substantial study heterogeneity was found across outcome parameters investigated. The population analyzed was also heterogeneous, as the patients enrolled differed in terms of general characteristics, such as age, BMI, male/female ratio, medication use. Omega-3 supplementation also varied across the included studies with regards to the dose, duration, and EPA/DHA ratio. Moreover, intentional weight loss was a part of intervention in two studies, whereas the remaining studies only included omega-3 supplementation as intervention. This is important, as weight loss is known to affect a variety of metabolic parameters. Furthermore, two outcome parameters (PAI-1 and resistin) were inspected on the basis of only two studies with a small sample size. Finally, we could not exclude publication bias in our meta-analysis. These limitations implicate that a cautious interpretation of the results of the present systematic review and meta-analysis is necessary.
DISCUSSION
-
CONFLICTS OF INTEREST: No potential conflict of interest relevant to this article was reported.
NOTES
- 1. World Health Organization. Diabetes fact sheet cited 2018 Apr 9. Available from: http://www.who.int/mediacentre/factsheets/fs312/en.
- 2. American Diabetes Association. Economic costs of diabetes in the U.S. in 2012. Diabetes Care 2013;36:1033-1046. ArticlePubMedPMCPDF
- 3. Eckel RH, Kahn SE, Ferrannini E, Goldfine AB, Nathan DM, Schwartz MW, Smith RJ, Smith SR. Endocrine Society. American Diabetes Association. European Association for the Study of Diabetes. Obesity and type 2 diabetes: what can be unified and what needs to be individualized? Diabetes Care 2011;34:1424-1430. ArticlePubMedPMCPDF
- 4. World Health Organization (WHO). Obesity and overweight fact sheet cited 2018 Apr 9. Available from: http://www.who.int/mediacentre/factsheets/fs311/en.
- 5. Bertoni AG, Krop JS, Anderson GF, Brancati FL. Diabetes-related morbidity and mortality in a national sample of U.S. elders. Diabetes Care 2002;25:471-475. ArticlePubMedPDF
- 6. Tabak AG, Herder C, Rathmann W, Brunner EJ, Kivimaki M. Prediabetes: a high-risk state for diabetes development. Lancet 2012;379:2279-2290. ArticlePubMedPMC
- 7. Cerf ME. Beta cell dysfunction and insulin resistance. Front Endocrinol (Lausanne) 2013;4:37ArticlePubMedPMC
- 8. Gomez-Ambrosi J, Silva C, Galofre JC, Escalada J, Santos S, Gil MJ, Valenti V, Rotellar F, Ramirez B, Salvador J, Fruhbeck G. Body adiposity and type 2 diabetes: increased risk with a high body fat percentage even having a normal BMI. Obesity (Silver Spring) 2011;19:1439-1444. ArticlePubMedPDF
- 9. Guilherme A, Virbasius JV, Puri V, Czech MP. Adipocyte dysfunctions linking obesity to insulin resistance and type 2 diabetes. Nat Rev Mol Cell Biol 2008;9:367-377. ArticlePubMedPMCPDF
- 10. Lehr S, Hartwig S, Sell H. Adipokines: a treasure trove for the discovery of biomarkers for metabolic disorders. Proteomics Clin Appl 2012;6:91-101. ArticlePubMedPDF
- 11. Rabe K, Lehrke M, Parhofer KG, Broedl UC. Adipokines and insulin resistance. Mol Med 2008;14:741-751. ArticlePubMedPMCPDF
- 12. Dunmore SJ, Brown JE. The role of adipokines in β-cell failure of type 2 diabetes. J Endocrinol 2013;216:T37-T45. ArticlePubMed
- 13. Sans S, Padro T, Tuomilehto J, Badimon L. Incidence of diabetes and serum adipokines in Catalonian men: the ADIPOCAT study. Ann Med 2013;45:97-102. ArticlePubMed
- 14. Gulcelik NE, Karakaya J, Gedik A, Usman A, Gurlek A. Serum vaspin levels in type 2 diabetic women in relation to microvascular complications. Eur J Endocrinol 2009;160:65-70. ArticlePubMed
- 15. Pradeepa R, Surendar J, Indulekha K, Chella S, Anjana RM, Mohan V. Association of serum adiponectin with diabetic microvascular complications among south Indian type 2 diabetic subjects: (CURES-133). Clin Biochem 2015;48:33-38. ArticlePubMed
- 16. Schultz H. Retail omega-3s sales to hit $34.7 billion in 2016, report predicts updated 2012 Oct 3. Available from: http://www.nutraingredients-usa.com/Markets/Retail-omega-3s-sales-to-hit-34.7-billion-in-2016-report-predicts.
- 17. Swanson D, Block R, Mousa SA. Omega-3 fatty acids EPA and DHA: health benefits throughout life. Adv Nutr 2012;3:1-7. ArticlePubMedPMC
- 18. Wu JH, Micha R, Imamura F, Pan A, Biggs ML, Ajaz O, Djousse L, Hu FB, Mozaffarian D. Omega-3 fatty acids and incident type 2 diabetes: a systematic review and meta-analysis. Br J Nutr 2012;107(Suppl 2):S214-S227. ArticlePubMedPMC
- 19. Virtanen JK, Mursu J, Voutilainen S, Uusitupa M, Tuomainen TP. Serum omega-3 polyunsaturated fatty acids and risk of incident type 2 diabetes in men: the Kuopio Ischemic Heart Disease Risk Factor study. Diabetes Care 2014;37:189-196. ArticlePubMedPDF
- 20. Han E, Yun Y, Kim G, Lee YH, Wang HJ, Lee BW, Cha BS, Kim BS, Kang ES. Effects of omega-3 fatty acid supplementation on diabetic nephropathy progression in patients with diabetes and hypertriglyceridemia. PLoS One 2016;11:e0154683. ArticlePubMedPMC
- 21. Gray B, Steyn F, Davies PS, Vitetta L. Omega-3 fatty acids: a review of the effects on adiponectin and leptin and potential implications for obesity management. Eur J Clin Nutr 2013;67:1234-1242. ArticlePubMedPDF
- 22. Kang JX, Weylandt KH. Modulation of inflammatory cytokines by omega-3 fatty acids. Subcell Biochem 2008;49:133-143. ArticlePubMed
- 23. Higgins JP, Altman DG, Gotzsche PC, Juni P, Moher D, Oxman AD, Savovic J, Schulz KF, Weeks L, Sterne JA. Cochrane Bias Methods Group. Cochrane Statistical Methods Group. The Cochrane Collaboration's tool for assessing risk of bias in randomised trials. BMJ 2011;343:d5928ArticlePubMedPMC
- 24. Hozo SP, Djulbegovic B, Hozo I. Estimating the mean and variance from the median, range, and the size of a sample. BMC Med Res Methodol 2005;5:13ArticlePubMedPMCPDF
- 25. Follmann D, Elliott P, Suh I, Cutler J. Variance imputation for overviews of clinical trials with continuous response. J Clin Epidemiol 1992;45:769-773. ArticlePubMed
- 26. Higgins JPT, Greean S. Cochrane handbook for systematic reviews of interventions, version 5.1.0 cited 2018 Apr 9. Available from: http://handbook.cochrane.org.
- 27. Cochrane Community. Review Manager 5.3 (cited 2018 Apr 9). Available from: http://tech.cochrane.org/revman/download.
- 28. DerSimonian R, Laird N. Meta-analysis in clinical trials. Control Clin Trials 1986;7:177-188. ArticlePubMed
- 29. Higgins JP, Thompson SG. Quantifying heterogeneity in a meta-analysis. Stat Med 2002;21:1539-1558. ArticlePubMed
- 30. Hashemi SB, Sarbolouki S, Djalali M, Dorosty A, Djazayery SA, Eshraghian MR, Ebadi A, Sharif MR, Nikoueinejad H. Adiponectin and glycemic profiles in type 2 diabetes patients on eicosapentaenoic acid with or without vitamin E. Acta Endo (Buc) 2014;10:84-96.Article
- 31. Jacobo-Cejudo MG, Valdes-Ramos R, Guadarrama-Lopez AL, Pardo-Morales RV, Martinez-Carrillo BE, Harbige LS. Effect of n-3 polyunsaturated fatty acid supplementation on metabolic and inflammatory biomarkers in type 2 diabetes mellitus patients. Nutrients 2017;9:E573. Article
- 32. Kabir M, Skurnik G, Naour N, Pechtner V, Meugnier E, Rome S, Quignard-Boulange A, Vidal H, Slama G, Clement K, Guerre-Millo M, Rizkalla SW. Treatment for 2 mo with n 3 polyunsaturated fatty acids reduces adiposity and some atherogenic factors but does not improve insulin sensitivity in women with type 2 diabetes: a randomized controlled study. Am J Clin Nutr 2007;86:1670-1679. ArticlePubMed
- 33. Krebs JD, Browning LM, McLean NK, Rothwell JL, Mishra GD, Moore CS, Jebb SA. Additive benefits of long-chain n-3 polyunsaturated fatty acids and weight-loss in the management of cardiovascular disease risk in overweight hyperinsulinaemic women. Int J Obes (Lond) 2006;30:1535-1544. ArticlePubMedPDF
- 34. Lee TC, Ivester P, Hester AG, Sergeant S, Case LD, Morgan T, Kouba EO, Chilton FH. The impact of polyunsaturated fatty acid-based dietary supplements on disease biomarkers in a metabolic syndrome/diabetes population. Lipids Health Dis 2014;13:196ArticlePubMedPMCPDF
- 35. Mazaherioun M, Saedisomeolia A, Javanbakht MH, Koohdani F, Eshraghian MR, Djalali M. Beneficial effects of n-3 polyunsaturated fatty acids on adiponectin levels and AdipoR gene expression in patients with type 2 diabetes mellitus: a randomized, placebo-controlled, double-blind clinical trial. Arch Med Sci 2017;13:716-724. ArticlePubMed
- 36. Mocking RJ, Assies J, Bot M, Jansen EH, Schene AH, Pouwer F. Biological effects of add-on eicosapentaenoic acid supplementation in diabetes mellitus and co-morbid depression: a randomized controlled trial. PLoS One 2012;7:e49431. ArticlePubMedPMC
- 37. Malekshahi Moghadam A, Saedisomeolia A, Djalali M, Djazayery A, Pooya S, Sojoudi F. Efficacy of omega-3 fatty acid supplementation on serum levels of tumour necrosis factor-alpha, C-reactive protein and interleukin-2 in type 2 diabetes mellitus patients. Singapore Med J 2012;53:615-619. PubMed
- 38. Mori TA, Woodman RJ, Burke V, Puddey IB, Croft KD, Beilin LJ. Effect of eicosapentaenoic acid and docosahexaenoic acid on oxidative stress and inflammatory markers in treated-hypertensive type 2 diabetic subjects. Free Radic Biol Med 2003;35:772-781. ArticlePubMed
- 39. Ogawa S, Abe T, Nako K, Okamura M, Senda M, Sakamoto T, Ito S. DIMS Study Group. Eicosapentaenoic acid improves glycemic control in elderly bedridden patients with type 2 diabetes. Tohoku J Exp Med 2013;231:63-74. ArticlePubMed
- 40. Poreba M, Mostowik M, Siniarski A, Golebiowska-Wiatrak R, Malinowski KP, Haberka M, Konduracka E, Nessler J, Undas A, Gajos G. Treatment with high-dose n-3 PUFAs has no effect on platelet function, coagulation, metabolic status or inflammation in patients with atherosclerosis and type 2 diabetes. Cardiovasc Diabetol 2017;16:50ArticlePubMedPMCPDF
- 41. Spencer M, Finlin BS, Unal R, Zhu B, Morris AJ, Shipp LR, Lee J, Walton RG, Adu A, Erfani R, Campbell M, McGehee RE Jr, Peterson CA, Kern PA. Omega-3 fatty acids reduce adipose tissue macrophages in human subjects with insulin resistance. Diabetes 2013;62:1709-1717. ArticlePubMedPMCPDF
- 42. Stirban A, Nandrean S, Götting C, Stratmann B, Tschoepe D. Effects of n-3 polyunsaturated fatty acids (PUFAs) on circulating adiponectin and leptin in subjects with type 2 diabetes mellitus. Horm Metab Res 2014;46:490-492. ArticlePubMed
- 43. Veleba J, Kopecky J Jr, Janovska P, Kuda O, Horakova O, Malinska H, Kazdova L, Oliyarnyk O, Skop V, Trnovska J, Hajek M, Skoch A, Flachs P, Bardova K, Rossmeisl M, Olza J, de Castro GS, Calder PC, Gardlo A, Fiserova E, Jensen J, Bryhn M, Kopecky J Sr, Pelikanova T. Combined intervention with pioglitazone and n-3 fatty acids in metformin-treated type 2 diabetic patients: improvement of lipid metabolism. Nutr Metab (Lond) 2015;12:52ArticlePubMedPMCPDF
- 44. Wong AT, Chan DC, Barrett PH, Adams LA, Watts GF. Supplementation with n3 fatty acid ethyl esters increases large and small artery elasticity in obese adults on a weight loss diet. J Nutr 2013;143:437-441. ArticlePubMed
- 45. Declerck PJ, Alessi MC, Verstreken M, Kruithof EK, Juhan-Vague I, Collen D. Measurement of plasminogen activator inhibitor 1 in biologic fluids with a murine monoclonal antibody-based enzyme-linked immunosorbent assay. Blood 1988;71:220-225. ArticlePubMedPDF
- 46. Vague P, Juhan-Vague I, Aillaud MF, Badier C, Viard R, Alessi MC, Collen D. Correlation between blood fibrinolytic activity, plasminogen activator inhibitor level, plasma insulin level, and relative body weight in normal and obese subjects. Metabolism 1986;35:250-253. ArticlePubMed
- 47. Yarmolinsky J, Bordin Barbieri N, Weinmann T, Ziegelmann PK, Duncan BB, Ines Schmidt M. Plasminogen activator inhibitor-1 and type 2 diabetes: a systematic review and meta-analysis of observational studies. Sci Rep 2016;6:17714. ArticlePubMedPMCPDF
- 48. Schneider DJ, Sobel BE. PAI-1 and diabetes: a journey from the bench to the bedside. Diabetes Care 2012;35:1961-1967. ArticlePubMedPMCPDF
- 49. Lyon CJ, Hsueh WA. Effect of plasminogen activator inhibitor-1 in diabetes mellitus and cardiovascular disease. Am J Med 2003;115(Suppl 8A):62S-68S. ArticlePubMed
- 50. Dardeno TA, Chou SH, Moon HS, Chamberland JP, Fiorenza CG, Mantzoros CS. Leptin in human physiology and therapeutics. Front Neuroendocrinol 2010;31:377-393. ArticlePubMedPMC
- 51. Fischer S, Hanefeld M, Haffner SM, Fusch C, Schwanebeck U, Kohler C, Fucker K, Julius U. Insulin-resistant patients with type 2 diabetes mellitus have higher serum leptin levels independently of body fat mass. Acta Diabetol 2002;39:105-110. ArticlePubMedPDF
- 52. Martin SS, Qasim A, Reilly MP. Leptin resistance: a possible interface of inflammation and metabolism in obesity-related cardiovascular disease. J Am Coll Cardiol 2008;52:1201-1210. PubMedPMC
- 53. Zhou Y, Rui L. Leptin signaling and leptin resistance. Front Med 2013;7:207-222. ArticlePubMedPMCPDF
- 54. Hariri M, Ghiasvand R, Shiranian A, Askari G, Iraj B, Salehi-Abargouei A. Does omega-3 fatty acids supplementation affect circulating leptin levels? A systematic review and meta-analysis on randomized controlled clinical trials. Clin Endocrinol (Oxf) 2015;82:221-228. ArticlePubMed
- 55. Chandran M, Phillips SA, Ciaraldi T, Henry RR. Adiponectin: more than just another fat cell hormone? Diabetes Care 2003;26:2442-2450. ArticlePubMedPDF
- 56. Wu JH, Cahill LE, Mozaffarian D. Effect of fish oil on circulating adiponectin: a systematic review and meta-analysis of randomized controlled trials. J Clin Endocrinol Metab 2013;98:2451-2459. ArticlePubMedPMC
- 57. Kusminski CM, McTernan PG, Kumar S. Role of resistin in obesity, insulin resistance and type II diabetes. Clin Sci (Lond) 2005;109:243-256. ArticlePubMedPDF
- 58. Jamaluddin MS, Weakley SM, Yao Q, Chen C. Resistin: functional roles and therapeutic considerations for cardiovascular disease. Br J Pharmacol 2012;165:622-632. ArticlePubMedPMC
- 59. Goyal R, Faizy AF, Siddiqui SS, Singhai M. Evaluation of TNF-α and IL-6 levels in obese and non-obese diabetics: pre- and postinsulin effects. N Am J Med Sci 2012;4:180-184. ArticlePubMedPMC
- 60. Lontchi-Yimagou E, Sobngwi E, Matsha TE, Kengne AP. Diabetes mellitus and inflammation. Curr Diab Rep 2013;13:435-444. ArticlePubMedPDF
REFERENCES
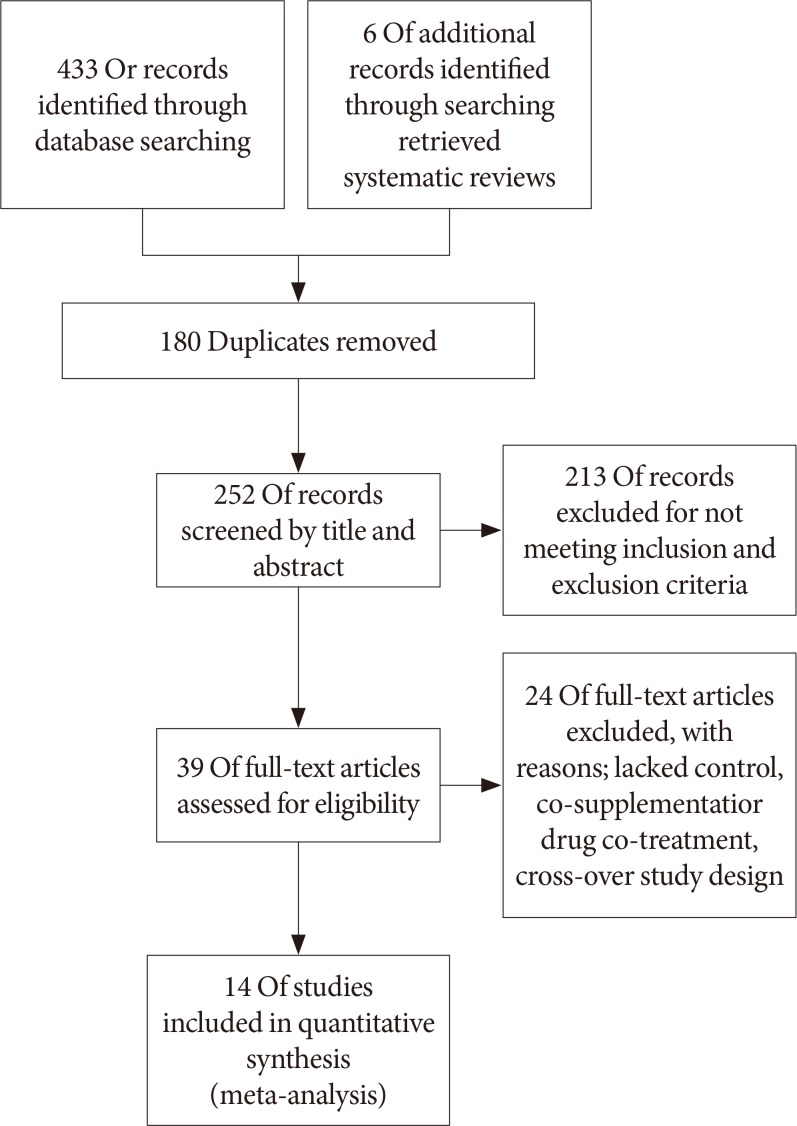
Risk of bias assessment tool. (A) Summary of risk of bias of across the trials included in the systematic review. Information for every study characteristic was pooled from every trial (green: low risk of bias; yellow: unclear risk of bias; red: high risk of bias), combined and overall results expressed in percentages. (B) Overview of risk of bias across individual trials according to study characteristics. Each bias domain was evaluated carefully from every trial and decided whether the information provided reflected a low risk of bias (green), high risk of bias (red), or if insufficient information was provided and the risk of bias was therefore unclear (yellow).
Influence of omega-3 fatty acids supplementation on plasminogen-activator inhibitor 1 levels (ng/mL). Forest plot shows pooled mean differences with 95% confidence intervals (CIs) for two randomized controlled trials. The green colored square represents the point estimate of the effect of the intervention for each trial. The horizontal line joins the upper and lower limits of the 95% CI of the effects. The square area represents the relative weight of the trial in the meta-analysis. The black colored diamond at the bottom represents the pooled mean difference with 95% CI for all study groups. SD, standard deviation; IV, interval variable.

Influence of omega-3 fatty acids supplementation on adiponectin levels (µg/mL). (A) Forest plot shows pooled mean differences with 95% confidence intervals (CIs) for 10 randomized controlled trials. The green colored square represents the point estimate of the effect of the intervention for each trial. The horizontal line joins the upper and lower limits of the 95% CI of the effects. The square area represents the relative weight of the trial in the meta-analysis. The black colored diamond at the bottom represents the pooled mean difference with 95% CI for all study groups. As opposed to graphs for all other outcome parameters, the labels of the X-axis are different, because an increase in adiponectin levels is seen as favorable. (B) Meta-analysis after eliminating Veleba et al. [43] as part of the leave-one-out sensitivity analysis (the trial was given a relative weight of 0.0%). SD, standard deviation; IV, interval variable.
Influence of omega-3 fatty acids supplementation on resisting levels (ng/mL). Forest plot shows pooled mean differences with 95% confidence intervals (CIs) for two randomized controlled trials. The green colored square represents the point estimate of the effect of the intervention for each trial. The horizontal line joins the upper and lower limits of the 95% CI of the effects. The square area represents the relative weight of the trial in the meta-analysis. The black colored diamond at the bottom represents the pooled mean difference with 95% CI for all study groups. SD, standard deviation; IV, interval variable.
Influence of omega-3 fatty acids supplementation on leptin levels (ng/mL). (A) Forest plot shows pooled mean differences with 95% confidence intervals (CIs) for seven randomized controlled trials. The green colored square represents the point estimate of the effect of the intervention for each trial. The horizontal line joins the upper and lower limits of the 95% CI of the effects. The square area represents the relative weight of the trial in the meta-analysis. Notice the absence of the black colored diamond at the bottom as in other graphs because of the magnitude of the pooled mean difference with 95% CI for all study groups. (B) Meta-analysis after eliminating Spencer et al. [41] as part of the leave-one-out sensitivity analysis (the trial was given a relative weight of 0.0%). SD, standard deviation; IV, interval variable.
Influence of omega-3 fatty acids supplementation on interleukin 6 levels (pg/mL). Forest plot shows pooled mean differences with 95% confidence intervals (CIs) for eight intervention effects pooled from seven randomized controlled trials (two separate effects were pooled for docosahexaenoic acid [DHA] and eicosapentaenoic acid [EPA] treatment arms from Mori et al. [38]). The green colored square represents the point estimate of the effect of the intervention for each intervention. The horizontal line joins the upper and lower limits of the 95% CI of the effects. The square area represents the relative weight of the interventions in the meta-analysis. SD, standard deviation; IV, interval variable.
Influence of omega-3 fatty acids supplementation on tumor necrosis factor α levels (pg/mL). (A) Forest plot shows pooled mean differences with 95% confidence intervals (CIs) for nine intervention effects pooled from eight randomized controlled trials (two separate effects were pooled for docosahexaenoic acid [DHA] and eicosapentaenoic acid [EPA] treatment arms from Mori et al. [38]). The green colored square represents the point estimate of the effect of the intervention for each intervention. The horizontal line joins the upper and lower limits of the 95% CI of the effects. The square area represents the relative weight of the interventions in the meta-analysis. (B) Meta-analysis after eliminating Spencer et al. [41] as part of the leave-one-out sensitivity analysis (the trial was given a relative weight of 0.0%). SD, standard deviation; IV, interval variable.
Subgroup analysis on the influence of omega-3 fatty acids supplementation according to (A) omega-3 dose and (B) treatment duration for adiponectin (µg/mL). Forest plot shows pooled mean differences with 95% confidence intervals (CIs). The green colored square represents the point estimate of the effect of the intervention for each trial. The horizontal line joins the upper and lower limits of the 95% CI of the effects. The square area represents the relative weight of the trial in the meta-analysis. The black colored diamond at the bottom represents the pooled mean difference with 95% CI for all study groups. SD, standard deviation; IV, interval variable.

Subgroup analysis on the influence of omega-3 fatty acids supplementation according to (A) omega-3 dose and (B) treatment duration for tumor necrosis factor α (pg/mL). Forest plot shows pooled mean differences with 95% confidence intervals (CIs). The green colored square represents the point estimate of the effect of the intervention for each trial. The horizontal line joins the upper and lower limits of the 95% CI of the effects. The square area represents the relative weight of the trial in the meta-analysis. The black colored diamond at the bottom represents the pooled mean difference with 95% CI for all study groups. SD, standard deviation; IV, interval variable; DHA, docosahexaenoic acid; EPA, eicosapentaenoic acid.

Funnel plot displaying study precision against the mean difference (MD) effect estimate with 95% confidence interval for (A) adiponectin, (B) leptin, (C) interleukin 6, and (D) tumor necrosis factor α. SE, standard error.

General characteristics of randomized controlled trials included in the systematic review
| Reference | Sample size, % female subjects | Age, yr | BMI, kg/m2 | Duration, design | Disease, medication | Intervention (daily EPA/DHA dose) | Control group | Outcome, parameters |
|---|---|---|---|---|---|---|---|---|
| Hashemi et al. (2014) [30] | 70 (I: 41, C: 36) | I: 44±5.0 | I: 27.9±1.7 | 12 Weeks, parallel | T2DM subjects; treated with biguanides and sulfonylureas (76%), sulfonylureas (16%) or biguanides alone (8%) | EPA pearls (2,000 mg) | Placebo (corn oil) | Adiponectin |
| C: 45±4.1 | C: 27.8±1.6 | |||||||
| Jacobo-Cejudo et al. (2017) [31] | 54 (I: 70.6, C: 83.9) | I: 50.4±6.3 | I: 25.6±2.4 | 24 Weeks, parallel | T2DM; therapy with glibenclamide+metformin or metformin alone, received no additional dietary or lifestyle advice | Fish oil (320 mg EPA, 200 mg DHA) | Placebo (cornstarch) | Adiponectin, leptin, resistin |
| C: 48.1±6.9 | C: 26.0±1.6 | |||||||
| Kabir et al. (2007) [32] | 26 (all female) | I: 55±2.0 | 30±2.0 in both groups | 2 Months, parallel | Postmenopausal T2DM women without hypertriglyceridemia; 3 patients treated only with diet, 23 taking oral hypoglycemic treatment (7 only biguanides, 16 sulfonylureas and biguanides), 5 lipid-lowering agents, 6 hormone replacement therapy | Fish oil (1,080 mg EPA, 720 mg DHA) | Placebo (paraffin oil) | Adiponectin, leptin, TNF-α, IL-6, PAI-1 |
| C: 55±1.0 | ||||||||
| Krebs et al. (2006) [33] | 67 (all female) | 44.7±13.2 | 35.0±5.5 | 24 Weeks, parallel | Overweight or obese women with hyperinsulinemia | Fish oil (1,300 mg EPA, 2,900 mg DHA)+weight loss intervention (10% of body weight loss in 12 weeks, 12 weeks weight maintenance) | 5 g oil/day totaling 2.8 g linoleic acid and 1.4 g oleic acid+weight loss intervention (10% of body weight loss in 12 weeks, 12 weeks weight maintenance) | Adiponectin, leptin, TNF-α, IL-6 |
| Lee et al. (2014) [34] | 37 (I: 62.5, C: 71.4) | I: 56.2±8.7 | I: 33.2±4.8 | 8 Weeks, parallel | Early stage T2DM (no evidence of end-stage organ damage secondary to diabetes) | Fish oil (3,580 mg EPA, 2,440 mg DHA) | Placebo (corn oil) | Leptin |
| C: 59.9±9.8 | C: 34.8±5.3 | |||||||
| Mazaherioun et al. (2017) [35] | 85 (I: 34.09, C: 41.4) | I: 51.5±7.45 | I: 29.22±3.58 | 10 Weeks, parallel | T2DM; no insulin, thiazolidinediones or anti-obesity medications | Omega-3 capsules (1,800 mg EPA, 900 mg DHA) | Placebo (paraffin) | Adiponectin |
| C: 50.56±7.21 | C: 29.21±2.90 | |||||||
| Mocking et al. (2012) [36] | 24 (I: 62, C: 42) | I: 53.1±13.8 | I: 29.3±5.1 | 12 Weeks, parallel | Diabetic patients with major depressive disorder (determined by the Composite International Diagnostic Interview standards); therapy with antidepressants for at least 2 months, diabetes treated with diet only, hypoglycemics, insulin, or both | Fish oil (at least 900 mg ethyl-EPA) | Placebo (rapeseed oil+medium chain triglycerides) | TNF-α, IL-6 |
| C: 55.0±8.6 | C: 29.8±4.8 | |||||||
| Malekshahi Moghadam et al. (2012) [37] | 84 (50% in both groups) | I: 55.36±9.88 | I: 27.72±3.47 | 8 Weeks, parallel | T2DM subjects (at least 2 years since diagnosis), all receiving anti-hyperglycemic treatment | Omega-3 capsules (1,548 mg EPA, 828 mg DHA) | Placebo (sunflower oil) | TNF-α |
| C: 52.96±10.72 | C: 27.51±3.16 | |||||||
| Mori et al. (2003) [38]a | 51 (I1: 17,6, I2: 27,7, C: 25) | I1: 61.2±2.3 | I1: 30.6±0.7 | 6 Weeks, parallel | Non-smoking, treated-hypertensive, T2DM men and postmenopausal women; antihypertensive therapy for a minimum of 3 months, oral hypoglycemic, but no insulin therapy | I1: 4 g EPA-capsules per day (96% EPA ethyl ester) | Placebo (olive oil) | TNF-α, IL-6 |
| I2: 60.9±1.9 | I2: 27.9±0.8 | I2: 4 g DHA per day (92% DHA ethyl ester) | ||||||
| C: 61.5±1.9 | C: 29.9±1.0 | |||||||
| Ogawa et al. (2013) [39] | 26 (I: 69, C: 82) | I: 79.5±8.6 | I: 19.9±4.0 | 3 Mllel | Bedridden elderly T2DM patients | Liquid diet rich in EPA (25 mg/100 kcal) and DHA (17 mg/100 kcal)b | Liquid diet lacking EPA and DHA | Adiponectin, TNF-α, IL-6 |
| C: 81.2±7.6 | C: 20.1±3.6 | |||||||
| Poreba et al. (2017) [40] | 74 (I: 38,9, C: 31.6) | I: 64.4±6.7 | I: 30.9 (27.9–34.7) | 3 Months, parallel | T2DM patients with a history of coronary artery disease or peripheral artery disease | Omega-3 drink (1,000 mg EPA, 1,000 mg DHA) | Drink without omega-3 | Adiponectin, leptin, TNF-α, IL-6 |
| C: 66.7±6.8 | C: 31.1 (28.1–32.7)c | |||||||
| Spencer et al. (2013) [41] | 33 (I: 68,4, C: 64,2) | I: 48.8±2.3 | I: 33.4±2.3 | 12 Weeks, parallel | Non-diabetic subjects with either impaired fasting glucose, impaired glucose tolerance (23 subjects), or at least three signs of metabolic syndrome | Fish oil (1,860 mg EPA, 1,500 mg DHA) | Placebo (corn oil) | Adiponectin, leptin, TNF-α, IL-6, PAI-1, resistin |
| C: 53.3±2.2 | C: 33.4±1.1 | |||||||
| Stirban et al. (2014) [42] | 34, No specification of sex | 56.8±8.3 | 31.2±4.1 | 6 Weeks, cross-over | T2DM (duration 9.8± 6.6 years), no history of major cardiovascular events or a surgical or interventional history within the previous 6 months; treated with low dose aspirin (n=20), ACE-inhibitors or AR blockers (n=24), calcium channel blockers (n=5), β-blockers (n=15), diuretics (n=13), and statins (n=13), all withdrawn before measurements; diabetes medication: diet (n=3), oral therapy (n=16), insulin (n=4), oral hypoglycemic plus insulin (n=10), and incretin mimetics (n=1) | Omega-3 capsules (920 mg EPA, 760 mg DHA) | Placebo (olive oil) | Adiponectin, leptin |
| Veleba et al. (2015) [43] | 29, 34 | I: 59.5 | I: 34.0 | 24 Weeks, parallel | T2DM (at least 3 months from diagnosis); metformin as monotherapy as a stable dose (0.5–3.0 g/day) for at least 1 month | Omega-3 concentrate (750 mg EPA, 2,000 mg DHA) | Placebo (corn oil) | Adiponectin, leptin |
| C: 62.0 | C: 30.9 | |||||||
| Wong et al. (2013) [44] | 25, 44 | 60±4.0 | I: 34±2.0 | 16 Weeks, parallel | Middle-aged, centrally obese, normotensive, dyslipidemic (elevated triglycerides, low HDL), insulin resistant adults; 6 subjects receiving lipid-lowering therapy (4 atorvastatin, 2 rosuvastatin), 5 anti-hypertensive treatment (2 on ACE inhibitors, 2 on AR blockers, 1 on β1-blocker) | Fish oil (1,840 mg EPA-ethyl ester, 1,520 mg ethyl-ester)+weight loss intervention (12 weeks hypocaloric diet with energy deficit of at least 1,900 kJ/day, followed by 4 weeks of weight maintenance with energy intake increased by 460 kJ/day) | Weight loss alone (protocol as in intervention group) | Adiponectin |
| C: 33±1.0 |
Values are presented as mean±standard deviation.
BMI, body mass index; I, intervention group; C, control group; T2DM, type 2 diabetic mellitus; EPA, eicosapentaenoic acid; DHA, docosahexaenoic acid; TNF-α, tumor necrosis factor α; IL-6, interleuk in 6; PAI-1, plasminogen-activator inhibitor 1; ACE, angiotensin-converting-enzyme; AR, angiotensin II receptor; HDL, high density lipoprotein.
aEPA and DHA were used in two separate treatment arms, bThe patients consumed 1,015.4±231.1 kcal/day, cValues are presented as median (interquartile range).
Figure & Data
References
Citations
- The Effects of Omega-3 Fatty Acid Supplementation
on the Lipid Profile and Cardiovascular Markers
Following Downhill Running in Long-Distance Runners
Marzena Jaworska, Szymon Siatkowski, Aleksandra Żebrowska
Journal of Human Kinetics.2023; 89: 123. CrossRef - Omega-3 supplementation in the treatment of polycystic ovary syndrome (PCOS) – a review of clinical trials and cohort
Vitoria Melo, Thomas Silva, Thaissa Silva, Juliana Freitas, Joselita Sacramento, Mirian Vazquez, Edilene Araujo
Endocrine Regulations.2022; 56(1): 66. CrossRef - The effects of omega-3 fatty acids in type 2 diabetes: A systematic review and meta-analysis
Yanan Xiao, Qifang Zhang, Xueling Liao, Ulf Elbelt, Karsten H. Weylandt
Prostaglandins, Leukotrienes and Essential Fatty Acids.2022; 182: 102456. CrossRef - Anti-inflammatory and antioxidant activity of astragalus polysaccharide in ulcerative colitis: A systematic review and meta-analysis of animal studies
Heng-Chang Hu, Wei Zhang, Pei-Yu Xiong, Li Song, Bo Jia, Xing-Long Liu
Frontiers in Pharmacology.2022;[Epub] CrossRef - Eicosopenthaenoic acid: Gnawing at the perivascular adipose tissue
Paolo Raggi, Arthur E. Stillman
Atherosclerosis.2021; 316: 69. CrossRef - The Effect of Omega-3 Fatty Acid Supplementation on Serum Adipocytokines, Lipid Profile and Biochemical Markers of Inflammation in Recreational Runners
Aleksandra Żebrowska, Barbara Hall, Anna Stolecka-Warzecha, Arkadiusz Stanula, Ewa Sadowska-Krępa
Nutrients.2021; 13(2): 456. CrossRef - The Influence of Nutrition on Adiponectin—A Narrative Review
Justyna Janiszewska, Joanna Ostrowska, Dorota Szostak-Węgierek
Nutrients.2021; 13(5): 1394. CrossRef - Adiponectin’s roles in lipid and glucose metabolism modulation in fish: Mechanisms and perspectives
Renlei Ji, Xiang Xu, Giovanni M. Turchini, Kangsen Mai, Qinghui Ai
Reviews in Aquaculture.2021; 13(4): 2305. CrossRef - Omega-3 Fatty Acids and Vulnerability to Addiction: Reviewing Preclinical and Clinical Evidence
Valerie L. Darcey, Katherine M. Serafine
Current Pharmaceutical Design.2020; 26(20): 2385. CrossRef - Therapeutic effects of different doses of prebiotic (isolated from Saccharomyces cerevisiae) in comparison to n-3 supplement on glycemic control, lipid profiles and immunological response in diabetic rats
Janina de Sales Guilarducci, Breno Augusto Ribeiro Marcelino, Isaac Filipe Moreira Konig, Tamira Maria Orlando, Mary Suzan Varaschin, Luciano José Pereira
Diabetology & Metabolic Syndrome.2020;[Epub] CrossRef - Endothelial dysfunction in neuroprogressive disorders—causes and suggested treatments
Gerwyn Morris, Basant K. Puri, Lisa Olive, Andre Carvalho, Michael Berk, Ken Walder, Lise Tuset Gustad, Michael Maes
BMC Medicine.2020;[Epub] CrossRef - Evaluation of walking exercise on glycemic control in patients with type 2 diabetes mellitus
Hengchang Hu, Yuanhong Lei, Liping Yin, Xiaoqiong Luo
Medicine.2020; 99(47): e22735. CrossRef - Omega-3 polyunsaturated fatty acids in supporting pregnancy and fetal development: dosing considerations
Olga A. Gromova, Ivan Iu. Torshin, Tatiana R. Grishina, Svetlana I. Maliavskaia
Gynecology.2020; 22(5): 61. CrossRef - A Significant Association Between Rhein and Diabetic Nephropathy in Animals: A Systematic Review and Meta-Analysis
Heng-Chang Hu, Liu-Tao Zheng, Hai-Yan Yin, Yuan Tao, Xiao-Qiong Luo, Kai-Shan Wei, Li-Ping Yin
Frontiers in Pharmacology.2019;[Epub] CrossRef - Dietary n-3 polyunsaturated fatty acids, fish intake and healthy ageing
Esther García-Esquinas, Rosario Ortolá, Jose Ramón Banegas, Esther Lopez-García, Fernando Rodríguez-Artalejo
International Journal of Epidemiology.2019; 48(6): 1914. CrossRef - Beneficial Effects of Adiponectin on Glucose and Lipid Metabolism and Atherosclerotic Progression: Mechanisms and Perspectives
Hidekatsu Yanai, Hiroshi Yoshida
International Journal of Molecular Sciences.2019; 20(5): 1190. CrossRef - Examining the Potential of Developing and Implementing Use of Adiponectin-Targeted Therapeutics for Metabolic and Cardiovascular Diseases
Ying Liu, Vivian Vu, Gary Sweeney
Frontiers in Endocrinology.2019;[Epub] CrossRef
 PubReader
 Cite
Cite- Figure
-


- Related articles
-
- Comparative Effect of Glucose-Lowering Drugs for Type 2 Diabetes Mellitus on Stroke Prevention: A Systematic Review and Network Meta-Analysis
- Effectiveness of Resistance Exercise on Inflammatory Biomarkers in Patients with Type 2 Diabetes Mellitus: A Systematic Review with Meta-Analysis
- Impact of COVID-19 Lockdown on the Metabolic Control Parameters in Patients with Diabetes Mellitus: A Systematic Review and Meta-Analysis
- Efficacy and Safety of Self-Titration Algorithms of Insulin Glargine 300 units/mL in Individuals with Uncontrolled Type 2 Diabetes Mellitus (The Korean TITRATION Study): A Randomized Controlled Trial


