- Current
- Browse
- Collections
-
For contributors
- For Authors
- Instructions to authors
- Article processing charge
- e-submission
- For Reviewers
- Instructions for reviewers
- How to become a reviewer
- Best reviewers
- For Readers
- Readership
- Subscription
- Permission guidelines
- About
- Editorial policy
Articles
- Page Path
- HOME > Diabetes Metab J > Volume 42(4); 2018 > Article
-
Original ArticleEpidemiology Insulin Resistance and the Risk of Diabetes and Dysglycemia in Korean General Adult Population
-
Jong Ha Baek1, Hosu Kim1, Kyong Young Kim1, Jaehoon Jung1,2

-
Diabetes & Metabolism Journal 2018;42(4):296-307.
DOI: https://doi.org/10.4093/dmj.2017.0106
Published online: April 24, 2018
1Department of Internal Medicine, Gyeongsang National University Changwon Hospital, Gyeongsang National University School of Medicine, Changwon, Korea.
2Institute of Health Science, Gyeongsang National University School of Medicine, Jinju, Korea.
- Corresponding author: Jaehoon Jung. Department of Internal Medicine, Gyeongsang National University Changwon Hospital, Gyeongsang National University School of Medicine, 11 Samjeongja-ro, Seongsan-gu, Changwon 51472, Korea. taesikjung@gmail.com
Copyright © 2018 Korean Diabetes Association
This is an Open Access article distributed under the terms of the Creative Commons Attribution Non-Commercial License (http://creativecommons.org/licenses/by-nc/4.0/) which permits unrestricted non-commercial use, distribution, and reproduction in any medium, provided the original work is properly cited.
ABSTRACT
-
Background
- Insulin resistance is a major pathogenic hallmark of impaired glucose metabolism. We assessed the accuracy of insulin resistance and cut-off values using homeostasis model assessment of insulin resistance (HOMA-IR) to classify type 2 diabetes mellitus (T2DM) and dysglycemia according to age and sex.
-
Methods
- In this cross-sectional study, we analyzed 4,291 anti-diabetic drug-naïve adults (≥20 years) from the 6th Korea National Health and Nutrition Examination Survey in 2015. Metabolic syndrome (MetS) was defined by the modified National Cholesterol Education Program III guideline. Diagnosis of dysglycemia and T2DM were based on fasting glucose and glycosylated hemoglobin levels. The receiver operating characteristic curve and optimal cut-off values of HOMA-IR were assessed to identify T2DM/dysglycemia according to sex and were further analyzed by age.
-
Results
- Sex differences were found in the association of MetS and the different MetS components with T2DM/dysglycemia. The overall optimal cut-off value of HOMA-IR for identifying dysglycemia was 1.6 in both sex. The cut-off values for T2DM were 2.87 in men and 2.36 in women. However, there are differences in diagnostic range of HOMA-IR to distinguish T2DM according to sex and age, and the accuracy of HOMA-IR in identifying T2DM gradually decreased with age especially in women.
-
Conclusion
- Insulin resistance is closely associated with the risk for T2DM/dysglycemia. The accuracy of HOMA-IR levels is characterized by sex- and age-specific differences in identifying T2DM. In addition to insulin resistance index, insulin secretory function, and different MetS components should be considered in the detection of early T2DM, especially in elderly.
- A progressive decline in insulin sensitivity plays a crucial role in the pathogenesis of metabolic syndrome (MetS). Impaired β-cell compensation in response to increased insulin resistance is a pathophysiological factor associated with poor glucose tolerance. In addition, prediabetic state, including impaired fasting glucose and/or impaired glucose tolerance (IGT) is a pathological feature of insulin resistance in insulin-sensitive organs [1].
- According to data from the National Health Insurance Service, about 2.7 million Korean (8.0%) aged 30 years or older had type 2 diabetes mellitus (T2DM) [2] and the prevalence of diabetes or cardiometabolic disease rises with age and shows sex differences [3]. In addition, ethnic differences exist in the stabilization points of insulin resistance and insulin secretory function for maintenance of normal glucose tolerance (NGT) [4]. Asian population is highly vulnerable to increased insulin resistance due to decreased β-cell function in NGT conditions [5]. Homeostasis model assessment of insulin resistance (HOMA-IR) has been used widely in epidemiologic studies to measure insulin sensitivity based on fasting plasma glucose (FPG) and insulin concentrations [6]. HOMA-IR also correlates reasonably well with insulin resistance measured by hyperinsulinemic-euglycemic clamp, which is regarded as the gold standard but is not readily applicable because of complex process [7]. Meanwhile, in addition to sex- and age-specific differences in HOMA-IR range [8], the HOMA-IR value increases significantly from 50 years of age in women without diabetes [910].
- According to data from the 2013 to 2014 Korea National Health and Nutrition Examination Survey (KNHANES), 29.3% of Korean patients still did not aware of their diabetic condition. The index of insulin resistance represents a screening tool for the identification of subjects who were at increased risk for diabetes or dysglycemia. A previous study showed that increase in HOMA-IR was positively associated with higher risk of T2DM in Japanese population with impaired insulin secretion [11]. In a prospective cohort studies, HOMA-IR cut-off values of 1.4 and 2.0 were used to distinguish dysglycemia and T2DM from NGT in Chinese population [12]. Meanwhile, the HOMA-IR cut-off values of 1.85 for women and 2.17 for men were used to distinguish T2DM among Iranian adults [13]. Previous Asian studies also demonstrated that distribution and cut-off values of HOMA-IR for insulin resistance were 2.2 to 2.5 in Korean population [14] and 2.5 in Japanese population [9]. However, age- and sex-specific metabolic risk factors were not considered in previous studies. Insulin secretory function also should be considered in the classification of T2DM or dysglycemia in the general population. We therefore, conducted this study to evaluate the distribution and optimal HOMA-IR cut-off values according to sex and age to facilitate the detection of insulin resistance associated with early T2DM or dysglycemia in Korean adult population.
INTRODUCTION
- Study design and population
- This study was performed using data from the 6th KNHANES conducted in 2015 involving 7,380 individuals aged 1 and above. KNHANES is a population-based cross-sectional survey designed to assess the health-related behavior, health condition, and nutritional state of Koreans [15]. Each survey was conducted by specially trained interviewers and the data was collected by direct and standardized physical examinations in specially equipped mobile examination centers. A representative sample of non-institutionalized civilians was obtained from all geographic regions in the country; subjects were selected using a rolling cluster sampling design, stratified into multiple stages, and prorated by age. Participants provided written informed consent to participate at the time of enrollment, and we received the data in anonymized form. The KNHANES VI study was conducted according to the principles expressed in the Declaration of Helsinki and Ethnics approval was obtained from the Korea Centers for Disease Control and Prevention Institutional Review Board Ethnic committee with informed consents (No. 2015-01-02-6C) [16].
- We restricted the analyses to adults aged 20 years and above (n=5,855). Subjects with missing data for variables associated with MetS components (waist circumference [WC], blood pressure [BP], lipid profiles, and fasting glucose levels) or fasting insulin and glycosylated hemoglobin (HbA1c) levels were excluded (n=1,081). In addition, those who responded with ‘yes’ to the questionnaire of “Have you ever been diagnosed with diabetes by a doctor and taken anti-diabetic drugs before?” were excluded to rule out the effect of anti-diabetic drugs on insulin sensitivity (n=502). The anti-diabetic drug-naïve adult population was divided into three categories (NGT, prediabetes, and T2DM) according to the American Diabetes Association diagnostic criteria for diabetes [17]. Only FPG and HbA1c levels were used for diagnostic cut-off values because 75-g oral glucose tolerance test was not performed in this survey. Those with FPG less than 100 mg/dL and HbA1c less than 5.7% were defined to have NGT, and those with FPG of 126 mg/dL or more, or HbA1c of 6.5% or greater were diagnosed with T2DM. Meanwhile, those with FPG levels ranging between 100 and 125 mg/dL or HbA1c levels between 5.7% and 6.4% were identified as prediabetes. In our study, dysglycemia referred to pre-diabetes and T2DM, and non-T2DM referred to NGT and pre-diabetes. Plasma glucose and insulin levels under fasting condition were measured to evaluate insulin sensitivity using HOMA-IR and insulin secretory function using homeostasis model assessment of β-cell function (HOMA-β) model [6]. HOMA-IR levels were divided into tertiles according to glycemic state (NGT subgroup, dysglycemia subgroup) to assess the severity of insulin resistance in which the higher tertiles suggested greater insulin resistance.
- General characteristics and anthropometric factors
- We included sociodemographic characteristics including age, sex, education (high school or less, college or higher), smoking status (current smoker or not), exercise, and alcohol intake. We defined regular aerobic exercise if it involved moderate intensity for 2.5 hours or more or intense exercise for 1.25 hours or more per week. Heavy alcohol intake was defined by the amount and frequency of alcohol for a month. Binge drinking was defined as five or more alcoholic drinks in males or four or more alcoholic drinks in females at least once daily in the past month. WC was measured to the nearest 0.1 cm on a horizontal plane at the mid-point between the lower costal margin and the iliac crest. Weight (kg) was divided by height squared (m2) to calculate the body mass index. BP was measured three times at 5-minute intervals using a standard mercury sphygmomanometer with the subject seated. The mean of the second and third measurements was calculated and used in the analysis. Blood samples were collected after the subject had fasted for more than 8 hours. The fasting serum levels of glucose, triglyceride (TG), and high density lipoprotein cholesterol (HDL-C) were measured enzymatically using a Hitachi Automatic Analyzer 7600 (Hitachi, Tokyo, Japan).
- Definition of MetS
- MetS was defined according to the modified criteria proposed by the Adult Treatment Program III of the National Cholesterol Education Program (NCEP ATP III) [18]. Each MetS component was evaluated using the following criteria: (1) WC ≥90 cm in men or ≥85 cm in women (for Korean population) [19]; (2) TG ≥150 mg/dL or statin treatment; (3) HDL-C cholesterol <40 mg/dL in men or <50 mg/dL in women or statin treatment; and (4) elevated BP (systolic blood pressure [SBP] ≥130 mm Hg and/or diastolic blood pressure ≥85 mm Hg) or treatment with anti-hypertensive medications. Meanwhile, hyperglycemia was not considered because subjects with a history of anti-diabetic drug regimen were excluded from the study design.
- Statistical analysis
- Normally distributed data were presented as mean±standard deviation, and non-normally distributed date were presented as median (interquartile range [IQR]). Student t-test or one-way analysis of covariance was used for continuous variables and chi-square tests were used for categorical variables to assess the baseline characteristics. The Mann-Whitney U test, Kruskall-Wallis test, and the Jonckheere-Terpstra test (for trend analyses) were used for comparison of quantitative variables. Multivariate logistic regression analyses was conducted to identify the risk of T2DM/dysglycemia associated with the MetS components after adjusting for age and lifestyle components (regular aerobic exercise, education state, smoking status, heavy drinker) and HOMA-IR cut-off value.
- To determine the optimal HOMA-IR cut-offs to distinguish dysglycemia from NGT, and T2DM from non-DM according to age group, the point with the maximum Youden index (sensitivity+specificity−1; YI) on the receiver-operating characteristic operation (ROC) curve was obtained, and we selected the maximum value as the cut-off values. The effect of age groups on total area under the ROC curve (AUROC) differences was analyzed using the independent ROC comparison analysis according to sex. In addition, to assess for linearity of AUROCs by age groups, we conducted the restricted maximum likelihood estimation using area under the curve (AUC) values and standard errors. The total AUROC with 95% confidence interval (CI), sensitivity, and specificity of HOMA-IR values were calculated to distinguish dysglycemia from T2DM, respectively. The statistical analyses was performed using SPSS version 21.0 (IBM Co., Armonk, NY, USA), Stata version 14.1 (StatCorp., College Station, TX, USA), and MedCalc version 17.5.5 (MedCalc Software bvba, Ostend, Belgium). All statistical tests were two-tailed, and the significance level was set at P<0.05.
METHODS
- General characteristics
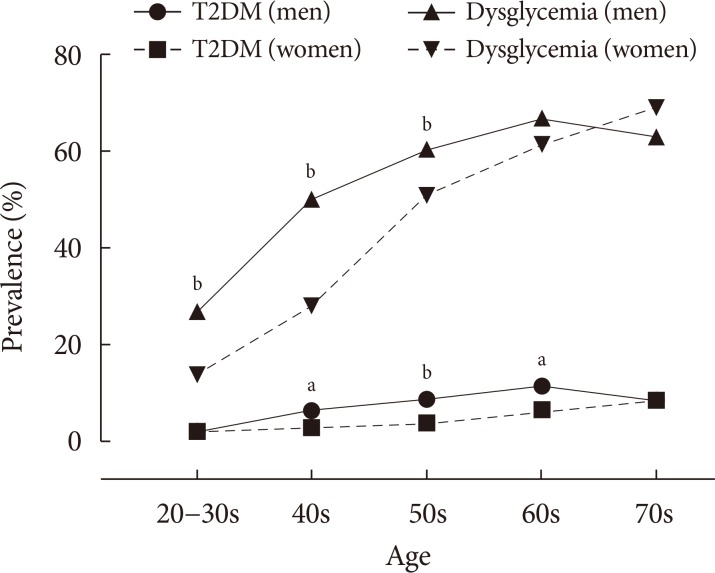
- The baseline characteristics of study population are shown in Table 1 and subjects were subdivided into NGT, pre-diabetes, and T2DM according to sex (Supplementary Table 1). In the total study population of 4,291 adults mean age was comparable between sex (mean, 50.5 years). Among MetS components, central obesity (31.7% vs. 28.0%), hyperTG (37.2% vs. 21.1%), and higher BP (46.9% vs. 34.6%) were dominant factors in men whereas low HDL-C (26.0% vs. 40.0%) were dominant in women (all P<0.01). Current smoking and binge drinking were more dominant in men whereas less regular exercise and lower educational status were observed in women (all P<0.001). The overall prevalence of T2DM was 6.5% (n=120) in men and 3.9% (n=95) in women (P<0.001). The overall prevalence of dysglycemia was 50.7% (n=938) in men and 40.3% (n=984) in women (P<0.001). Meanwhile, sex differences in prevalence were seen across different age groups. The prevalence of T2DM was higher in men than in women under 60 years although it was not significant in older ages as the prevalence in women increased gradually with age. The prevalence of dysglycemia was higher in men aged 40 to 60 years compared with women (Fig. 1). The overall median HOMA-IR levels were 1.56 in men and 1.44 in women (P=0.003). However, the median HOMA-IR values according to glucose tolerance state (NGT, prediabetes, and T2DM) and age were not significantly different between males and females (data not shown). T2DM was prevalent in older population with having more MetS components, and higher insulin resistance and lower insulin secretory function compared to those with NGT or pre-diabetes, as expected in both men and women (Supplementary Table 1).
- The risk of T2DM/dysglycemia associated with MetS components according to sex
- To evaluate the effects of MetS components on the risk of T2DM/dysglycemia according to sex, multivariate logistic regression analyses was performed adjusting for HOMA-IR cut-off values (YI) and lifestyle factors (regular aerobic exercise, education state, smoking state, and heavy drinking). In men, the presence of hyperTG was associated with increased risk for T2DM (odds ratio [OR], 2.14; 95% CI, 1.31 to 3.50) and dysglycemia (OR, 1.61; 95% CI, 1.24 to 2.08) after adjusting for confounding factors. Meanwhile, the presence of hypo-HDL cholesterol (OR, 2.40; 95% CI, 1.13 to 5.07) was associated with the risk for T2DM in women (Table 2).
- AUROC distribution and cut-off values of HOMA-IR by age, sex, and dysglycemic state
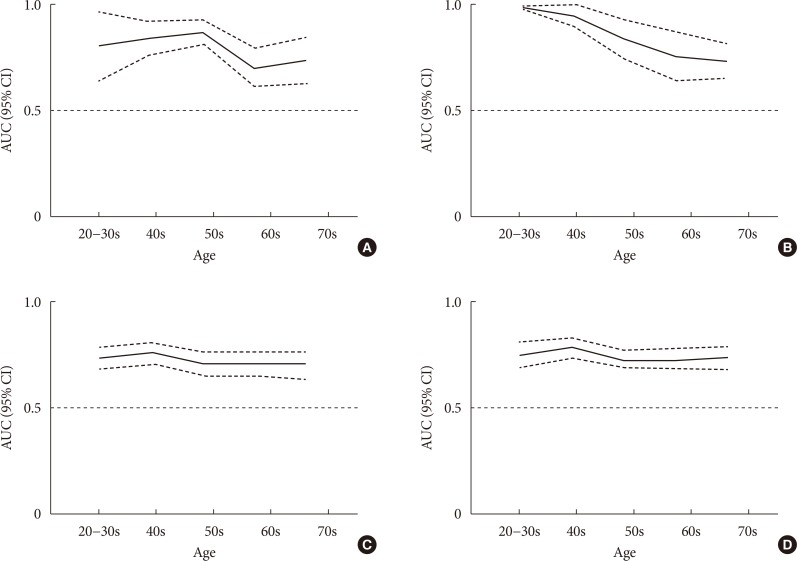
- The AUROC curve of HOMA-IR values was used to distinguish dysglycemia from NGT, and T2DM from non-DM as shown in Table 3. The overall AUROC for T2DM was 0.774 (95% CI, 0.730 to 0.818) for men and 0.837 (95% CI, 0.794 to 0.879) for women, and those for dysglycemia were 0.685 (95% CI, 0.671 to 0.719) for men and 0.728 (95% CI, 0.708 to 0.748) for women. The optimal cut-off values for dysglycemia were 1.56 (sensitivity 64.3%, specificity 64.5%), and 1.60 (sensitivity 63.3%, specificity 70.0%) in women, without any differences in accuracy of HOMA-IR values according to age in both sex (Fig. 2). Meanwhile, the cut-off point of 1.6 in both sex was strongly associated with each MetS component after adjusting for age and lifestyle factors (alcohol intake, education state, and exercise) (Table 4).
- The optimal cut-off values using maximum YI for T2DM were 2.87 in men (sensitivity 56.7%, specificity 85.4%), and 2.36 in women (sensitivity 72.6%, specificity 79.9%). In subgroups according to age and sex (Table 5), significant differences in AUROC for T2DM were found across different age groups in both sex, whereas the linear decline with aging was significant only in women (P<0.05). In men in their 60s, the sensitivities of HOMA-IR cut point for T2DM diagnosis were 40.5% (YI criteria, 2.87) and 43.2% (2.5 criteria), respectively. Among men in their 70s, the sensitivities of HOMA-IR cut point for T2DM were 57.1% (YI index criteria) and 46.4% (2.5 criteria), respectively. When we excluded subjects who were aged 70 years or older, the cut-off value for HOMA-IR was 2.13 (sensitivity 85.5%, specificity 69.9%) in men and 2.50 in women (sensitivity 85.7%, specificity 74.4%) (data not shown).
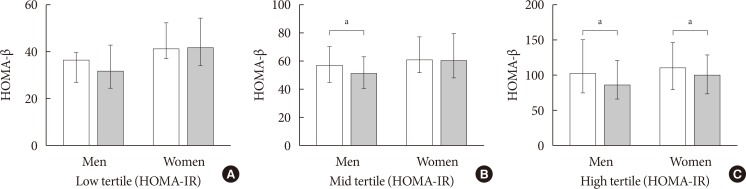
- Meanwhile, among subjects with dysglycemic state (n= 1,922), an overall defect in insulin secretory function (HOMA-β) in older subjects aged above 50s was observed only in middle (median [IQR], 60.0 [45.9 to 70.0] vs. 51.4 [41.3 to 62.7], P=0.012) to high tertiles (median [IQR], 101.2 [75.8 to 150.5] vs. 85.2 [66.6 to 121.0], P=0.003) of HOMA-IR in men, and high tertiles of HOMA-IR in women (median [IQR], 109.5 [80.4 to 146.1] vs. 99.5 [74.6 to 128.1], P=0.045) compared to those at younger ages (Fig. 3).
RESULTS
- In this large community-based Korean adult population study, differences in MetS expression were found and the different MetS components were independently associated with the risk of T2DM/dysglycemia after adjusting for lifestyle factors and insulin resistance between men and women. The optimal cut-off value of HOMA-IR using maximum YI for dysglycemia was 1.6 in both sex, and this value was independently associated with MetS components. The cut-off values of HOMA-IR for T2DM were 2.87 in men and 2.36 in women. Meanwhile, the diagnostic ranges of HOMA-IR to discriminate T2DM varied according to sex and age, and the sensitivity of HOMA-IR for T2DM diagnosis progressively decreased with age especially in women. An impaired compensatory insulin secretory function in older subjects with dysglycemic state was predominantly seen under conditions of higher insulin resistance. The findings suggest that factors such as age, sex, different MetS components, and insulin secretory function should be considered to classify people with high-risk T2DM using HOMA-IR cut-off values, especially in older Koreans.
- Sex differences in MetS expression and the association of different MetS components with the risk of T2DM/dysglycemia were found. In this study, among the MetS components, central obesity, high TG, and BP were more dominant in men than in women, whereas low HDL-C was predominant in women. In addition, low HDL in women or high TG in men was significantly associated with the risk for dysglycemia/T2DM after adjusting for the confounding factors such as HOMA-IR and lifestyle factors. A national cross-sectional survey conducted in the United States [20] demonstrated that MetS was a heterogeneous entity associated with age and sex variation in component clusters, and different combinations of MetS components were associated with mortality risk rather than the number of MetS components or the presence of MetS itself. In addition, low-HDL-C increased the risk of T2DM in epidemiologic studies [2122]. Meanwhile, lifestyle factors including alcohol consumption [23], exercise [24], and smoking [25] were also closely associated with MetS. As a result, we further considered these lifestyle confounding factors and found a significant correlation between sex differences in MetS components and the risk for T2DM/dysglycemia in this study. The finding suggested that the presence of MetS as well as different components related to sex are closely associated with the risk for T2DM or dysglycemia in general population.
- HOMA-IR cut-off point for dysglycemia was 1.6 for both sex in our study population. Insulin resistance is a major pathophysiological feature associated with the risk for MetS, T2DM, and overall mortality risk, and is useful as a prognostic indicator to facilitate early diagnosis of dysglycemia or T2DM. However, previous studies to identify the association between insulin resistance indices with the risk for cardiometabolic disease showed various results. Several cross-sectional large population studies reported various cut-off values to discriminate MetS (HOMA-IR, 1.7 to 3.8) according to the study population, sample size, and diagnostic criteria for insulin resistance [26]. HOMA-IR ≥2.5 was also suggested as the cut-off value for insulin resistance by Japan Diabetes Society [27] and the value of 1.7 was suggested as a cut-off for identifying subjects with high risk for MetS in Japanese studies [28]. As a marker of early stage pre-diabetes (FPG >100 mg/dL or HbA1c >5.7%) in our study, the cut-off value of HOMA-IR (1.6) was similar to the value used to distinguish MetS risk in a Japanese study [28]. In addition, the HOMA-IR cut-off in our study for dysglycemia was also independently associated with each MetS component (OR, 2.03 to 7.61 according to MetS factors and sex) regardless of age and lifestyle factors. It may suggest that this HOMA-IR cut-off point could be another option for early detection of dysglycemia and risk for accompanying MetS components. Of course, from the perspective of diabetes and MetS prevention, the sensitivity and the specificity of the test were around 60% to 70% and adoption of single HOMA-IR cut-off value of 1.6 was not adequate to completely replace other risk factors. As a result, the cut-off values for HOMA-IR might not be represent stringent guideline for the early detection of IGT. However, they can aid our understanding of the clinical complexity of the patients with the highest risk for developing diabetes or MetS.
- In our study, the overall accuracy of HOMA-IR values in identifying T2DM varied between men and women. A significant effect of age on the diagnostic performance of HOMA-IR was observed as the accuracy of insulin resistance index in T2DM diagnosis progressively decreased with aging especially in women. In addition, sensitivity was lower than 50% in elderly men (≥60 years) and lower than 60% in elderly women (≥70 years) based on HOMA-IR cut-off value. Meanwhile, among subgroups of dysglycemia (n=1,922) manifesting higher insulin resistance levels than the NGT group, a significantly lower level of HOMA-β was observed in older subjects (≥50 years) under higher insulin resistance (highest tertiles of HOMA-IR). Previous reports suggested age- and sex-specific differences in HOMA-IR distribution in subjects with non-diabetic state [814], and different AUC and cut-off values of HOMA-IR were observed in identifying MetS according to age and sex, especially in women [10]. Therefore, a single one-point cut-off value is not adequate for early detection of severe cardiometabolic risk. Impairment of compensatory pancreatic β-cell response to insulin resistance results in dysglycemia or overt T2DM and subjects were more vulnerable to insulin resistance with increasing age. Previous studies reported a decrease in fasting insulin with advancing age, which is associated with blunted insulin secretion or limited β-cell function [2930]. In addition, postmenopausal women tend to be more vulnerable to insulin resistance as estrogen deficiency induces central obesity with changed body composition [31]. Meanwhile, in a study of healthy Iranian population, age, WC, and SBP were biological determinants of fasting insulin in both sex and insulin secretion was further modulated by different MetS components according to sex (TG in men and FPG in women) [30]. In addition, the association between increasing HOMA-IR value over time and the development of T2DM was observed in subjects with impaired insulin secretion but not in those with normal secretory function [11]. In addition to insulin resistance, pancreatic insulin secretory function should be considered to assess the pathophysiology and risk for T2DM, especially in elderly populations.
- There are some limitations in our study. First, HOMA-IR mostly reflects hepatic insulin resistance and did not fully represent insulin resistance unlike the euglycemic clamp [32]. Second, defining dysglycemia or T2DM in our study was assessed by FPG or HbA1c levels without considering postprandial glucose levels because of the study design. Because of the relative predominance of postprandial glucose excursions in early T2DM [33], there is a possibility that some people with IGT were not included in the dysglycemic group. However, we considered HbA1c levels for diagnosis of T2DM or pre-diabetes in which HbA1c was closely associated with postprandial glucose levels rather than FPG [34]. Third, the cross-sectional study design prevented a comprehensive evaluation of the periodic changes in anthropometric and lifestyle factors to determine the causal relationship between insulin resistance and the incidence of dysglycemia or T2DM. Even though we excluded subjects who already took anti-diabetic drugs to minimize confounding effects that affect insulin resistance and secretory function, it could be crucial limitation because this study did not represents the whole Korean population and selection bias could affects the results. However, we tried to determine the cut-off values in healthy Korean population selected from this non-institutionalized population-based study and other lifestyle factors (smoking, exercise, and education) were also considered to evaluate to relationship between insulin resistance and MetS or impaired glucose metabolism. A future large prospective study should be performed to generalize this cut-off values and the risk for impaired glucose metabolism.
- In conclusion, a HOMA-IR cut-off value of 1.6 in both sex was significantly associated with the risk for dysglycemia as well as MetS components in Korean population regardless of age. The cut-off values of HOMA-IR for T2DM were 2.87 for men and 2.36 for women. However, the different diagnostic ranges of HOMA-IR were used to distinguish T2DM according to age and sensitivity progressively decreased with age especially in women. Different MetS components and insulin secretory function in old age should also be considered when adopting HOMA-IR cut-off values for T2DM assessment.
DISCUSSION
-
CONFLICTS OF INTEREST: No potential conflict of interest relevant to this article was reported.
NOTES
SUPPLEMENTARY MATERIAL
Supplementary Table 1
- 1. Abdul-Ghani MA, Tripathy D, DeFronzo RA. Contributions of beta-cell dysfunction and insulin resistance to the pathogenesis of impaired glucose tolerance and impaired fasting glucose. Diabetes Care 2006;29:1130-1139. ArticlePubMed
- 2. Noh J. The diabetes epidemic in Korea. Endocrinol Metab (Seoul) 2016;31:349-353. ArticlePubMedPMCPDF
- 3. Danaei G, Finucane MM, Lu Y, Singh GM, Cowan MJ, Paciorek CJ, Lin JK, Farzadfar F, Khang YH, Stevens GA, Rao M, Ali MK, Riley LM, Robinson CA, Ezzati M. Global Burden of Metabolic Risk Factors of Chronic Diseases Collaborating Group (Blood Glucose). National, regional, and global trends in fasting plasma glucose and diabetes prevalence since 1980: systematic analysis of health examination surveys and epidemiological studies with 370 country-years and 2·7 million participants. Lancet 2011;378:31-40. ArticlePubMed
- 4. Kodama K, Tojjar D, Yamada S, Toda K, Patel CJ, Butte AJ. Ethnic differences in the relationship between insulin sensitivity and insulin response: a systematic review and meta-analysis. Diabetes Care 2013;36:1789-1796. PubMedPMC
- 5. Ohn JH, Kwak SH, Cho YM, Lim S, Jang HC, Park KS, Cho NH. 10-Year trajectory of β-cell function and insulin sensitivity in the development of type 2 diabetes: a community-based prospective cohort study. Lancet Diabetes Endocrinol 2016;4:27-34. ArticlePubMed
- 6. Matthews DR, Hosker JP, Rudenski AS, Naylor BA, Treacher DF, Turner RC. Homeostasis model assessment: insulin resistance and beta-cell function from fasting plasma glucose and insulin concentrations in man. Diabetologia 1985;28:412-419. ArticlePubMedPDF
- 7. Bonora E, Targher G, Alberiche M, Bonadonna RC, Saggiani F, Zenere MB, Monauni T, Muggeo M. Homeostasis model assessment closely mirrors the glucose clamp technique in the assessment of insulin sensitivity: studies in subjects with various degrees of glucose tolerance and insulin sensitivity. Diabetes Care 2000;23:57-63. ArticlePubMedPDF
- 8. Gayoso-Diz P, Otero-Gonzalez A, Rodriguez-Alvarez MX, Gude F, Cadarso-Suarez C, Garcia F, De Francisco A. Insulin resistance index (HOMA-IR) levels in a general adult population: curves percentile by gender and age. The EPIRCE study Diabetes Res Clin Pract 2011;94:146-155. PubMed
- 9. Esteghamati A, Ashraf H, Esteghamati AR, Meysamie A, Khalilzadeh O, Nakhjavani M, Abbasi M. Optimal threshold of homeostasis model assessment for insulin resistance in an Iranian population: the implication of metabolic syndrome to detect insulin resistance. Diabetes Res Clin Pract 2009;84:279-287. ArticlePubMed
- 10. Gayoso-Diz P, Otero-Gonzalez A, Rodriguez-Alvarez MX, Gude F, Garcia F, De Francisco A, Quintela AG. Insulin resistance (HOMA-IR) cut-off values and the metabolic syndrome in a general adult population: effect of gender and age. EPIRCE cross-sectional study. BMC Endocr Disord 2013;13:47. ArticlePubMedPMCPDF
- 11. Morimoto A, Tatsumi Y, Soyano F, Miyamatsu N, Sonoda N, Godai K, Ohno Y, Noda M, Deura K. Increase in homeostasis model assessment of insulin resistance (HOMA-IR) had a strong impact on the development of type 2 diabetes in Japanese individuals with impaired insulin secretion: the Saku study. PLoS One 2014;9:e105827. ArticlePubMedPMC
- 12. Lee CH, Shih AZ, Woo YC, Fong CH, Leung OY, Janus E, Cheung BM, Lam KS. Optimal cut-offs of homeostasis model assessment of insulin resistance (HOMA-IR) to identify dysglycemia and type 2 diabetes mellitus: a 15-year prospective study in Chinese. PLoS One 2016;11:e0163424. ArticlePubMedPMC
- 13. Ghasemi A, Tohidi M, Derakhshan A, Hasheminia M, Azizi F, Hadaegh F. Cut-off points of homeostasis model assessment of insulin resistance, beta-cell function, and fasting serum insulin to identify future type 2 diabetes: Tehran Lipid and Glucose Study. Acta Diabetol 2015;52:905-915. ArticlePubMedPDF
- 14. Yun KJ, Han K, Kim MK, Park YM, Baek KH, Song KH, Kwon HS. Insulin resistance distribution and cut-off value in Koreans from the 2008-2010 Korean National Health and Nutrition Examination Survey. PLoS One 2016;11:e0154593. ArticlePubMedPMC
- 15. Korea Centers for Disease Control and Prevention. The Sixth Korea National Health and Nutrition Examination Survey (KNHANES VI) 2018 Mar 23. Available from: https://knhanes.cdc.go.kr/knhanes/intro.html.
- 16. Kweon S, Kim Y, Jang MJ, Kim Y, Kim K, Choi S, Chun C, Khang YH, Oh K. Data resource profile: the Korea National Health and Nutrition Examination Survey (KNHANES). Int J Epidemiol 2014;43:69-77. ArticlePubMedPMC
- 17. American Diabetes Association. 2. Classification and diagnosis of diabetes. Diaetes Care 2016;39(Suppl 1):S13-S22.ArticlePDF
- 18. Alberti KG, Eckel RH, Grundy SM, Zimmet PZ, Cleeman JI, Donato KA, Fruchart JC, James WP, Loria CM, Smith SC Jr. International Diabetes Federation Task Force on Epidemiology and Prevention. Hational Heart, Lung, and Blood Institute. American Heart Association; World Heart Federation. Inter national Atherosclerosis Society. International Association for the Study of Obesity. Harmonizing the metabolic syndrome: a joint interim statement of the International Diabetes Federation Task Force on Epidemiology and Prevention; National Heart, Lung, and Blood Institute; American Heart Association; World Heart Federation; International Atherosclerosis Society; and International Association for the Study of Obesity. Circulation 2009;120:1640-1645. ArticlePubMed
- 19. Lee SY, Park HS, Kim DJ, Han JH, Kim SM, Cho GJ, Kim DY, Kwon HS, Kim SR, Lee CB, Oh SJ, Park CY, Yoo HJ. Appropriate waist circumference cutoff points for central obesity in Korean adults. Diabetes Res Clin Pract 2007;75:72-80. ArticlePubMed
- 20. Kuk JL, Ardern CI. Age and sex differences in the clustering of metabolic syndrome factors: association with mortality risk. Diabetes Care 2010;33:2457-2461. PubMedPMC
- 21. Schmidt MI, Duncan BB, Bang H, Pankow JS, Ballantyne CM, Golden SH, Folsom AR, Chambless LE. Atherosclerosis Risk in Communities Investigators. Identifying individuals at high risk for diabetes: the Atherosclerosis Risk in Communities study. Diabetes Care 2005;28:2013-2018. PubMed
- 22. Wilson PW, Meigs JB, Sullivan L, Fox CS, Nathan DM, D'Agostino RB Sr. Prediction of incident diabetes mellitus in middle-aged adults: the Framingham Offspring Study. Arch Intern Med 2007;167:1068-1074. ArticlePubMed
- 23. Freiberg MS, Cabral HJ, Heeren TC, Vasan RS, Curtis Ellison R. Third National Health and Nutrition Examination Survey. Alcohol consumption and the prevalence of the metabolic syndrome in the US: a cross-sectional analysis of data from the Third National Health and Nutrition Examination Survey. Diabetes Care 2004;27:2954-2959. PubMed
- 24. Golbidi S, Mesdaghinia A, Laher I. Exercise in the metabolic syndrome. Oxid Med Cell Longev 2012;2012:349710. ArticlePubMedPMCPDF
- 25. Oh SW, Yoon YS, Lee ES, Kim WK, Park C, Lee S, Jeong EK, Yoo T. Korea National Health and Nutrition Examination Survey. Association between cigarette smoking and metabolic syndrome: the Korea National Health and Nutrition Examination Survey. Diabetes Care 2005;28:2064-2066. PubMed
- 26. Tang Q, Li X, Song P, Xu L. Optimal cut-off values for the homeostasis model assessment of insulin resistance (HOMA-IR) and pre-diabetes screening: developments in research and prospects for the future. Drug Discov Ther 2015;9:380-385. ArticlePubMed
- 27. Yamada C, Mitsuhashi T, Hiratsuka N, Inabe F, Araida N, Takahashi E. Optimal reference interval for homeostasis model assessment of insulin resistance in a Japanese population. J Diabetes Investig 2011;2:373-376.ArticlePubMedPMC
- 28. Yamada C, Moriyama K, Takahashi E. Optimal cut-off point for homeostasis model assessment of insulin resistance to discriminate metabolic syndrome in non-diabetic Japanese subjects. J Diabetes Investig 2012;3:384-387.ArticlePubMedPMC
- 29. Bryhni B, Arnesen E, Jenssen TG. Associations of age with serum insulin, proinsulin and the proinsulin-to-insulin ratio: a cross-sectional study. BMC Endocr Disord 2010;10:21. ArticlePubMedPMCPDF
- 30. Tohidi M, Ghasemi A, Hadaegh F, Derakhshan A, Chary A, Azizi F. Age- and sex-specific reference values for fasting serum insulin levels and insulin resistance/sensitivity indices in healthy Iranian adults: Tehran Lipid and Glucose Study. Clin Biochem 2014;47:432-438. ArticlePubMed
- 31. Gupte AA, Pownall HJ, Hamilton DJ. Estrogen: an emerging regulator of insulin action and mitochondrial function. J Diabetes Res 2015;2015:916585. ArticlePubMedPMCPDF
- 32. Borai A, Livingstone C, Kaddam I, Ferns G. Selection of the appropriate method for the assessment of insulin resistance. BMC Med Res Methodol 2011;11:158. ArticlePubMedPMCPDF
- 33. Monnier L, Lapinski H, Colette C. Contributions of fasting and postprandial plasma glucose increments to the overall diurnal hyperglycemia of type 2 diabetic patients: variations with increasing levels of HbA(1c). Diabetes Care 2003;26:881-885. PubMed
- 34. Ketema EB, Kibret KT. Correlation of fasting and postprandial plasma glucose with HbA1c in assessing glycemic control: systematic review and meta-analysis. Arch Public Health 2015;73:43. ArticlePubMedPMCPDF
REFERENCES
Prevalence of type 2 diabetes mellitus (T2DM) and dysglycemia in different age groups and sex. aP<0.05, bP<0.01.

Area under the curve (AUC) (95% confidence interval [CI]) for (A) type 2 diabetes mellitus (T2DM) in men, (B) T2DM in women, (C) dysglycemia in men, and (D) dysglycemia in women in different age groups.
Comparison of homeostasis model assessment of β-cell function (HOMA-β) according to sex and age group (distinguished by 50 years) in (A) low tertile of homeostasis model assessment of insulin resistance (HOMA-IR), (B) mid tertile of HOMA-IR, and (C) high tertile of HOMA-IR among those with dysglycemia. White bar, 50 years old or less; gray bar, more than 50 years old. aP<0.05.

Baseline clinical and demographic characteristics
Values are presented as mean±standard deviation, number (%), or median (interquartile range).
BMI, body mass index; SBP, systolic blood pressure; DBP, diastolic blood pressure; FPG, fasting plasma glucose; HbA1c, glycosylated hemoglobin; T2DM, type 2 diabetes mellitus; TG, triglyceride; HDL-C, high density lipoprotein cholesterol; HS, high school; HOMA-IR, homeostasis model assessment of insulin resistance; HOMA-β, homeostasis model assessment of β-cell function.
Multivariate OR (95% CI) of T2DM/dysglycemia according to metabolic syndrome components
OR, odds ratio; CI, confidence interval; T2DM, type 2 diabetes mellitus; WC, waist circumference; TG, triglyceride; HDL, high density lipoprotein; BP, blood pressure.
aAll values were adjusted for age, homeostasis model assessment of insulin resistance, metabolic syndrome components and lifestyle factors (regular aerobic exercise, education, smoking status, and heavy drinking).
Assessment of dysglycemia and T2DM based on AUC and optimal cut-off points for HOMA-IR
Association between metabolic syndrome components and the cut-off point of HOMA-IR (1.6) for dysglycemia
Sex distribution of HOMA-IR cut-off levels based on sensitivity and specificity for T2DM in different age groups
Values are presented as number (%).
HOMA-IR, homeostasis model assessment of insulin resistance; T2DM, type 2 diabetes mellitus; AUC, area under the curve; CI, confidence interval; ROC, receiver-operating characteristic operation.
aP value for difference of AUC values between age group, bP value for linear trend of AUC values by age group, cP<0.05.
Figure & Data
References
Citations
- Evaluation of insulin secretion and insulin sensitivity in pregnant women: Application value of simple indices
Shuying Ren, Dan Wu, Ping Li
Clinica Chimica Acta.2024; 554: 117753. CrossRef - Association between birth weight and insulin resistance in US adolescents: A retrospective cohort study exploring the role of concurrent body mass index
Yubo Zhuo, Jieli He, Liangbing Wang, Chun Bong Chow, Frederick K. Ho
Nutrition, Metabolism and Cardiovascular Diseases.2024; 34(4): 1061. CrossRef - Are HOMA-IR and HOMA-B good predictors for diabetes and pre-diabetes subtypes?
Davood Khalili, Marjan Khayamzadeh, Karim Kohansal, Noushin Sadat Ahanchi, Mitra Hasheminia, Farzad Hadaegh, Maryam Tohidi, Fereidoun Azizi, Ali Siamak Habibi-Moeini
BMC Endocrine Disorders.2023;[Epub] CrossRef - Non-Alcoholic Fatty Liver Disease with Sarcopenia and Carotid Plaque Progression Risk in Patients with Type 2 Diabetes Mellitus
Yongin Cho, Hye-Sun Park, Byung Wook Huh, Yong-ho Lee, Seong Ha Seo, Da Hea Seo, Seong Hee Ahn, Seongbin Hong, So Hun Kim
Diabetes & Metabolism Journal.2023; 47(2): 232. CrossRef - Triglyceride-Glucose Index Cutoff Point Is an Accurate Marker for Predicting the Prevalence of Metabolic Syndrome in Obese Caucasian Subjects
David Primo, Olatz Izaola, Daniel A. de Luis
Annals of Nutrition and Metabolism.2023; 79(2): 238. CrossRef - Triglyceride glucose index as a predictor of mortality in middle-aged and elderly patients with type 2 diabetes in the US
Mengjie Zhao, Mengli Xiao, Qin Tan, Fang Lu
Scientific Reports.2023;[Epub] CrossRef - Assessment HOMA as a predictor for new onset diabetes mellitus and diabetic complications in non-diabetic adults: a KoGES prospective cohort study
Jibeom Lee, Moon-hyun Kim, Ji-Yong Jang, Chang-Myung Oh
Clinical Diabetes and Endocrinology.2023;[Epub] CrossRef - Association between experience of insulin resistance and long-term cardiovascular disease risk: findings from the Korean Genome and Epidemiology Study (KOGES)
Jong Hee Lee, Hye Sun Lee, Soyoung Jeon, Yong-Jae Lee, Byoungjin Park, Jun-Hyuk Lee, Yu-Jin Kwon
Endocrine.2023;[Epub] CrossRef - Efficacy and safety of evogliptin in patients with type 2 diabetes and non‐alcoholic fatty liver disease: A multicentre, double‐blind, randomized, comparative trial
Eugene Han, Ji Hye Huh, Eun Y. Lee, Ji C. Bae, Sung W. Chun, Sung H. Yu, Soo H. Kwak, Kyong S. Park, Byung‐Wan Lee
Diabetes, Obesity and Metabolism.2022; 24(4): 752. CrossRef - Development and Validation of an Insulin Resistance Predicting Model Using a Machine-Learning Approach in a Population-Based Cohort in Korea
Sunmin Park, Chaeyeon Kim, Xuangao Wu
Diagnostics.2022; 12(1): 212. CrossRef - HOMA-IR as a predictor of Health Outcomes in Patients with Metabolic Risk Factors: A Systematic Review and Meta-analysis
José G. González-González, Jorge R. Violante-Cumpa, Miguel Zambrano-Lucio, Erick Burciaga-Jimenez, Patricia L. Castillo-Morales, Mariano Garcia-Campa, Ricardo César Solis, Alejandro D González-Colmenero, René Rodríguez-Gutiérrez
High Blood Pressure & Cardiovascular Prevention.2022; 29(6): 547. CrossRef - A Comprehensive Analysis of Chinese, Japanese, Korean, US-PIMA Indian, and Trinidadian Screening Scores for Diabetes Risk Assessment and Prediction
Norma Latif Fitriyani, Muhammad Syafrudin, Siti Maghfirotul Ulyah, Ganjar Alfian, Syifa Latif Qolbiyani, Muhammad Anshari
Mathematics.2022; 10(21): 4027. CrossRef - Osteocalcin is associated with triglyceride glucose index rather than HOMA-IR in men with type 2 diabetes
Huijie Huang, Ai Wang, Li Cong, Yingjuan Zeng
Frontiers in Endocrinology.2022;[Epub] CrossRef - The insulin resistance by triglyceride glucose index and risk for dementia: population-based study
Sangmo Hong, Kyungdo Han, Cheol-Young Park
Alzheimer's Research & Therapy.2021;[Epub] CrossRef - Association between insulin resistance and lung function trajectory over 4 years in South Korea: community-based prospective cohort
Sang Hyuk Kim, Hyun Sam Kim, Hyang Ki Min, Sung Woo Lee
BMC Pulmonary Medicine.2021;[Epub] CrossRef - The triglyceride–glucose index is a more powerful surrogate marker for predicting the prevalence and incidence of type 2 diabetes mellitus than the homeostatic model assessment of insulin resistance
Hye Min Park, Hye Sun Lee, Yong-Jae Lee, Jun-Hyuk Lee
Diabetes Research and Clinical Practice.2021; 180: 109042. CrossRef - The effect of 1% glucose loading on metabolism in the elderly patients during remifentanil-induced anesthesia: a randomized controlled trial
Kohei Fukuta, Asuka Kasai, Noriko Niki, Yuki Ishikawa, Ryosuke Kawanishi, Nami Kakuta, Yoko Sakai, Yasuo M. Tsutsumi, Katsuya Tanaka
BMC Anesthesiology.2020;[Epub] CrossRef - Suppression of HDAC by sodium acetate rectifies cardiac metabolic disturbance in streptozotocin–nicotinamide-induced diabetic rats
Kehinde S Olaniyi, Oluwatobi A Amusa, Emmanuel D Areola, Lawrence A Olatunji
Experimental Biology and Medicine.2020; 245(7): 667. CrossRef - Non-alcoholic steatohepatitis and progression of carotid atherosclerosis in patients with type 2 diabetes: a Korean cohort study
Hyeok-Hee Lee, Yongin Cho, Young Ju Choi, Byung Wook Huh, Byung-Wan Lee, Eun Seok Kang, Seok Won Park, Bong-Soo Cha, Eun Jig Lee, Yong-ho Lee, Kap Bum Huh
Cardiovascular Diabetology.2020;[Epub] CrossRef - Triglyceride Glucose-Waist Circumference Better Predicts Coronary Calcium Progression Compared with Other Indices of Insulin Resistance: A Longitudinal Observational Study
Yun Kyung Cho, Jiwoo Lee, Hwi Seung Kim, Eun Hee Kim, Min Jung Lee, Dong Hyun Yang, Joon-Won Kang, Chang Hee Jung, Joong-Yeol Park, Hong-Kyu Kim, Woo Je Lee
Journal of Clinical Medicine.2020; 10(1): 92. CrossRef - Anthropometric features in predicting insulin resistance among non-menopausal Indonesian adult females
Liong Boy Kurniawan, Bachtiar Syamsir, Ilham Akbar Rahman, Endy Adnan, Tenri Esa, Yuyun Widaningsih, Uleng Bahrun, Mansyur Arif
Romanian Journal of Internal Medicine.2020; 58(3): 168. CrossRef - Effects of magnitude of visceral adipose tissue reduction: Impact on insulin resistance, hyperleptinemia and cardiometabolic risk in adolescents with obesity after long-term weight-loss therapy
Raquel Munhoz da Silveira Campos, Deborah Cristina Landi Masquio, Flávia Campos Corgosinho, Danielle Arisa Caranti, Aline de Piano Ganen, Lian Tock, Lila Missae Oyama, Ana Raimunda Dâmaso
Diabetes and Vascular Disease Research.2019; 16(2): 196. CrossRef - Mediation analysis of dietary habits, nutrient intakes, daily life in the relationship between working hours of Korean shift workers and metabolic syndrome : the sixth (2013 ~ 2015) Korea National Health and Nutrition Examination Survey
Yoona Kim, Hyeon Hee Kim, Dong Hoon Lim
Journal of Nutrition and Health.2018; 51(6): 567. CrossRef - The cut-off values of surrogate measures for insulin resistance in the Korean population according to the Korean Genome and Epidemiology Study (KOGES)
Bongyoung Kim, Hyun Young Choi, Wonhee Kim, Chiwon Ahn, Juncheol Lee, Jae Guk Kim, Jihoon Kim, Hyungoo Shin, Jae Myung Yu, Shinje Moon, Taulant Muka
PLOS ONE.2018; 13(11): e0206994. CrossRef
 PubReader
 Cite
Cite