- Current
- Browse
- Collections
-
For contributors
- For Authors
- Instructions to authors
- Article processing charge
- e-submission
- For Reviewers
- Instructions for reviewers
- How to become a reviewer
- Best reviewers
- For Readers
- Readership
- Subscription
- Permission guidelines
- About
- Editorial policy
Articles
- Page Path
- HOME > Diabetes Metab J > Volume 42(4); 2018 > Article
-
Original ArticleObesity and Metabolic Syndrome Air Pollution Has a Significant Negative Impact on Intentional Efforts to Lose Weight: A Global Scale Analysis
-
Morena Ustulin1, So Young Park2, Sang Ouk Chin2, Suk Chon2, Jeong-taek Woo2, Sang Youl Rhee2

-
Diabetes & Metabolism Journal 2018;42(4):320-329.
DOI: https://doi.org/10.4093/dmj.2017.0104
Published online: April 24, 2018
1Department of Medicine, Graduate School of Medicine, Kyung Hee University, Seoul, Korea.
2Department of Endocrinology and Metabolism, Kyung Hee University School of Medicine, Seoul, Korea.
- Corresponding author: Sang Youl Rhee. Department of Endocrinology and Metabolism, Kyung Hee University School of Medicine, 23 Kyungheedae-ro, Dongdaemun-gu, Seoul 02447, Korea. rheesy@khu.ac.kr
• Received: December 20, 2017 • Accepted: March 7, 2018
Copyright © 2018 Korean Diabetes Association
This is an Open Access article distributed under the terms of the Creative Commons Attribution Non-Commercial License (http://creativecommons.org/licenses/by-nc/4.0/) which permits unrestricted non-commercial use, distribution, and reproduction in any medium, provided the original work is properly cited.
ABSTRACT
-
Background
- Air pollution causes many diseases and deaths. It is important to see how air pollution affects obesity, which is common worldwide. Therefore, we analyzed data from a smartphone application for intentional weight loss, and then we validated them.
-
Methods
- Our analysis was structured in two parts. We analyzed data from a cohort registered to a smartphone application in 10 large cities of the world and matched it with the annual pollution values. We validated these results using daily pollution data in United States and matching them with user information. Body mass index (BMI) variation between final and initial login time was considered as outcome in the first part, and daily BMI in the validation. We analyzed: daily calories intake, daily weight, daily physical activity, geographical coordinates, seasons, age, gender. Weather Underground application programming interface provided daily climatic values. Annual and daily values of particulate matter PM10 and PM2.5 were extracted. In the first part of the analysis, we used 2,608 users and then 995 users located in United States.
-
Results
- Air pollution was highest in Seoul and lowest in Detroit. Users decreased BMI by 2.14 kg/m2 in average (95% confidence interval, −2.26 to −2.04). From a multilevel model, PM10 (β=0.04, P=0.002) and PM2.5 (β=0.08, P<0.001) had a significant negative effect on weight loss when collected per year. The results were confirmed with the validation (βAQI*time=1.5×10⁻⁵; P<0.001) by mixed effects model.
-
Conclusion
- This is the first study that shows how air pollution affects intentional weight loss applied on wider area of the world.
- Currently, overweight and obesity are serious public health issues, which have increased in prevalence in recent years [12]. The proportion of overweight adults increased between 1980 and 2013 from 28.8% to 36.9% in men and from 29.8% to 38.0% in women worldwide [1]. Moreover, these conditions are associated with numerous comorbidities such as hypertension, diabetes [34], stroke, and cancer [56].
- Efforts to reduce the weight of individuals are important for coping with various chronic diseases associated with obesity. However, weight loss is a very difficult goal to achieve. Therefore, we need to look closely at the various contributing factors that affect obesity in humans and to study the effects of intervention on these factors.
- Indeed, traditional factors that play an important role in individual weight loss, such as physical activity and calorie restriction, are well known [78]. In recent years, it has been known that various environmental factors besides these traditional factors can affect individual weight changes [910]. However, most of these studies were conducted on only specific subjects in some parts of the world, making it difficult to generalize the results [11].
- Recently, we conducted studies using global scale data collected from a smartphone application to analyze how environmental factors affect human weight loss efforts [1213]. In this manner, novel factors, such as climate variables that were not well-known in the past, have been recognized as contributing to intentional weight loss [13].
- This study was designed to investigate the effect of air pollution on human weight loss efforts. The study consisted of two independent analyzes. First, we verified the overall correlation between the annual air pollution value particulate matter <10 µm (PM10) and the weight change of the subjects using information of the smartphone application users collected in 10 large cities around the world. Second, a more detailed correlation between air pollution and changes in body weight was obtained using daily air pollution data collected in the United States and user information of the application. Based on all this information, we were able to analyze the effects of both annual and daily variability of air pollution on human intentional efforts for weight loss.
INTRODUCTION
- Noom Coach
- Noom Coach is a popular smartphone application designed for weight loss. Since 2012, it has been the top grossing health and fitness application in the Google Play Store, and more than 1 million people have installed it on their smartphones [1415]. During the first login, the user is asked to provide some information: target body weight, current body weight, waist circumference, daily food intake, etc. This application allows to record information on physical activity, as the number of steps that the phone walked daily. Using these data, the application gives a report on the user's weight trend as well as a dietary summary of caloric intake for meals.
- Study protocol (first part)
- Initially, we extracted data from subjects registered in the application who wanted to lose weight located in 10 large cities of the world (Chicago, Los Angeles, Detroit, New York, Seoul, Tokyo, Amsterdam, Berlin, Sydney, and London) and, collecting information regarding user locations (people who registered this application on their devices were aware that anonymized information could be used in large-scale medical studies), we extracted annual pollution data from the World Health Organization's (WHO's) Global Urban Ambient Air Pollution Database [16].
- Users who installed this application from October 2012 to April 2014 were selected for this study. Users who used the application for at least 12 months, who provided their weights with information regarding meals at least once a month, and who were not 42 years of age (this is the default age given by the application if a value is not inputted) were included in this study. Users who never provided data for all meals were removed from the analysis, as it was not possible to obtain an estimated daily calories intake. Also, only users located in cities where PM10 and PM2.5 data were available for the years 2013 to 2014 were included in the analysis.
- We extracted some information of the users: age, sex, caloric intake during meals (breakfast, lunch, and dinner), height, weight, and the login days during this study. Using the height and weight of each user, it was possible to compute the body mass index (BMI) on the first and final days of the follow-up period, and also to calculate the difference between final and initial BMI. Using the caloric intake of each meal, we defined the mean value of the daily caloric intake computed over the entire study period of the user (approximately 1 year). We also took into account whether the user utilized the application often, defining the frequency of input of information regarding meals. This application allowed us to also have information on the physical activity of the user (number of steps that the phone recorded daily). Therefore, we defined the frequency of days of physical activity measured by the application over the entire study period of the user. Using these information, we analyzed 2,608 subjects.
- Study protocol (second part)
- Having user locations (latitude and longitude) in United States, we matched the information of the users provided by the application with the daily pollution data (ozone, PM10 and PM2.5) provided by AirNow application programming interface (AirNow API) [17]. These pollutants were expressed as air quality index (AQI) with a range from 0 to 500 to define the health risk level [17].
- We extracted the same information of the first part of the analysis but measuring per login day. Also, using the information in Weather Underground API [18], we considered the daily values of precipitation and temperature that are known to affect weight loss and air pollution [19]. Therefore, for each login day of users in United States, using the information of latitude and longitude, we extracted also the climatic variables. Since the seasonality seems to alter the level of pollution and change of the body weight [20], we kept also into account of it.
- Regarding the daily air pollution, we defined a pollution index as the maximum value of AQI registered between ozone, PM10 and PM2.5 per each login day. We analyzed 995 users located in United States (Midwest: Chicago, Detroit; Northeast: New York; and West: Phoenix, Denver, Boise, Anchorage, Honolulu, Los Angeles).
- Statistical analysis
- We described the general characteristics of the users with Student t-test for continuous variables (age, height, weight, and BMI) and chi-square test for categorical variables (BMI categories based on the WHO BMI classification system). Then, we used a paired t-test to compare the BMI values at baseline and at last login day for each user. To compare the variation of the BMIs among areas, we used an analysis of variance model. Then, a multilevel model with users (level 1) nested in cities (level 2) was performed to measure the possible associations between two pollutant factors (PM10 and PM2.5) and weight loss. This model took into account the possible correlations among users located in the same area (e.g., similar lifestyle, social costumes, and environmental factors). Pollutant factors were analyzed as second level variables, and the remaining variables (such as age, sex, daily caloric intake, input frequency of physical activity, etc.) were analyzed as first level variables.
- In the second part of the analysis, we performed a mixed effects model to measure the effect of the pollution index on weight loss while also considering other variables (age, gender, season of login, time of login, daily calories intake, daily intensity of precipitation, and daily temperature). With this model, we could keep track of the BMI trend for each user considering the correlated measures for each subject, since we assumed that each user had his or her own pattern due to intrinsic individual characteristics. Using the coefficients of interaction between the time of login and the predictor of pollution index, it was possible to determine how BMI changed over time when the air pollution varied.
- The entire statistical analysis was performed using SAS software (SAS Institute Inc., Cary, NC, USA) and a python program to match air pollution and climatic data with general information of the users provided by the application.
- Ethics statement
- This study was conducted in accordance with the guidelines laid down in the Declaration of Helsinki, the privacy policy of Noom Inc. (New York, NY, USA), and approved by the Kyung Hee University Hospital Institutional Review Board (KMC IRB 1435-04), which confirmed the absence of risk for the de-identified personal information leakage. The informed consents from the subjects were waived by the KMC IRB due to the retrospective design of this study.
METHODS
- Characteristics of the users
- A total of 2,608 people located in 10 cities of the world (Chicago, Los Angeles, Detroit, New York, Seoul, Tokyo, Amsterdam, Berlin, London, and Sydney; male 642, female 1,966) were included in this study (Tables 1, 2, 3).
- The mean initial BMI was 29.838, indicating that users of this application were classified in the “overweight” group according to the WHO BMI classification system (Table 1). Male users had a higher initial BMI than females (P<0.001). Users located in Seoul and Tokyo had smaller initial BMI indeed, 62.72% and 66.67% respectively were classified in “normal” level when started to use the application (Fig. 1). Instead, more people located in United States were classified in “obesity” level (approximately 60%) (Fig. 1).
- Users of the application during 2013 to 2014 were located in several cities of the world and exposed to different levels of PM10 and PM2.5 during that time (Tables 2 and 3). Users located in Seoul were exposed to higher levels of pollutants (mean PM10, 46 µg/m3; PM2.5, 24 µg/m3) than those located in other cities. Users located in Detroit were exposed to lower levels of pollution during these years (mean PM10, 13 µg/m3; PM2.5, 7 µg/m3).
- People located in Seoul were characterized by a lower initial BMI (24.27 kg/m2; 95% confidence interval [CI], 23.89 to 24.64), and users in New York were characterized by a higher initial BMI (33.15 kg/m2; 95% CI, 32.35 to 33.96) and were mainly classified as “obesity class I” by the WHO BMI classification system. Regarding the use of this smartphone application, the average number of logins for each user was 112 days, which means that each user had a login approximately every 3 days. Subjects in Tokyo and Berlin tended to log in to the application more frequently than users in other cities (average logins 154 and 127, respectively). Men used the application more often than women (125 logins vs. 107 logins). The majority of people who used the smartphone application experienced weight loss after 1 year (Table 1): 80.02% of the users achieved their goal, 18.37% gained weight, and 1.61% maintained their initial weight. Subjects showed an average decrease in BMI of 2.139 kg/m2 (P<0.001; 95% CI, −2.255 to −2.024) (Table 1) at the last login day, and this result was also found when the users were divided by sex (P<0.001) (Table 1). Comparing users from different cities, we noticed that users in Seoul had a smaller decrease in weight (BMI variation, –1.261 kg/m2) compared those located in the other cities (P<0.05), with the exception of Amsterdam and Tokyo (Tables 2 and 3). Regarding use of the smartphone application, the frequent entering of food intake information during dinner promoted weight loss (β=–1.932; 95% CI, −2.340 to −1.523) (Table 4). In addition, the physical activity information reported in the application supported greater weight loss (β=–0.642; 95% CI, −1.079 to −0.205) (Table 4).
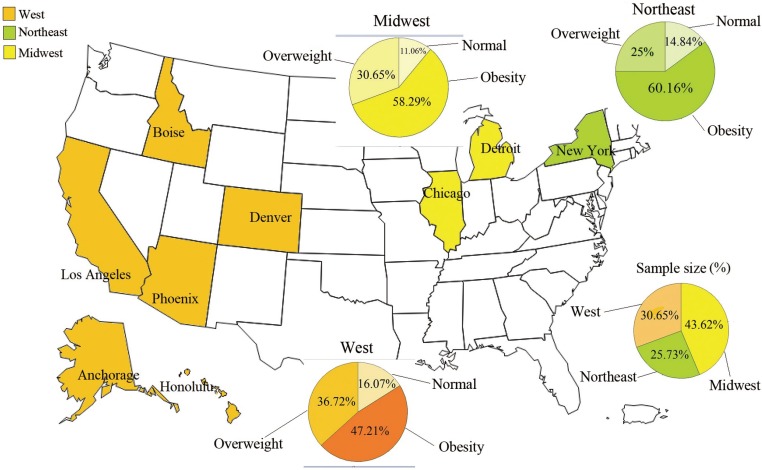
- Regarding the second part of the analysis, users of the application in United States (n=995; female 751, male 244) were located in Northeast (New York, 256 users), in Midwest (Chicago, Detroit, 434 users) and West area (Phoenix, Denver, Boise, Anchorage, Honolulu, Los Angeles, 305 users). These people were mainly obese when they started to use the application (Northeast 60.16%, West 47.21%, and Midwest 58.29%) (Fig. 2). They had a login approximately each 4 days and male users logged in the application more often than female group (114 logins vs. 93 logins). Users in United States who used this application achieved their goal to lose weight after 1 year (βtime= –0.0178, P<0.001) (Table 4).
- Effect of the air pollution on weight loss
- People exposed to pollutants (both PM10 and PM2.5) tended to have less of a decrease in body weight than users exposed to a lower level of pollutants (Table 4). The estimates of the pollutant coefficients were positive and significant (βPM2.5=0.085, βPM10=0.043; P<0.05) showing that an increase in pollution exposure correlated with a positive increase in BMI variation (final BMI–initial BMI). When we removed from the analysis the users in Seoul and Tokyo having initial BMIs that are far from the BMIs in the other cities, we obtained that PM2.5 continued to be significant (P<0.001) showing an association with weight changes.
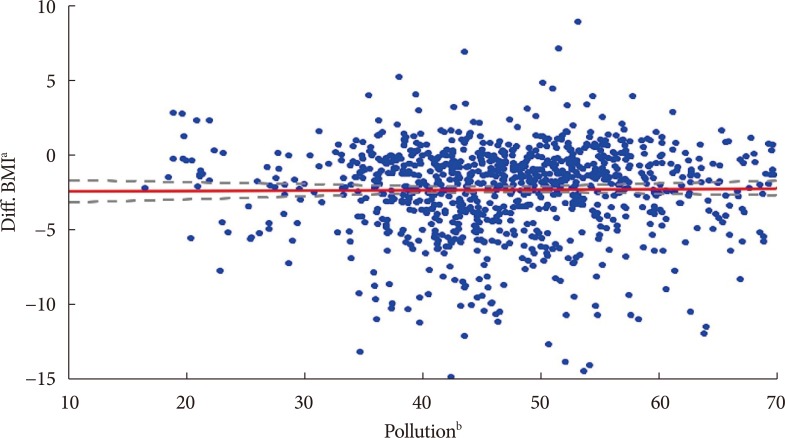
- We confirmed this result also when the daily BMI variation was measured in the second part of the study: analysing the coefficient of interaction between pollution variable and time, we noticed that the variation in BMI, varying the time with a single unit, tended to be less negative when the level of pollution increased (β=1.5×10⁻⁵, P<0.001) (Table 4). Therefore, high levels of pollution had negative impact on the weight loss. This result can be also observed in the graph (Fig. 3), in which the values of weight loss (final BMI–initial BMI) for each subject and the mean values of pollution variable are plotted. Also, analysing the coefficient of the “time,” it is shown that people located in United States lose their weight over time (β<0, P<0.001) (Table 4).
RESULTS
- Our analysis guaranteed us to consider the correlation between people located in the same town; indeed, Seoul and Tokyo showed a bigger percentage of people with normal BMIs at the starting point. Conversely, other cities of the world were characterized mainly by obese users; this feature was making clear the differences in social costumes present in several cities of the world. Therefore, through this analysis, we were able to keep into account of the differences between cities all over the world (such as culture, race, diet, etc.) that can affect the outcome.
- When we analyzed the association between air pollution and variation of BMI, we found that high values of PM10 and PM2.5 reduced weight loss, suggesting that exposure to them makes intentional weight loss more difficult. This tendency was maintained also when we removed Seoul and Tokyo from the analysis, which as we said above are characterized by a lower initial BMI.
- Our result was also confirmed in the second phase of the analysis, where we used more detailed data on air pollution. They were collected per login day and allow us to keep into account also of climatic factors (temperature and rain) that are known to affect both the air pollution and weight body change [1319]. Analyzing the information of the users in each login day, we have been able to consider also the seasonality, that it is known to be associated with the pollution levels and with the change of the life style that has a direct effect on body weight [2122].
- We also found that the use of this application helped people to lose weight, confirming the results obtained in previous studies [1213]. People who frequently entered food intake information during dinner and who were physically active (measured as the number of steps per day) had better performance in loosing weight.
- Unfortunately, in the first part of the analysis, where the sample was extended in more regions of the world, we had less precise values of the air pollution (per year) and we cannot consider the seasonal variation and the impact that climatic factors have on the association between air pollution and weight loss. Nevertheless, collecting daily information on the air pollution in specific zones in the United States defined by geographical coordinates (longitude and latitude), guaranteed us to keep into account of the different levels of air pollution that can exist in rural and urban areas, keeping into account also of the seasonality and weather variables (rain and temperature).
- Regarding the variables accounted in our analysis, there are some limitations: physical activity was measured as number of steps recorded on mobile phone avoiding the consideration of activities done without phone such as swimming, cycling, etc. Nevertheless, running activity is one of the most popular exercise among people with the only purpose to lose weight, and therefore, we considered this measure as index of physical activity. Also, regarding the calories intake in the meals, the calories counter in the application was not precise but anyway we considered this characteristic in the model since the variation of weight is conditioned by the total daily calories intake.
- Another limitation is that our study could not collect information such as the presence of some diseases, medication, smoking status, occupational air pollution, etc. Indeed, through the smartphone application, we could not extract this information. Nevertheless, the smartphone technology provided the possibility to combine environmental information (through login time and geographical coordinates) and body weight changes.
- Some studies in the literature have suggested that air pollution can be a risk factor for childhood obesity. Children in southern California aged 9 to 10 years old were followed until age 18, and traffic density (one of the main sources of air pollution) was associated with BMI [23]. A study analyzing exposure to polycyclic aromatic hydrocarbons during pregnancy and the weights of children ages 5 to 7 showed an association between maternal exposure to these pollutants and childhood obesity in children living in New York [24]. Animal studies have also shown that pregnant rats exposed to unfiltered Beijing air were significantly heavier at the end of pregnancy than pregnant rats exposed to filtered air [25].
- All of these studies in the literature have focused on the effects of air pollution on weight changes in childhood, or using animal models. These studies were also limited to specific areas without considering that pollution intensity changes significantly in different zones. In our study instead, we analyzed data in a wider spectrum considering people located in different geographical area. Even if the pollution data collected for distinct geographical areas were collected per year, we validated these results through a methodology that analysed the trend for each user and computed an average effect of the evaluated associations. Therefore, the results in agreement guaranteed us the power of our results and, as it is explained in some articles [25], air pollution could be a factor that induces some mechanisms associated with adipose inflammation and metabolic changes that increase body weight.
- This study provides the first indication of an association between air pollution and weight changes in an adult population extended to several geographical areas.
- In conclusions, this is the first study that measures how air pollution can impact the efforts to lose weight on an adult population located in several geographical areas by applying also a validation of the findings. Our results are in agreement with analogous results obtained in some animal based models.
DISCUSSION
-
Acknowledgements
- The authors would like to thank Emeritus Professor Young Seol Kim at Kyung Hee University for his teaching and inspiration, which encouraged us to conduct this study.
- This research was supported by a grant from the Korea Health Technology R&D Project through the Korea Health Industry Development Institute (KHIDI), funded by the Ministry of Health and Welfare, Republic of Korea (HI16C2048).
ACKNOWLEDGMENTS
-
CONFLICTS OF INTEREST: No potential conflict of interest relevant to this article was reported.
NOTES
- 1. Ng M, Fleming T, Robinson M, Thomson B, Graetz N, Margono C, Mullany EC, Biryukov S, Abbafati C, Abera SF, Abraham JP, Abu-Rmeileh NM, Achoki T, AlBuhairan FS, Alemu ZA, Alfonso R, Ali MK, Ali R, Guzman NA, Ammar W, Anwari P, Banerjee A, Barquera S, Basu S, Bennett DA, Bhutta Z, Blore J, Cabral N, Nonato IC, Chang JC, Chowdhury R, Courville KJ, Criqui MH, Cundiff DK, Dabhadkar KC, Dandona L, Davis A, Dayama A, Dharmaratne SD, Ding EL, Durrani AM, Esteghamati A, Farzadfar F, Fay DF, Feigin VL, Flaxman A, Forouzanfar MH, Goto A, Green MA, Gupta R, Hafezi-Nejad N, Hankey GJ, Harewood HC, Havmoeller R, Hay S, Hernandez L, Husseini A, Idrisov BT, Ikeda N, Islami F, Jahangir E, Jassal SK, Jee SH, Jeffreys M, Jonas JB, Kabagambe EK, Khalifa SE, Kengne AP, Khader YS, Khang YH, Kim D, Kimokoti RW, Kinge JM, Kokubo Y, Kosen S, Kwan G, Lai T, Leinsalu M, Li Y, Liang X, Liu S, Logroscino G, Lotufo PA, Lu Y, Ma J, Mainoo NK, Mensah GA, Merriman TR, Mokdad AH, Moschandreas J, Naghavi M, Naheed A, Nand D, Narayan KM, Nelson EL, Neuhouser ML, Nisar MI, Ohkubo T, Oti SO, Pedroza A, Prabhakaran D, Roy N, Sampson U, Seo H, Sepanlou SG, Shibuya K, Shiri R, Shiue I, Singh GM, Singh JA, Skirbekk V, Stapelberg NJ, Sturua L, Sykes BL, Tobias M, Tran BX, Trasande L, Toyoshima H, van de Vijver S, Vasankari TJ, Veerman JL, Velasquez-Melendez G, Vlassov VV, Vollset SE, Vos T, Wang C, Wang X, Weiderpass E, Werdecker A, Wright JL, Yang YC, Yatsuya H, Yoon J, Yoon SJ, Zhao Y, Zhou M, Zhu S, Lopez AD, Murray CJ, Gakidou E. Global, regional, and national prevalence of overweight and obesity in children and adults during 1980-2013: a systematic analysis for the Global Burden of Disease Study 2013. Lancet 2014;384:766-781. ArticlePubMedPMC
- 2. Davis B, Wansink B. Fifty years of fat: news coverage of trends that predate obesity prevalence. BMC Public Health 2015;15:629ArticlePubMedPMCPDF
- 3. Son YJ, Kim J, Park HJ, Park SE, Park CY, Lee WY, Oh KW, Park SW, Rhee EJ. Association of waist-height ratio with diabetes risk: a 4-year longitudinal retrospective study. Endocrinol Metab (Seoul) 2016;31:127-133. ArticlePubMedPMCPDF
- 4. Way KL, Hackett DA, Baker MK, Johnson NA. The effect of regular exercise on insulin sensitivity in type 2 diabetes mellitus: a systematic review and meta-analysis. Diabetes Metab J 2016;40:253-271. ArticlePubMedPMCPDF
- 5. Patterson RE, Frank LL, Kristal AR, White E. A comprehensive examination of health conditions associated with obesity in older adults. Am J Prev Med 2004;27:385-390. ArticlePubMed
- 6. Mokdad AH, Ford ES, Bowman BA, Dietz WH, Vinicor F, Bales VS, Marks JS. Prevalence of obesity, diabetes, and obesity-related health risk factors, 2001. JAMA 2003;289:76-79. ArticlePubMed
- 7. Elfhag K, Rossner S. Who succeeds in maintaining weight loss? A conceptual review of factors associated with weight loss maintenance and weight regain. Obes Rev 2005;6:67-85. ArticlePubMed
- 8. Kim SH, Plutzky J. Brown fat and browning for the treatment of obesity and related metabolic disorders. Diabetes Metab J 2016;40:12-21. ArticlePubMedPMCPDF
- 9. Tucker P, Gilliland J. The effect of season and weather on physical activity: a systematic review. Public Health 2007;121:909-922. ArticlePubMed
- 10. O'Hare C, O'Sullivan V, Flood S, Kenny RA. Seasonal and meteorological associations with depressive symptoms in older adults: a geo-epidemiological study. J Affect Disord 2016;191:172-179. ArticlePubMed
- 11. Lewis LK, Maher C, Belanger K, Tremblay M, Chaput JP, Olds T. At the mercy of the gods: associations between weather, physical activity, and sedentary time in children. Pediatr Exerc Sci 2016;28:152-163. ArticlePubMed
- 12. Chin SO, Keum C, Woo J, Park J, Choi HJ, Woo JT, Rhee SY. Successful weight reduction and maintenance by using a smartphone application in those with overweight and obesity. Sci Rep 2016;6:34563ArticlePubMedPMCPDF
- 13. Ustulin M, Keum C, Woo J, Woo JT, Rhee SY. Effects of climatic variables on weight loss: a global analysis. Sci Rep 2017;7:40708ArticlePubMedPMCPDF
- 14. Pagoto S, Schneider K, Jojic M, DeBiasse M, Mann D. Evidence-based strategies in weight-loss mobile apps. Am J Prev Med 2013;45:576-582. ArticlePubMed
- 15. Patel R, Sulzberger L, Li G, Mair J, Morley H, Shing MN, O'Leary C, Prakash A, Robilliard N, Rutherford M, Sharpe C, Shie C, Sritharan L, Turnbull J, Whyte I, Yu H, Cleghorn C, Leung W, Wilson N. Smartphone apps for weight loss and smoking cessation: quality ranking of 120 apps. N Z Med J 2015;128:73-76.
- 16. World Health Organization. Air pollution cited 2018 Mar 27. Available from: http://www.who.int/topics/air_pollution/en.
- 17. AirNow. Air quality index (AQI) basics cited 2018 Mar 27. Available from: https://www.airnow.gov/index.cfm?action=aqibasics.aqi.
- 18. The Weather Company. A weather API designed for developers cited 2018 Mar 27. Available from: https://www.wunderground.com/weather/api.
- 19. Jacob DJ, Winner DA. Effect of climate change on air quality. Atmos Environ 2009;43:51-63.Article
- 20. Peng RD, Dominici F, Pastor-Barriuso R, Zeger SL, Samet JM. Seasonal analyses of air pollution and mortality in 100 US cities. Am J Epidemiol 2005;161:585-594. ArticlePubMed
- 21. Ridgers ND, Salmon J, Timperio A. Too hot to move? Objectively assessed seasonal changes in Australian children's physical activity. Int J Behav Nutr Phys Act 2015;12:77ArticlePubMedPMCPDF
- 22. Klenk J, Buchele G, Rapp K, Franke S, Peter R. ActiFE Study Group. Walking on sunshine: effect of weather conditions on physical activity in older people. J Epidemiol Community Health 2012;66:474-476. ArticlePubMed
- 23. Jerrett M, McConnell R, Chang CC, Wolch J, Reynolds K, Lurmann F, Gilliland F, Berhane K. Automobile traffic around the home and attained body mass index: a longitudinal cohort study of children aged 10-18 years. Prev Med 2010;50(Suppl 1):S50-S58. ArticlePubMed
- 24. Rundle A, Hoepner L, Hassoun A, Oberfield S, Freyer G, Holmes D, Reyes M, Quinn J, Camann D, Perera F, Whyatt R. Association of childhood obesity with maternal exposure to ambient air polycyclic aromatic hydrocarbons during pregnancy. Am J Epidemiol 2012;175:1163-1172. ArticlePubMedPMC
- 25. Wei Y, Zhang JJ, Li Z, Gow A, Chung KF, Hu M, Sun Z, Zeng L, Zhu T, Jia G, Li X, Duarte M, Tang X. Chronic exposure to air pollution particles increases the risk of obesity and metabolic syndrome: findings from a natural experiment in Beijing. FASEB J 2016;30:2115-2122. ArticlePubMedPMCPDF
REFERENCES
Fig. 1

Distribution of the initial body mass index per town. Darker colors define increasing levels of weight (“normal,” “overweight,” “obesity”). Pie charts and map were realized with SAS software.
Fig. 2
Distribution of the initial body mass index per area in United States (northeast, west, and midwest). The cities were grouped per area for the small size. Pie charts and map were realized with SAS software.
Fig. 3

Scatter plot of the weight loss and intensity of air pollution. aDiff. BMI=final BMI–initial body mass index per user, bPollution=mean of the air quality index computed on the entire observation period per user.
Table 1
![dmj-42-320-i001.jpg]()
Demographic characteristics (first part)
Table 2
![dmj-42-320-i002.jpg]()
Distribution of pollutants and mean BMI variation by area (first part)
Table 3
![dmj-42-320-i003.jpg]()
Comparison of mean BMI variation (final BMI–initial BMI) between areasa
Table 4
![dmj-42-320-i004.jpg]()
Effects of PM2.5 and PM10 on weight loss (first and second part)
Figure & Data
References
Citations
Citations to this article as recorded by 
- What could be the reasons for not losing weight even after following a weight loss program?
Jyoti Dabas, S. Shunmukha Priya, Akshay Alawani, Praveen Budhrani
Journal of Health, Population and Nutrition.2024;[Epub] CrossRef - Subchronic exposure to 1,2-naphthoquinone induces adipose tissue inflammation and changes the energy homeostasis of mice, partially due to TNFR1 and TLR4
Clílton Kraüss de Oliveira Ferreira, Clara Machado Campolim, Olívia Pizetta Zordão, Fernando Moreira Simabuco, Chadi Pellegrini Anaruma, Rodrigo Martins Pereira, Vitor Ferreira Boico, Luiz Guilherme Salvino, Maíra Maftoum Costa, Nathalia Quintero Ruiz, Le
Toxicology Reports.2023; 11: 10. CrossRef - Effects of Ambient Particulate Matter (PM2.5) Exposure on Calorie Intake and Appetite of Outdoor Workers
Thavin Kumar Mathana Sundram, Eugenie Sin Sing Tan, Hwee San Lim, Farahnaz Amini, Normina Ahmad Bustami, Pui Yee Tan, Navedur Rehman, Yu Bin Ho, Chung Keat Tan
Nutrients.2022; 14(22): 4858. CrossRef - Efficiency in reducing air pollutants and healthcare expenditure in the Seoul Metropolitan City of South Korea
Subal C. Kumbhakar, Jiyeon An, Masoomeh Rashidghalam, Almas Heshmati
Environmental Science and Pollution Research.2021; 28(20): 25442. CrossRef - Seasonal variation and trends in the Internet searches for losing weight: An infodemiological study
Ying Teng, Shun-Wei Huang, Zhen Li, Qiao-Mei Xie, Man Zhang, Qiu-Yue Lou, Fang Wang, Yan-Feng Zou
Obesity Research & Clinical Practice.2020; 14(3): 225. CrossRef - Estimation of health benefits from air quality improvement using the MODIS AOD dataset in Seoul, Korea
Daeun Kim, Jeongyeong Kim, Jaehwan Jeong, Minha Choi
Environmental Research.2019; 173: 452. CrossRef - Appropriate Medical Technology in the Era of the 4th Industrial Revolution
Sang Youl Rhee
The Korean Journal of Medicine.2019; 94(5): 387. CrossRef - Can Air Pollution Biologically Hinder Efforts to Lose Body Weight?
Duk-Hee Lee
Diabetes & Metabolism Journal.2018; 42(4): 282. CrossRef
 PubReader
 Cite
Cite