
- Current
- Browse
- Collections
-
For contributors
- For Authors
- Instructions to authors
- Article processing charge
- e-submission
- For Reviewers
- Instructions for reviewers
- How to become a reviewer
- Best reviewers
- For Readers
- Readership
- Subscription
- Permission guidelines
- About
- Editorial policy
Articles
- Page Path
- HOME > Diabetes Metab J > Volume 40(3); 2016 > Article
-
Original ArticleClinical Care/Education Feasibility of a Patient-Centered, Smartphone-Based, Diabetes Care System: A Pilot Study
-
Eun Ky Kim1, Soo Heon Kwak2, Seungsu Baek3, Seung Lyeol Lee3, Hak Chul Jang4, Kyong Soo Park2, Young Min Cho2

-
Diabetes & Metabolism Journal 2016;40(3):192-201.
DOI: https://doi.org/10.4093/dmj.2016.40.3.192
Published online: April 8, 2016
1International Healthcare Center, Seoul National University Hospital, Seoul National University College of Medicine, Seoul, Korea.
2Department of Internal Medicine, Seoul National University College of Medicine, Seoul, Korea.
3Health Connect Co. Ltd., Seoul, Korea.
4Department of Internal Medicine, Seoul National University Bundang Hospital, Seoul National University College of Medicine, Seongnam, Korea.
- Corresponding author: Young Min Cho. Department of Internal Medicine, Seoul National University College of Medicine, 101 Daehak-ro, Jongno-gu, Seoul 03080, Korea. ymchomd@snu.ac.kr
Copyright © 2016 Korean Diabetes Association
This is an Open Access article distributed under the terms of the Creative Commons Attribution Non-Commercial License (http://creativecommons.org/licenses/by-nc/3.0/) which permits unrestricted non-commercial use, distribution, and reproduction in any medium, provided the original work is properly cited.
ABSTRACT
-
Background
- We developed a patient-centered, smartphone-based, diabetes care system (PSDCS). This study aims to test the feasibility of glycosylated hemoglobin (HbA1c) reduction with the PSDCS.
-
Methods
- This study was a single-arm pilot study. The participants with type 2 diabetes mellitus were instructed to use the PSDCS, which integrates a Bluetooth-connected glucometer, digital food diary, and wearable physical activity monitoring device. The primary end point was the change in HbA1c from baseline after a 12-week intervention.
-
Results
- Twenty-nine patients aged 53.9±9.1 years completed the study. HbA1c and fasting plasma glucose levels decreased significantly from baseline (7.7%±0.7% to 7.1%±0.6%, P<0.0001; 140.9±39.1 to 120.1±31.0 mg/dL, P=0.0088, respectively). The frequency of glucose monitoring correlated with the magnitude of HbA1c reduction (r=–0.57, P=0.0013). The components of the diabetes self-care activities, including diet, exercise, and glucose monitoring, were significantly improved, particularly in the upper tertile of HbA1c reduction. There were no severe adverse events during the intervention.
-
Conclusion
- A 12-week application of the PSDCS to patients with inadequately controlled type 2 diabetes resulted in a significant HbA1c reduction with tolerable safety profiles; these findings require confirmation in a future randomized controlled trial.
- Diabetes mellitus is a threat to public health and the economy. As of 2013, the number of people with diabetes was estimated to be 382 million worldwide, and this number is expected to increase to 471 million by 2035 [1]. The diabetes-related health expenditure worldwide in 2013 was estimated to be US dollar 548 billion [1]. Because diabetes is a manageable chronic disease rather than a curable disease, more emphasis should focus on life-long lifestyle modifications and medications. Therefore, diabetes self-management education and adherence to the treatment plans are considered the key components for the clinical management of diabetes [23].
- A variety of information technology (IT)-based interventions have been developed to support diabetes self-management [456]. However, mixed results have been reported with regard to glycosylated hemoglobin (HbA1c) reduction [78910111213141516171819202122232425262728293031]. In a systematic review that compared the computerized decision support systems (CDSS) with conventional care [4], CDSS with feedback on the patient's performance and case management by health care providers reduced HbA1c [789101112], whereas CDSS without feedback or case management demonstrated no effect [131415161718192021]. The HbA1c-lowering effect of the various computer-based interventions, including clinic-, Internet-, and mobile phone-based systems, was as small as –0.2% (95% confidence interval [CI], –0.4 to –0.1) compared with control interventions [5]. Among the interventions, three mobile phone-based interventions decreased HbA1c by –0.5% (95% CI, –0.7 to –0.3) compared with the control interventions [5]. In a meta-analysis including 10 studies, educational intervention via text messaging showed an overall –0.6% reduction of HbA1c compared with the control intervention [6]. These results suggest that an IT-based diabetes care system with feedback and case management modules can be an effective tool for maintaining glycemic control and that the benefits might be larger by using mobile phone-based interventions.
- Recently, the revolutionary generation of a mobile phone, the smartphone, became the mainstream of IT-based communications, with 1.4 billion users worldwide as of 2013 [32]. Similarly, mobile healthcare systems are rapidly evolving. Numerous applications have been developed for patients with chronic diseases requiring daily monitoring and management. However, a systematic review, including 71 smartphone applications for diabetes self-management available from the Apple App Store (as of 2012), revealed that the majority of those applications were not sufficient or comprehensive for daily diabetes self-management [33]. They primarily focused on monitoring blood glucose levels, medications, and diet. However, the proportion of applications supporting physical activity, diabetes education, and decision support was relatively low [33]. In addition, the majority of the applications were not equipped with other convenient modules, such as automated data entry, social networking, and data integration with a patient health record system [33]. Therefore, more comprehensive smartphone-based interventions, including various components of diabetes self-management, are necessary.
- In this study, we developed a new patient-centered, smartphone-based, diabetes care system (PSDCS) featuring individualized diabetes management algorithm, automatic input of daily glucose levels and physical activity, guidance for basal insulin dosage, and various interactive components, including social network system (SNS). The PSDCS particularly supports patient's decision making to cope with high or low glucose and suggests insulin dosage, if the patient is on insulin treatment. The aim of this study was to test the feasibility of HbA1c reduction using PSDCS in patients with type 2 diabetes.
INTRODUCTION
- Study participants
- Patients with type 2 diabetes who were between 20 and 80 years and whose HbA1c levels were greater than or equal to 6.5% were recruited from the outpatient clinic of the Seoul National University Hospital during December 2013 and January 2014. The HbA1c cut-off value of 6.5% was according to clinical practice guidelines by International Diabetes Federation [34] and Korean Diabetes Association [35]. Patients were excluded from the study for the following: severe diabetic complications (severe non-proliferative retinopathy or proliferative retinopathy, stage 4 or 5 of chronic kidney disease, severe diabetic neuropathy, history of diabetic foot, and history of angina pectoris, myocardial infarction, cerebrovascular disease, and peripheral arterial disease), type 1 diabetes, insulin therapy other than insulin glargine, insulin pump, history of drug addiction, psychotic disorder, and pregnancy. Participants were divided into four groups based on the type of treatment. The patients without antidiabetic medication were assigned to group A, and those who were taking oral antidiabetic medication(s) with minimal risk of hypoglycemia (e.g., metformin, α-glucosidase inhibitors, thiazolidinediones, and dipeptidyl peptidase-4 inhibitors) were assigned to group B. The patients taking oral antidiabetic medication(s) with increased risk of hypoglycemia (e.g., sulfonylureas and meglitinides) were assigned to group C, and insulin glargine users were assigned to group D. According to the four different treatment groups, the patients received different feedback when their glucose levels were entered into the system. This study was conducted according to the guidelines of the Declaration of Helsinki. The study protocol was approved by the Institutional Review Board of the Seoul National University Hospital (IRB No. H-1301-075-459) and the Ministry of Food and Drug Safety of the Republic of Korea (Approval No. 426). Written informed consent was obtained from all participants before any study-related procedures were commenced.
- Study design
- In this 12-week, single-arm, pilot study, the participants used PSDCS for diabetes self-management, and the feasibility of PSDCS was evaluated. It was installed manually by our study team to enrolled participants. Before initiating the smartphone application, the participants were engaged in a face-to-face instruction session to understand the detailed use of the PSDCS. The smartphone application displayed individualized daily recommendations for calorie intake and physical activity for each individual, based on their baseline calorie intake, physical activity, and body weight. The participants were recommended to input their dietary intake in the smartphone application, which was used for self-monitoring. The blood glucose level was monitored using a Bluetooth glucometer (MyGlucoHealth; Entra Health Systems, Seoul, Korea), and the participants were recommended to measure their glucose level at least once a day, preferably before breakfast. In addition, the participants monitored their physical activity status using a Bluetooth activity tracker (LG LifeGram LA11M-BS; LG Electronics, Seoul, Korea).
- Using the PSDCS, we investigated efficacy and safety measures at the baseline and after 12 weeks of intervention. We measured HbA1c, fasting plasma glucose (FPG), body weight, blood pressure, total cholesterol, triglyceride, high density lipoprotein cholesterol (HDL-C), low density lipoprotein cholesterol (LDL-C), aspartate transaminase, and alanine transaminase. Summary of diabetes self-care activities (SDSCA) was used to evaluate the overall self-management activities for diabetes [36]. SDSCA contains a total of 11 questions in six categories (general diet, specific diet, exercise, blood glucose testing, foot care, and medication); we evaluated the number of days during the previous week in which the specific activity occurred. The primary end point was the change in HbA1c at 12 weeks of intervention compared with baseline. The secondary end points were the changes in FPG, lipids, body weight, and the SDSCA scores. Changing the prescription of medication, except the insulin dose, was not allowed during the study period. The insulin dose was recommended according to a specific algorithm in PSDCS.
- Patient-centered smartphone-based diabetes care system
- The PSDCS had an android-based application, which was composed of four modules: a glucose module, a diet module, a physical activity module, and an SNS module. The glucose module consisted of a Bluetooth glucometer, feedback messages according to the glucose levels, recommendations for basal insulin dosage, and algorithms for detecting and coping with hypoglycemia and serious hyperglycemia. The diet module consisted of recording daily dietary intake and calculating total calories and nutrients based on a predefined food database. The physical activity module consisted of an activity tracker, a semi-automatic energy expenditure calculator, and video clips that guided resistance excise. The individualized target goal for diet and physical activity was set at baseline. The SNS module could motivate the participants by sharing their thoughts, opinions, and tips for diabetes self-care.
- As soon as the blood glucose was measured and transmitted to the smartphone application, a feedback message immediately popped up, according to the glycemic control algorithm. A glucose level between 70 and 130 mg/dL was set as the target. A glucose level between 130 and 180 mg/dL was considered to be fair. When the glucose level was between 180 and 250 mg/dL, the patient received an alarm message. If the glucose level was between 250 and 320 mg/dL for 3 consecutive days or higher than 320 mg/dL once, an alarm message was sent to a pre-registered family member of the patient, and an automatic phone call was made from the patient's smartphone to the research clinic to assess the patient's condition. When hypoglycemia (glucose <70 mg/dL) occurred, an acute management pathway that has been described elsewhere [37] was automatically activated. If the patient did not execute the acute management plan within 1 minute, an alarm message was sent to the designated family member and an automatic phone call to the research clinic was made
- For participants on basal insulin glargine therapy, an insulin dose was recommended, according to the following algorithm. When the median fasting glucose level from the 3 previous days was in the range of 130 to 159, 160 to 189, 190 to 219, 220 to 249, 250 to 279, and 280 to 319 mg/dL, an increase in the insulin dosage by 2, 3, 4, 5, 6, and 7 units, respectively, was recommended. If the patient did not follow the recommendation, the actual insulin dosage was manually entered into the system. For safety reasons, the total increase in the insulin dosage from baseline via the PSDCS during the 12-week study period was limited to 10 units. When the glucose level was still inadequately controlled using the maximal recommended insulin dosage, the patient was instructed to make an unscheduled visit to the research clinic. If the patient experienced hypoglycemia with a blood glucose level below 70 mg/dL on any of the previous 3 days, the insulin dose was not allowed to be increased. After acute management of the hypoglycemic event, the insulin dose was recommended to be reduced according to the glucose level (–2 units when the glucose levels were 55 to 70 mg/dL and –4 units when the glucose levels were <55 mg/dL).
- Each participant was instructed to record the daily dietary intake using the smartphone application. The PSDCS counted and displayed the daily total calorie intake. In addition, it analyzed the participant's dietary habit and food preferences. The amount of exercise and energy expenditure was estimated by the activity tracker and could be manually adjusted by the participant, according to the specific types and duration of exercise (e.g., swimming). It also included 238 video clips, mostly guided resistance exercise and stretching. For overweight patients, the PSDCS recommended scheduled exercise programs every week. The PSDCS also contained diabetes self-management educational material that provided detailed information concerning how to manage various diabetes-related conditions and specific situations, including sick-day rules. The SNS was designed for sharing information about diabetes management and posting anything that the participant wanted to share. The SNS displayed the scores and ranks according to the number of access to the PSDCS.
- The website for physicians was developed to show the baseline characteristics, including anthropometric data, prescribed medications, and laboratory data, and to monitor readouts of the glucometer, amounts of daily calorie intake, and daily physical activity. All the participants were informed that their physician could observe their condition, progress, and adherence to the PSDCS through the website. The data in this website were used for discussion with the participants in the clinic at the end of the study.
- Statistical analysis
- The results are presented as the mean±standard deviation values. After confirmation of normal distribution of parameters using the Kolmogorov-Smirnov test, the comparison of each parameter taken at baseline and at the end of the study was performed using the paired t-test. To compare the mean values of multiple groups, one-way analysis of variance was used. The correlations between continuous variables were assessed using Pearson correlation analysis. A Wilcoxon matched pairs test was used to analyze the changes in several parameters that did not exhibit a normal distribution and subgroup analysis. Statistical significance was assumed when P<0.05. Statistical analyses were performed using SPSS 21.0 version (IBM Co., Armonk, NY, USA) or Prism 5.0 (GraphPad, San Diego, CA, USA).
METHODS
- Thirty-one patients were screened, and one patient was excluded because of low HbA1c. One patient withdrew from the study. A total of 29 patients completed the 12-week intervention. The mean age of the participants was 53.9±9.1 years. Baseline HbA1c was 7.7%±0.7%; baseline FPG was 140.9±39.1 mg/dL; baseline body mass index was 25.0±2.8 kg/m2. The baseline characteristics of the study participants are shown in Table 1.
- After the 12-week intervention, HbA1c significantly decreased by 0.6%±0.7% from baseline (P<0.0001) (Fig. 1A and B), and FPG decreased by 20.8±39.9 mg/dL from baseline (P=0.0088) (Fig. 1C and D). There were no differences in the change in HbA1c and FPG among the four groups (data not shown), although the numbers of participants were not evenly distributed and the number of participants in each group was too small to initiate comparisons. There was a linear correlation between baseline HbA1c and the amount of change in HbA1c (r=–0.68, P<0.0001) (Fig. 2A). The HbA1c reduction was correlated with the average number of daily glucometer input (r=–0.57, P=0.0013) (Fig. 2B). The number of glucometer inputs tended to be higher in older patients (0.7±0.4/day in patients ≤44 years, 1.0±0.6/day in patients 45 to 54 years, 1.3±0.9/day in patients 55 to 64 years, and 1.6±0.4 /day in patients ≥65 years; P=0.10), although it was not statistically significant. A subgroup analysis was performed with the patients whose glucometer input frequency was at least once a day (n=18) and the patients whose glucometer input frequency was less than once a day (n=11). In the former group, HbA1c changed from 7.9%±0.7% to 7.1%±0.5% (P=0.0005) (Fig. 2C). However, in the latter group, HbA1c did not decrease significantly (7.4%±0.7% to 7.2%±0.7%, P=0.24) (Fig. 2D).
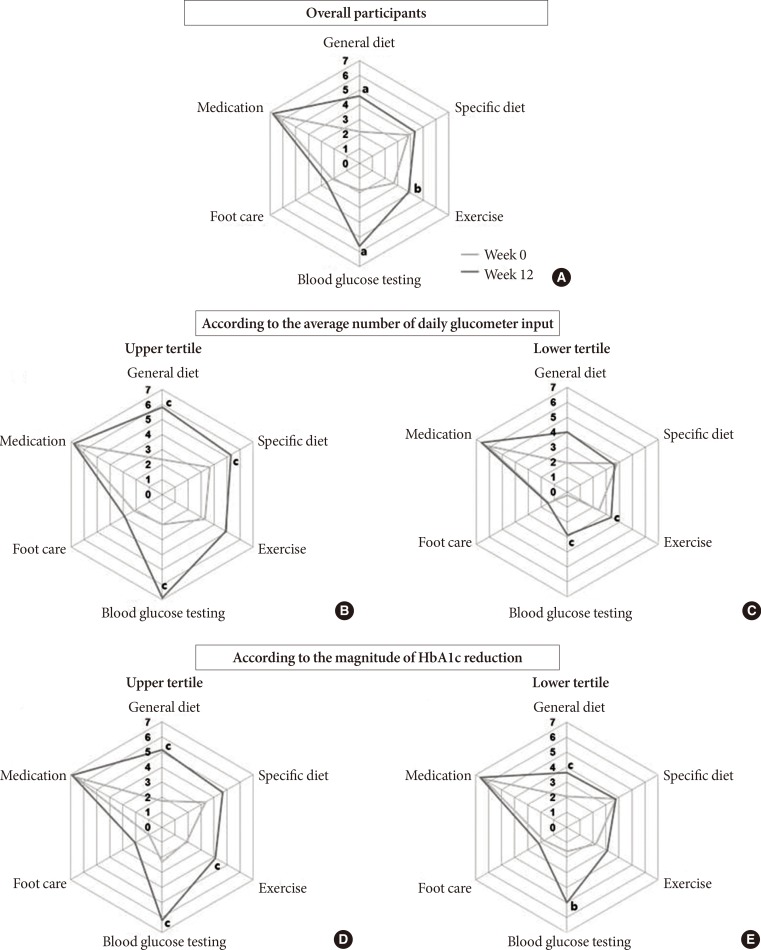
- After 12 weeks, body weight and the levels of total cholesterol, triglyceride, HDL-C, and LDL-C did not change (Table 1). In terms of the SDSCA, the scores of "general diet," "exercise," and "blood glucose testing" increased significantly after 12 weeks (Fig. 3A). When the patients were divided into three groups according to the average number of the glucometer inputs, the upper tertile presented more improved SDSCA scores than the lower tertile (Fig. 3B and C). When the patients were divided into three groups according to the magnitude of HbA1c reduction, the SDSCA scores increased more in the upper tertile of HbA1c reduction (Fig. 3D and E).
- Twelve serious hyperglycemia events, which were predefined to be 320 mg/dL or higher by the glucometer readouts, were reported in seven patients. All of the hyperglycemia events spontaneously resolved, except in one patient, who showed aggravation of glucose control associated with upper respiratory tract infection and who was requested to make an unscheduled visit to the research clinic to adjust the insulin dose. Hypoglycemia (<70 mg/dL) occurred in one patient using glimepiride (group C) before eating breakfast, which was immediately resolved by eating breakfast. Severe adverse events did not occur during the study period.
RESULTS
- In this study, HbA1c and FPG decreased significantly after 12 weeks of the PSDCS intervention. HbA1c changed by –0.6% from baseline, which was consistent with previous reports using mobile phone interventions [56]. The PSDCS significantly improved diabetes self-management in terms of diet, exercise, and blood glucose monitoring. Overall, we found that PSDCS is a promising tool for aiding self-management and effectively lowering blood glucose levels without significant increase in adverse events.
- Because our PSDCS was based on a smartphone application, one may be concerned that elderly patients would have a decreased usability presumably because of a decreased interest in the program and because of the complexity of the program. However, the number of daily glucometer inputs tended to be higher with increasing age, although this difference was not statistically significant (P=0.10). In a study of a web-based intervention in patients with diabetes aged 60 years or older, all 31 participants in the intervention group used the system well, resulting in a significant HbA1c reduction [9]. Another study with a ubiquitous healthcare system using a telephone network-connected glucometer and short message service on mobile phones in elderly patients showed a completion rate of more than 90% with beneficial effects on glycemic control [26]. Considering that the number of elderly diabetes patients is increasing [38], the PSDCS would be a good tool for improving their diabetes care.
- An important outcome of the PSDCS should be the change in the patient's behavior concerning the self-management of diabetes. In this regard, there was a significant correlation between average daily glucometer input numbers and HbA1c reduction. It was reported that more frequent measurements of blood glucose levels improved glycemic control even without IT applications [3940]. In terms of the SDSCA, a 12-week intervention with the PSDCS improved the patients' behaviors, including general diet, exercise, and blood glucose testing. Those patients who showed a greater HbA1c reduction exhibited an improved SDSCA score. Collectively, it is plausible that our current PSDCS improved glycemic control by increasing the frequency of blood glucose monitoring and by improving diabetes self-care behaviors.
- No severe adverse events occurred during the study period. However, one episode of mild hypoglycemia and one episode of persistent serious hyperglycemia occurred during the study period. In previous randomized controlled studies of mobile diabetes care systems, the frequency of hypoglycemia was rare [28] or even absent [27]. Although a study performed in elderly patients with type 2 diabetes reported that minor hypoglycemia was numerically higher in the ubiquitous healthcare service group (32.2%) than in the control group (21.8%), the incidence of severe hypoglycemia was low in both groups [26].
- There are limitations in this study because of its nature as a pilot study. There was no control group with which to compare the efficacy and safety. The number of participants was small, and the study period was short. In addition, the number of patients in each subgroup was too small and unevenly distributed. In particular, the number of patients using insulin (group D) was too small to test the efficacy and safety of the insulin-dosing algorithm.
- In conclusion, a 12-week study of the new smartphone-based PSDCS for patients with inadequately controlled type 2 diabetes resulted in a significant reduction of HbA1c with tolerable safety profiles. A greater HbA1c reduction was associated with better compliance and better diabetes self-care activities. The PSDCS may be used as an efficacious tool for managing patients with type 2 diabetes. Based on the results of this pilot study, a randomized controlled trial is in preparation, with an upgraded version of the PSDCS, to confirm the therapeutic efficacy and safety.
DISCUSSION
-
Acknowledgements
- We thank Dr. Jung Hun Ohn and Yoon Ji Kim for their support in the development of the study protocol.
ACKNOWLEDGMENTS
-
CONFLICTS OF INTEREST: This study was sponsored by Health Connect Co. Ltd. S.B. and S.L.L. are employees of Health Connect Co. Ltd.
NOTES
- 1. Cho NH, Whiting D, Guariguata L, Montoya PA, Forouhi N, Hambleton I, Li R, Majeed A, Mbanya JC, Motala A, Narayan KM, Ramachandran A, Rathmann W, Roglic G, Shaw J, Silink M, Williams DR, Zhang P. IDF diabetes atlas. 6th ed. Brussels: International Diabetes Federation; 2013.
- 2. Bartlett EE. Historical glimpses of patient education in the United States. Patient Educ Couns 1986;8:135-149. ArticlePubMed
- 3. Norris SL, Engelgau MM, Narayan KM. Effectiveness of self-management training in type 2 diabetes: a systematic review of randomized controlled trials. Diabetes Care 2001;24:561-587. PubMed
- 4. Cleveringa FG, Gorter KJ, van den Donk M, van Gijsel J, Rutten GE. Computerized decision support systems in primary care for type 2 diabetes patients only improve patients' outcomes when combined with feedback on performance and case management: a systematic review. Diabetes Technol Ther 2013;15:180-192. ArticlePubMed
- 5. Pal K, Eastwood SV, Michie S, Farmer A, Barnard ML, Peacock R, Wood B, Edwards P, Murray E. Computer-based interventions to improve self-management in adults with type 2 diabetes: a systematic review and meta-analysis. Diabetes Care 2014;37:1759-1766. ArticlePubMedPDF
- 6. Saffari M, Ghanizadeh G, Koenig HG. Health education via mobile text messaging for glycemic control in adults with type 2 diabetes: a systematic review and meta-analysis. Prim Care Diabetes 2014;8:275-285. ArticlePubMed
- 7. Hirsch IB, Goldberg HI, Ellsworth A, Evans TC, Herter CD, Ramsey SD, Mullen M, Neighbor WE, Cheadle AD. A multi-faceted intervention in support of diabetes treatment guidelines: a cont trial. Diabetes Res Clin Pract 2002;58:27-36. ArticlePubMed
- 8. Cho JH, Chang SA, Kwon HS, Choi YH, Ko SH, Moon SD, Yoo SJ, Song KH, Son HS, Kim HS, Lee WC, Cha BY, Son HY, Yoon KH. Long-term effect of the Internet-based glucose monitoring system on HbA1c reduction and glucose stability: a 30-month follow-up study for diabetes management with a ubiquitous medical care system. Diabetes Care 2006;29:2625-2631. PubMed
- 9. Bond GE, Burr R, Wolf FM, Price M, McCurry SM, Teri L. The effects of a web-based intervention on the physical outcomes associated with diabetes among adults age 60 and older: a randomized trial. Diabetes Technol Ther 2007;9:52-59. ArticlePubMed
- 10. Peterson KA, Radosevich DM, O'Connor PJ, Nyman JA, Prineas RJ, Smith SA, Arneson TJ, Corbett VA, Weinhandl JC, Lange CJ, Hannan PJ. Improving diabetes care in practice: findings from the TRANSLATE trial. Diabetes Care 2008;31:2238-2243. PubMedPMC
- 11. Ralston JD, Hirsch IB, Hoath J, Mullen M, Cheadle A, Goldberg HI. Web-based collaborative care for type 2 diabetes: a pilot randomized trial. Diabetes Care 2009;32:234-239. PubMedPMC
- 12. O'Connor PJ, Sperl-Hillen JM, Rush WA, Johnson PE, Amundson GH, Asche SE, Ekstrom HL, Gilmer TP. Impact of electronic health record clinical decision support on diabetes care: a randomized trial. Ann Fam Med 2011;9:12-21. ArticlePubMedPMC
- 13. Ilag LL, Martin CL, Tabaei BP, Isaman DJ, Burke R, Greene DA, Herman WH. Improving diabetes processes of care in managed care. Diabetes Care 2003;26:2722-2727. ArticlePubMedPDF
- 14. Meigs JB, Cagliero E, Dubey A, Murphy-Sheehy P, Gildesgame C, Chueh H, Barry MJ, Singer DE, Nathan DM. A controlled trial of web-based diabetes disease management: the MGH diabetes primary care improvement project. Diabetes Care 2003;26:750-757. PubMed
- 15. Glasgow RE, Nutting PA, King DK, Nelson CC, Cutter G, Gaglio B, Rahm AK, Whitesides H. Randomized effectiveness trial of a computer-assisted intervention to improve diabetes care. Diabetes Care 2005;28:33-39. ArticlePubMedPDF
- 16. Sequist TD, Gandhi TK, Karson AS, Fiskio JM, Bugbee D, Sperling M, Cook EF, Orav EJ, Fairchild DG, Bates DW. A randomized trial of electronic clinical reminders to improve quality of care for diabetes and coronary artery disease. J Am Med Inform Assoc 2005;12:431-437. ArticlePubMedPMC
- 17. Ziemer DC, Doyle JP, Barnes CS, Branch WT Jr, Cook CB, El-Kebbi IM, Gallina DL, Kolm P, Rhee MK, Phillips LS. An intervention to overcome clinical inertia and improve diabetes mellitus control in a primary care setting: Improving Primary Care of African Americans with Diabetes (IPCAAD) 8. Arch Intern Med 2006;166:507-513. ArticlePubMed
- 18. Grant RW, Wald JS, Schnipper JL, Gandhi TK, Poon EG, Orav EJ, Williams DH, Volk LA, Middleton B. Practice-linked online personal health records for type 2 diabetes mellitus: a randomized controlled trial. Arch Intern Med 2008;168:1776-1782. ArticlePubMed
- 19. Maclean CD, Gagnon M, Callas P, Littenberg B. The Vermont diabetes information system: a cluster randomized trial of a population based decision support system. J Gen Intern Med 2009;24:1303-1310. ArticlePubMedPMCPDF
- 20. Holbrook A, Thabane L, Keshavjee K, Dolovich L, Bernstein B, Chan D, Troyan S, Foster G, Gerstein H. COMPETE II Investigators. Individualized electronic decision support and reminders to improve diabetes care in the community: COMPETE II randomized trial. CMAJ 2009;181:37-44. ArticlePubMedPMC
- 21. Khan S, Maclean CD, Littenberg B. The effect of the Vermont Diabetes Information System on inpatient and emergency room use: results from a randomized trial. Health Outcomes Res Med 2010;1:e61-e66. PubMedPMC
- 22. Christian JG, Bessesen DH, Byers TE, Christian KK, Goldstein MG, Bock BC. Clinic-based support to help overweight patients with type 2 diabetes increase physical activity and lose weight. Arch Intern Med 2008;168:141-146. ArticlePubMed
- 23. Leu MG, Norris TE, Hummel J, Isaac M, Brogan MW. A randomized, controlled trial of an automated wireless messaging system for diabetes. Diabetes Technol Ther 2005;7:710-718. ArticlePubMed
- 24. Lorig K, Ritter PL, Laurent DD, Plant K, Green M, Jernigan VB, Case S. Online diabetes self-management program: a randomized study. Diabetes Care 2010;33:1275-1281. PubMedPMC
- 25. Glasgow RE, Kurz D, King D, Dickman JM, Faber AJ, Halterman E, Wooley T, Toobert DJ, Strycker LA, Estabrooks PA, Osuna D, Ritzwoller D. Outcomes of minimal and moderate support versions of an internet-based diabetes self-management support program. J Gen Intern Med 2010;25:1315-1322. ArticlePubMedPMCPDF
- 26. Lim S, Kang SM, Shin H, Lee HJ, Won Yoon J, Yu SH, Kim SY, Yoo SY, Jung HS, Park KS, Ryu JO, Jang HC. Improved glycemic control without hypoglycemia in elderly diabetic patients using the ubiquitous healthcare service, a new medical information system. Diabetes Care 2011;34:308-313. ArticlePubMedPMCPDF
- 27. Quinn CC, Shardell MD, Terrin ML, Barr EA, Ballew SH, Gruber-Baldini AL. Cluster-randomized trial of a mobile phone personalized behavioral intervention for blood glucose control. Diabetes Care 2011;34:1934-1942. ArticlePubMedPMCPDF
- 28. Yoo HJ, Park MS, Kim TN, Yang SJ, Cho GJ, Hwang TG, Baik SH, Choi DS, Park GH, Choi KM. A ubiquitous chronic disease care system using cellular phones and the internet. Diabet Med 2009;26:628-635. ArticlePubMed
- 29. Liu CT, Yeh YT, Lee TI, Li YC. Observations on online services for diabetes management. Diabetes Care 2005;28:2807-2808. ArticlePDF
- 30. Yoon KH, Kim HS. A short message service by cellular phone in type 2 diabetic patients for 12 months. Diabetes Res Clin Pract 2008;79:256-261. ArticlePubMed
- 31. Hussein WI, Hasan K, Jaradat AA. Effectiveness of mobile phone short message service on diabetes mellitus management; the SMS-DM study. Diabetes Res Clin Pract 2011;94:e24-e26. ArticlePubMed
- 32. eMarketer: Worldwide smartphone usage to grow 25% in 2014 updated 2014 Jun 11. Available from: http://www.emarketer.com/Article/Worldwide-Smartphone-Usage-Grow-25-2014/1010920.
- 33. El-Gayar O, Timsina P, Nawar N, Eid W. Mobile applications for diabetes self-management: status and potential. J Diabetes Sci Technol 2013;7:247-262. ArticlePubMedPMCPDF
- 34. International Diabetes Federation Guideline Development Group. Global guideline for type 2 diabetes. Diabetes Res Clin Pract 2014;104:1-52. ArticlePubMed
- 35. Ko SH, Kim SR, Kim DJ, Oh SJ, Lee HJ, Shim KH, Woo MH, Kim JY, Kim NH, Kim JT, Kim CH, Kim HJ, Jeong IK, Hong EK, Cho JH, Mok JO, Yoon KH. Committee of Clinical Practice Guidelines, Korean Diabetes Association. 2011 Clinical practice guidelines for type 2 diabetes in Korea. Diabetes Metab J 2011;35:431-436. ArticlePubMedPMC
- 36. Toobert DJ, Hampson SE, Glasgow RE. The summary of diabetes self-care activities measure: results from 7 studies and a revised scale. Diabetes Care 2000;23:943-950. ArticlePubMedPDF
- 37. American Diabetes Association. Standards of medical care in diabetes: 2014. Diabetes Care 2014;37(Suppl 1):S14-S80. ArticlePubMedPDF
- 38. Kirkman MS, Briscoe VJ, Clark N, Florez H, Haas LB, Halter JB, Huang ES, Korytkowski MT, Munshi MN, Odegard PS, Pratley RE, Swift CS. Diabetes in older adults. Diabetes Care 2012;35:2650-2664. ArticlePubMedPMCPDF
- 39. Polonsky WH, Fisher L, Schikman CH, Hinnen DA, Parkin CG, Jelsovsky Z, Petersen B, Schweitzer M, Wagner RS. Structured self-monitoring of blood glucose significantly reduces A1C levels in poorly controlled, noninsulin-treated type 2 diabetes: results from the Structured Testing Program study. Diabetes Care 2011;34:262-267. PubMedPMC
- 40. Karter AJ, Ackerson LM, Darbinian JA, D'Agostino RB Jr, Ferrara A, Liu J, Selby JV. Self-monitoring of blood glucose levels and glycemic control: the Northern California Kaiser Permanente Diabetes registry. Am J Med 2001;111:1-9. ArticlePubMed
REFERENCES
Change in glycosylated hemoglobin (HbA1c) and fasting plasma glucose after 12 weeks of intervention. (A, C) Mean values of HbA1c and fasting plasma glucose levels, respectively. (B, D) Individual data of HbA1c and fasting plasma glucose levels, respectively. aP<0.001, bP<0.01.
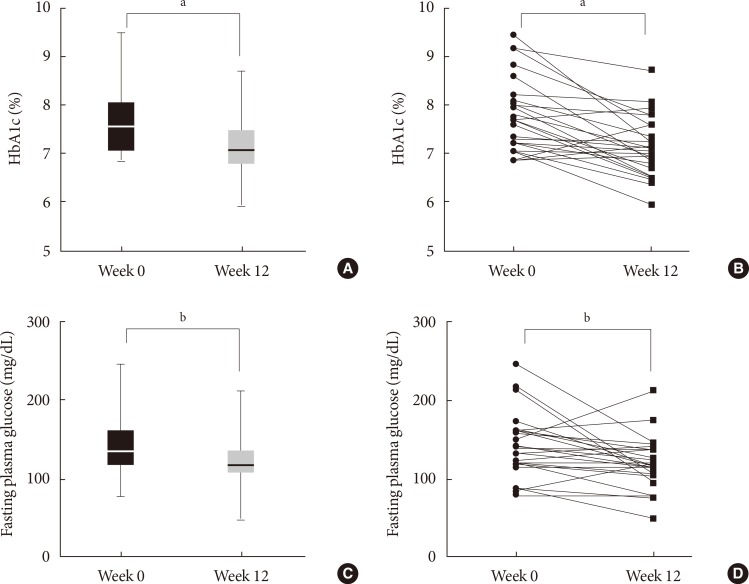
Factors correlated with glycosylated hemoglobin (HbA1c) reduction. Baseline HbA1c and the average number of daily glucometer input showed linear correlation to HbA1c reduction (A, B). HbA1c significantly decreased in the patients whose glucometer input frequency was minimal once a day (C) but did not decrease in the patients whose glucometer input frequency was less than once a day (D). aP<0.001.

Changes in the summary of diabetes self-care activities (SDSCA) score after 12 weeks of intervention. (A) Overall change and (B, C) change in the SDSCA scores according to the average number of daily glucometer inputs (upper tertile vs. lower tertile, respectively). (D, E) Change in the SDSCA scores according to the magnitude of glycosylated hemoglobin reduction (upper tertile vs. lower tertile, respectively). aP<0.001, bP<0.01, cP<0.05.
Baseline characteristics and change in parameters after 12 weeks
Figure & Data
References
Citations
- Telehealth Technologies in Diabetes Self-management and Education
Vidya Sharma, Marie Feldman, Ramaswamy Sharma
Journal of Diabetes Science and Technology.2024; 18(1): 148. CrossRef - App Design Features Important for Diabetes Self-management as Determined by the Self-Determination Theory on Motivation: Content Analysis of Survey Responses From Adults Requiring Insulin Therapy
Helen N C Fu, Jean F Wyman, Cynthia J Peden-McAlpine, Claire Burke Draucker, Titus Schleyer, Terrence J Adam
JMIR Diabetes.2023; 8: e38592. CrossRef - The Clinical Impact of Flash Glucose Monitoring—a Digital Health App and Smartwatch Technology in Patients With Type 2 Diabetes: Scoping Review
Sergio Diez Alvarez, Antoni Fellas, Derek Santos, Dean Sculley, Katie Wynne, Shamasunder Acharya, Pooshan Navathe, Xavier Girones, Andrea Coda
JMIR Diabetes.2023; 8: e42389. CrossRef - User Retention and Engagement in the Digital-Based Diabetes Education and Self-Management for Ongoing and Newly Diagnosed (myDESMOND) Program: Descriptive Longitudinal Study
Mary M Barker, Radhika Chauhan, Melanie J Davies, Christopher Brough, Alison Northern, Bernie Stribling, Sally Schreder, Kamlesh Khunti, Michelle Hadjiconstantinou
JMIR Diabetes.2023; 8: e44943. CrossRef - New Digital Health Technologies for Insulin Initiation and Optimization for People With Type 2 Diabetes
David Kerr, Steven Edelman, Giacomo Vespasiani, Kamlesh Khunti
Endocrine Practice.2022; 28(8): 811. CrossRef - Effects of Patient-Driven Lifestyle Modification Using Intermittently Scanned Continuous Glucose Monitoring in Patients With Type 2 Diabetes: Results From the Randomized Open-label PDF Study
Hun Jee Choe, Eun-Jung Rhee, Jong Chul Won, Kyong Soo Park, Won-Young Lee, Young Min Cho
Diabetes Care.2022; 45(10): 2224. CrossRef - Assessing the Acceptability and Effectiveness of Mobile-Based Physical Activity Interventions for Midlife Women During Menopause: Systematic Review of the Literature
Ghada AlSwayied, Haoyue Guo, Tasmin Rookes, Rachael Frost, Fiona L Hamilton
JMIR mHealth and uHealth.2022; 10(12): e40271. CrossRef - Application of the National Institute for Health and Care Excellence Evidence Standards Framework for Digital Health Technologies in Assessing Mobile-Delivered Technologies for the Self-Management of Type 2 Diabetes Mellitus: Scoping Review
Jessica R Forsyth, Hannah Chase, Nia W Roberts, Laura C Armitage, Andrew J Farmer
JMIR Diabetes.2021; 6(1): e23687. CrossRef - Mobile Healthcare System Provided by Primary Care Physicians Improves Quality of Diabetes Care
Tae Jung Oh, Jie-Eun Lee, Seok Kim, Sooyoung Yoo, Hak Chul Jang
CardioMetabolic Syndrome Journal.2021; 1(1): 88. CrossRef - Self-Care IoT Platform for Diabetic Mellitus
Jai-Chang Park, Seongbeom Kim, Je-Hoon Lee
Applied Sciences.2021; 11(5): 2006. CrossRef - Diabetes clinic reinvented: will technology change the future of diabetes care?
Marwa Al-Badri, Osama Hamdy
Therapeutic Advances in Endocrinology and Metabolism.2021; 12: 204201882199536. CrossRef - Analysis of Effectiveness and Psychological Techniques Implemented in mHealth Solutions for Middle-Aged and Elderly Adults with Type 2 Diabetes: A Narrative Review of the Literature
Julia Vázquez-de Sebastián, Andreea Ciudin, Carmina Castellano-Tejedor
Journal of Clinical Medicine.2021; 10(12): 2701. CrossRef - Therapeutic Exercise Platform for Type-2 Diabetic Mellitus
Je-Hoon Lee, Jai-Chang Park, Seong-Beom Kim
Electronics.2021; 10(15): 1820. CrossRef - Accuracy comparison study of new smartphone-based semen analyzer versus laboratory sperm quality analyzer
Min Jung Park, Mi Young Lim, Hyun Jun Park, Nam Cheol Park
Investigative and Clinical Urology.2021; 62(6): 672. CrossRef - User Retention and Engagement With a Mobile App Intervention to Support Self-Management in Australians With Type 1 or Type 2 Diabetes (My Care Hub): Mixed Methods Study
Mary D Adu, Usman H Malabu, Aduli EO Malau-Aduli, Aaron Drovandi, Bunmi S Malau-Aduli
JMIR mHealth and uHealth.2020; 8(6): e17802. CrossRef - The role of telehealth counselling with mobile self-monitoring on blood pressure reduction among overseas Koreans with high blood pressure in Vietnam
Hyang Yuol Lee, Ju Young Kim, Ki Young Na, Hwa Yeon Park, Jinah Han, Yuliya Pak, Bola Nam, Chae Hyun Pae, Jisun Lee, Tae Ho Lim, Donghun Lee
Journal of Telemedicine and Telecare.2019; 25(4): 241. CrossRef - The Effect of a Smartphone-Based, Patient-Centered Diabetes Care System in Patients With Type 2 Diabetes: A Randomized, Controlled Trial for 24 Weeks
Eun Ky Kim, Soo Heon Kwak, Hye Seung Jung, Bo Kyung Koo, Min Kyong Moon, Soo Lim, Hak Chul Jang, Kyong Soo Park, Young Min Cho
Diabetes Care.2019; 42(1): 3. CrossRef - Patient-Driven Diabetes Care of the Future in the Technology Era
Sahar Ashrafzadeh, Osama Hamdy
Cell Metabolism.2019; 29(3): 564. CrossRef - Peripartum Management of Gestational Diabetes Using a Digital Health Care Service: A Pilot, Randomized Controlled Study
Ji-Hee Sung, Da Young Lee, Kyoung Pil Min, Cheol-Young Park
Clinical Therapeutics.2019; 41(11): 2426. CrossRef - The Effects of Dietary Mobile Apps on Nutritional Outcomes in Adults with Chronic Diseases: A Systematic Review and Meta-Analysis
Cosette Fakih El Khoury, Mirey Karavetian, Ruud J.G. Halfens, Rik Crutzen, Lama Khoja, Jos M.G.A. Schols
Journal of the Academy of Nutrition and Dietetics.2019; 119(4): 626. CrossRef - Diabetes Mellitus m-Health Applications: A Systematic Review of Features and Fundamentals
Ericles Andrei Bellei, Daiana Biduski, Nathália Pinto Cechetti, Ana Carolina Bertoletti De Marchi
Telemedicine and e-Health.2018; 24(11): 839. CrossRef - Multifunctional Wearable System that Integrates Sweat‐Based Sensing and Vital‐Sign Monitoring to Estimate Pre‐/Post‐Exercise Glucose Levels
Yongseok Joseph Hong, Hyunjae Lee, Jaemin Kim, Minha Lee, Hyung Jin Choi, Taeghwan Hyeon, Dae‐Hyeong Kim
Advanced Functional Materials.2018;[Epub] CrossRef - Smart Devices for Older Adults Managing Chronic Disease: A Scoping Review
Ben YB Kim, Joon Lee
JMIR mHealth and uHealth.2017; 5(5): e69. CrossRef - Usability and clinical efficacy of diabetes mobile applications for adults with type 2 diabetes: A systematic review
Helen Fu, Siobhan K. McMahon, Cynthia R. Gross, Terrence J. Adam, Jean F. Wyman
Diabetes Research and Clinical Practice.2017; 131: 70. CrossRef - Novel device for male infertility screening with single-ball lens microscope and smartphone
Yoshitomo Kobori, Peter Pfanner, Gail S. Prins, Craig Niederberger
Fertility and Sterility.2016; 106(3): 574. CrossRef
 PubReader
 Cite
Cite


