- Current
- Browse
- Collections
-
For contributors
- For Authors
- Instructions to authors
- Article processing charge
- e-submission
- For Reviewers
- Instructions for reviewers
- How to become a reviewer
- Best reviewers
- For Readers
- Readership
- Subscription
- Permission guidelines
- About
- Editorial policy
Articles
- Page Path
- HOME > Diabetes Metab J > Volume 35(5); 2011 > Article
-
Original ArticleProtective Effect of Heme Oxygenase-1 on High Glucose-Induced Pancreatic β-Cell Injury
- Eun-Mi Lee, Young-Eun Lee, Esder Lee, Gyeong Ryul Ryu, Seung-Hyun Ko, Sung-Dae Moon, Ki-Ho Song, Yu-Bae Ahn
-
Diabetes & Metabolism Journal 2011;35(5):469-479.
DOI: https://doi.org/10.4093/dmj.2011.35.5.469
Published online: October 31, 2011
Division of Endocrinology and Metabolism, Department of Internal Medicine, The Catholic University of Korea College of Medicine, Seoul, Korea.
- Corresponding author: Yu-Bae Ahn. Division of Endocrinology and Metabolism, Department of Internal Medicine, St. Vincent's Hospital, The Catholic University of Korea College of Medicine, 93 Ji-dong, Paldal-gu, Suwon 442-723, Korea. ybahn@catholic.ac.kr
• Received: August 30, 2011 • Accepted: October 19, 2011
Copyright © 2011 Korean Diabetes Association
This is an Open Access article distributed under the terms of the Creative Commons Attribution Non-Commercial License (http://creativecommons.org/licenses/by-nc/3.0/) which permits unrestricted non-commercial use, distribution, and reproduction in any medium, provided the original work is properly cited.
ABSTRACT
-
Background
- Glucose toxicity that is caused by chronic exposure to a high glucose concentration leads to islet dysfunction and induces apoptosis in pancreatic β-cells. Heme oxygenase-1 (HO-1) has been identified as an anti-apoptotic and cytoprotective gene. The purpose of this study is to investigate whether HO-1 up-regulation when using metalloprotophyrin (cobalt protoporphyrin, CoPP) could protect pancreatic β-cells from high glucose-induced apoptosis.
-
Methods
- Reverse transcription-polymerase chain reaction was performed to analyze the CoPP-induced mRNA expression of HO-1. Cell viability of INS-1 cells cultured in the presence of CoPP was examined by acridine orange/propidium iodide staining. The generation of intracellular reactive oxygen species (ROS) was measured using flow cytometry. Glucose stimulated insulin secretion (GSIS) was determined following incubation with CoPP in different glucose concentrations.
-
Results
- CoPP increased HO-1 mRNA expression in both a dose- and time-dependent manner. Overexpression of HO-1 inhibited caspase-3, and the number of dead cells in the presence of CoPP was significantly decreased when exposed to high glucose conditions (HG). CoPP also decreased the generation of intracellular ROS by 50% during 72 hours of culture with HG. However, decreased GSIS was not recovered even in the presence of CoPP.
-
Conclusion
- Our data suggest that CoPP-induced HO-1 up-regulation results in protection from high glucose-induced apoptosis in INS-1 cells; however, glucose stimulated insulin secretion is not restored.
- Type 2 diabetes is a chronic metabolic disorder, and its pathogenesis is characterized by insulin resistance and β-cell dysfunction [1]. Recently, there has been growing evidence that a functional defect of β-cells may be central to the development and progression of type 2 diabetes [2]. Pancreatic β-cells play a key role in maintaining normal glucose metabolism through adequate insulin secretion in response to hyperglycemia [3,4]. Glucose metabolism is normally maintained by oxidative phosphorylation; however, chronic exposure to elevated glucose concentrations can cause glucotoxicity that causes irreversible cellular damage, which then results in decreased β-cell mass and increased apoptosis. Glucotoxicity decreases insulin mRNA expression in β-cells, and one explanation for this is due to a marked reduction in posttranscriptional PDX-1 processing. Decreased pancreatic and duodenal homeobox-1 (PDX-1) expression results in diminished insulin content and impairment of glucose stimulated insulin secretion (GSIS). The adverse effect of glucose toxicity that is mediated at least in part by generation of reactive oxygen species (ROS) also impairs insulin gene expression that is associated with β-cell function.
- ROS are known to cause cellular damage by oxidizing nucleic acid and are also involved in the activation of genes that are associated with the mechanisms of cell defense [5]. Previous studies have demonstrated that high glucose can increase the accumulation of intracellular ROS that results in oxidative stress to the β-cells. However, the amount of antioxidant enzyme needed to catabolize ROS in islets is very low compared to levels in other tissues [6,7]. A number of studies have reported that the overexpression of antioxidant genes helps to protect β-cells against oxidative stress [8-10].
- Heme oxygenase-1 (HO-1) is a rate limiting enzyme in the heme degradative pathway and is up-regulated by various stimulants, such as oxidative stress, inflammation, and endotoxin [11-13]. HO-1 has several biological effects on antioxidant, anti-inflammatory and immune regulatory functions during times of cellular stress. Induction of HO-1 in islets results in protection from the detrimental effect that is mediated by cytokines [14]. Cobalt protoporphyrin (CoPP), a substrate of HO-1, is known to increase HO-1 expression and activity. Although several studies have indicated CoPP as a potent HO-1 inducer, the effect of CoPP on INS-1 cells exposed to a high glucose condition has not been determined.
- We investigated whether HO-1 up-regulation by CoPP protects INS-1 cells from hyperglycemia when induced by oxidative stress.
INTRODUCTION
- Cell cultures and treatment
- INS-1 cells were cultured in RPMI 1,640 medium (Sigma, St. Louis, MO, USA) containing 11.1 mM glucose, 10% fetal bovine serum (FBS; Hyclone, Logan, UT, USA), 2 mM L-glutamine (Gibco BRL, Grand Island, NY, USA), 100 U/mL penicillin, 100 µg/mL streptomycin, and 250 ng/mL amphotericin B (WelGENE, Daegu, Korea). The cells were cultured in a humidified atmosphere containing 5% CO2 at 37℃. All of the studies were performed on INS-1 cells that were between the 21st and 29th passages.
- After serum starvation with 60% of confluency for 12 hours, the INS-1 cells were incubated for either 24 hours or 72 hours with mannitol and at a low glucose (LG; 5.5 mM) or high glucose (HG; 27.7 mM) concentration, respectively. INS-1 cells were incubated with 500 nM of CoPP (Sigma, St. Louis, MO, USA) for 4 hours to induce HO-1.
- Semi-quantitative reverse transcription-polymerase chain reaction (RT-PCR) analysis
- The TRIZOL reagent (Invitrogen, Carsbad, CA, USA) was used to isolate the RNA from treated INS-1 cells. RNA was extracted with BCP (1-bromo-3-chloropropane; Molecular Research Center, Cincinnati, OH, USA) followed by centrifugation to separate the sample into aqueous and organic phases. RNA was recovered from the aqueous phase by an isopropyl alcohol precipitation and then suspended in diethylpyrocarbonate (DEPC)-treated water. After quantification by spectrophotometer (UV/VIS Spectrophotometer ND-1000; Nanodrop, Silmington, DE, USA), 2 µg of RNA was subjected to 85℃ for 3 minutes prior to the addition of 5X First-Strand buffer (Invitrogen), 0.1 M dTT (Invitrogen), 50 µg/µL Random hexamer (Invitrogen), 10 mM dNTP (Invitrogen), RNaseOUT™ (40 U/µL, Invitorogen), and SuperScrip™ II Reverse Transcriptase (200 U/µL, Invitrogen). Reverse transcription (RT) reactions were 10 minutes at 25℃, 60 minutes at 42℃, and 10 minutes at 95℃. The resulting cDNA products were stored at -70℃.
- The PCR reaction that was designed to amplify the cDNA fragments (Promega, Madison, WI, USA) contained 1 µL of each forward and reverse primer (10 pM), 6 µL of DEPC water, and 2 µL of cDNA template. Oligonucleotide primers for HO-1 (forward: 5'-TCAAGCACAGGGTGACA-3'; reverse: 5'-CATAAATTCCCACTGCCACG-3') and cyclophilin (forward: 5'-AACCCCACCGTGTTCTTC-3'; reverse: 5'-TGCCTTCTTTCACCTTCCC-3') were used. The PCR products were separated by electrophoresis on 2% agarose gel, visualized by ethidium bromide staining under ultraviolet light, and analyzed with the Quantity One program (Bio-Rad, Hercules, CA, USA). The gene expression level of the cyclophilin was used to quantify the expression of a housekeeping gene.
- Cytotoxicity assay
- Highly sensitive water soluble tetrazolium salt (WST) was used as an indicator of cell viability as determined by mitochondrion-dependent reduction to formazane. A total of 5×10⁵ INS-1 cells were seeded into each well of a 96-well plate. The medium was then replaced with 100 µL of fresh culture medium that was then treated for 3 hours at 37℃ and that contained 5% CO2 in the presence of 10 µL of CCk-8 solution (Cell counting kit-8; Dojindo, Kumamoto, Japan). The absorbance of the supernatant was measured at 450 nm on an automated microplate reader (Bio-Rad). The ratio of living cells was calculated by measuring the absorbance of the supernatant at each concentration divided by that of the control.
- Acridine orange (AO)/propidium iodide (PI) staining
- For AO/PI staining, the cells were seeded at 1×10⁶ cells/well into a 6-well plate that was then treated with another glucose concentration and 500 nM CoPP for 24 hours and 72 hours, respectively. Afterward, the PBS-treated cells were then stained with both AO (100 µg/mL) and PI (500 µg/mL) at a 1:1 dilution and treated with 1 µL/mL. Cells were visualized using a fluorescence microscope (Zeiss, Oberkochen, Germany). The cell death rate of the β-cells according to the PI staining was calculated relative to the percentage of all cells.
- Hydrogen peroxide measurement
- The INS-1 cells were labeled with 10 µM chloromethy-2',7'-dichlorofluorescein diacetate (CM-H2DCFDA; Molecular Probes, Carlsbad, CA, USA) for 30 minutes at 37℃. After 3 PBS washes, the cells were then harvested after incubation with trypsin-EDTA (Gibco BRL) for 1 minute at 37℃, followed by centrifugation at 1,200 rpm for 5 minutes. The cells were washed twice with PBS, resuspended in PBS, and 1 µg/mL of propidium iodide was added. The cells were analyzed using a flow cytometer. A fluorescence microscope was used to observe the ROS. The cells were labeled with 10 µM carboxy-H2DCFDA and washed 3 times with PBS. This was followed by the addition of 1 µg/mL propidium iodide and incubated for 10 minutes. Cells were visualized using a fluorescence microscope (Zeiss).
- Western blotting analysis
- INS-1 cells were collected in lysis buffer (25 mM Tris-HCl, pH 7.4, 0.1% SDS, 0.1% Triton X-100, 1% sodium deoxycholate, 150 mM NaCl, 1 mM EDTA, 1 mM Na3VO4, 1 mM PMSF, 10 µg/mL aprotinin, and 5 µg/mL leucopeptin) on ice and centrifuged at 13,000 rpm for 30 minutes. The protein concentrations were then determined using the Bradford method. Total cell protein (30 µg) was separated using either 10% or 12% sodium dodecyl sulfate-polyacrylamide gel electrophoresis (SDS-PAGE) and were then transferred to nitrocellulose membranes. Membranes were blocked with 5% skim milk (BD Bioscience, San Diego, CA, USA) in Tris buffered saline containing 0.05% Tween 20 (TBST) for 1 hour at room temperature. The cells were then incubated with the assigned primary antibody, HO-1 (1:2,000; Stressgen, Victoria, Canada), caspase-3 (1:200; Santa Cruz Biotechnology, Santa Cruz, CA, USA), and β-actin (1:5,000; Abcam, Cambridge, MA, USA), which were all diluted in TBST containing 5% skim milk overnight at 4℃. The membrane was washed three times with TBST for 8 minutes each and incubated with a goat anti-rabbit HRP-conjugated antibody and anti-mouse antibody (1:3,000; Pierce Biotechnology, Rockford, IL, USA) in TBST containing 5% BSA for 1 hour at room temperature. After washing, an X-ray of the membrane was developed using an ECL detection kit (GE Healthcare, Milwaukee, WI, USA).
- Detection of apoptotic cells
- Apoptotic cells were detected using the TUNEL (Tdt-mediated dUTR nick-end labeling) technique. Following either the glucose or the CoPP treatment, cells were washed with PBS and fixed in 4% paraformaldehyde in PBS for 1 hour at room temperature. After washing, the cells were incubated in permeabilization solution for 2 minutes on ice. The cells were labeled according to the instructions provided by the manufacturer of the TUNEL assay (Roche, Mannheim, Germany). The TUNEL-positive cells were visualized using confocal microscopy (Zeiss).
- GSIS
- Treated INS-1 cells were incubated for 2 hours in 2 concentrations of Krebs-Ringer buffer (KRB) that contained 5.5 mM and 25 mM concentrations. After the incubation, the supernatants were obtained and frozen at -70℃ prior to the determination of insulin secretion. The insulin secretion of the Krebs-Ringer buffer samples was measured using a radioimmunoassay kit (Linco Research Immunoassay, St. Charles, MO, USA).
- Statistical analysis
- The experimental results are presented as mean±standard error. Statistical analysis was performed using SPSS version 11.5 (SPSS Inc., Chicago, IL, USA). An independent sample t-test was used to compare the mean values of the continuous variables between the two groups. One-way ANOVA with a Fisher's post hoc analysis was used for the comparison of data among the experimental groups. P values of less than 0.05 were considered to be statistically significant.
METHODS
- The optimal concentration and incubation time for CoPP
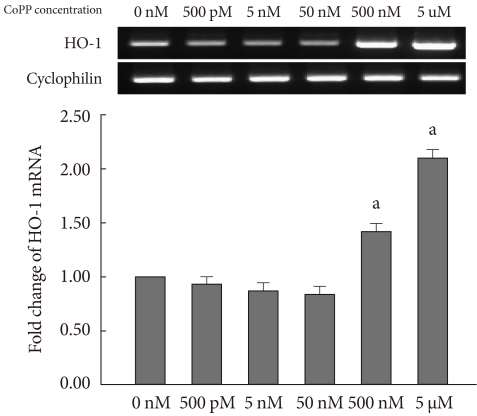
- The expression of HO-1 mRNA was measured in INS-1 cells at varying concentrations of CoPP (0 nM, 500 pM, 5 nM, 50 nM, 500 nM, 5 µM) using semi-quantitative RT-PCR. HO-1 mRNA was increased in a dose-dependent manner (Fig. 1). It was determined that 500 nM of CoPP was the optimal concentration for the experiment. The treated INS-1 cells were then incubated with 500 nM of CoPP for 1, 2, 4, 6, and 24 hours, respectively. In the presence of 500 nM of CoPP, the expression of the HO-1 mRNA was observed to increase in a time-dependent manner throughout the 24 hour period (Fig. 2).
- Effect of CoPP on the INS-1 cell death rate by HG
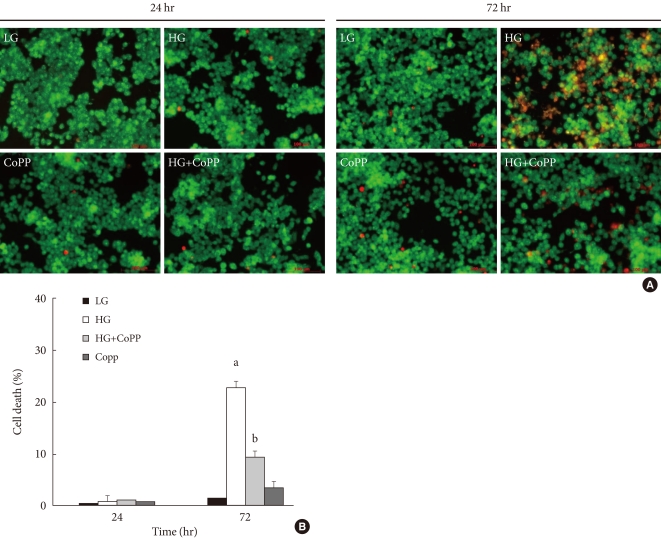
- We examined the cell protective effect of CoPP on INS-1 cells using a cytotoxicity assay. The cell viability was measured at varying concentrations of CoPP (0 nM, 500 pM, 5nM, 50nM, 500 nM, 5 µM, 50 µM). A significant diminishment of cell viability was observed at 5 µM and at 50 µM, and we found that maximum cell viability occurred at a concentration of 500 nM (Fig. 3). Subsequently we observed the cell death with AO/PI staining at LG and HG conditions in the presence or absence of CoPP. Cell death rate significantly increased under HG conditions compared with that of LG conditions (Fig. 4). Treatment of INS-1 cells with CoPP decreased cell death by approximately 50% after 72 hours (Fig. 5).
- Generation of ROS at different glucose concentrations
- To observe the effect of CoPP on the generation of ROS in INS-1 cells exposed to HG, we measured ROS using flow cytometry with carboxy-H2DCFDA. The INS-1 cells were treated with carboxy-H2DCFDA in 6-well plates and were observed by fluorescence microscopy. The INS-1 cells that were cultured for either 24 hours or 72 hours in HG had higher fluorescence intensity than that in the cells cultured in the LG condition. Fluorescence intensity also decreased significantly after 72 hours in the presence of CoPP (Fig. 6A). However, there was no difference at 24 hours regardless of CoPP. Through fluorescence microscopy, we found that increased ROS generation was observed at the HG condition at 72 hours. CoPP treatment was found to decrease ROS generation (Fig. 6B).
- Changes in HO-1 and caspase-3 cleavage protein expression by HG
- The expression levels of HO-1 and caspase-3 cleavage were also studied in INS-1 cells that were incubated for different durations of time and glucose concentrations with or without CoPP. The induction of HO-1 protein expression was clearly detected in INS-1 cells treated with CoPP independent of the culture time (Fig. 7A).
- We did not find any differences in caspase-3 protein level among the groups with different glucose concentrations at 24 hours. However, incubation of INS-1 cells in HG for 72 hours significantly increased the expression of caspase-3. Treatment with CoPP significantly decreased the caspase-3 level by 50%, which indicates that CoPP ameliorates the HG-induced apoptosis in INS-1 cells (Fig. 7B).
- We also performed the TUNEL assay in order to observe INS-1 cell apoptosis under different culture conditions. Higher numbers of TUNEL-positive cells were found in INS-1 cells that were incubated in HG conditions for 72 hours. CoPP decreases the number of apoptotic cells in INS-1 cells incubated in HG conditions (Fig. 7C).
- GSIS in INS-1 cells
- GSIS was performed in INS-1 cells after a 24- or 72-hour culture period with different glucose concentrations, respectively. At 24 hours of culture, the GSIS level showed no significant difference among the groups, which indicates no effect of HG on insulin secretion until 24 hours. However, at 72 hours, the insulin secretion in the HG condition had significantly decreased compared to that of the LG condition. Moreover, GSIS was not restored even in the presence of CoPP (Fig. 8).
RESULTS
- In this study, we found that the over-expression of HO-1 by CoPP resulted in the protection of INS-1 cells from HG-induced oxidative stress and apoptotic cell death.
- It is well established that chronic hyperglycemia in patients with type 2 diabetes mellitus causes progressive deterioration of β-cell function. In the present study, we investigated the effect of HO-1 over-expression on β-cells that are exposed to high levels of glucose. We incubated INS-1 cells in a normal glucose condition for 48 hours, which did not result in cell death, as previously reported [15]. However, 72 hour exposure of INS-1 cells to HG media did increase the number of dead cells. HG in vitro is supposed to have a role in apoptosis induced by cytokines; however, it is of interest that our finding showed no difference in cytokine levels regardless of the glucose concentration of the culture media (data not shown). Our finding is not consistent with that of a previous study [16], but this can be explained by differences in the cell type, time course, and glucose concentrations that were used in cell culture.
- Various studies have explored the mechanism by which chronic elevation of glucose causes damage to β-cells. The oxidative stress that occurs in response to chronic exposure to HG can directly cause β-cell damage, which is mediated by an increased intracellular accumulation of ROS. The mechanisms of β-cell damage by ROS are enhanced by oxidizing nucleic acid, proteins, and membrane lipids [17]. Moreover, it has been proposed that ROS decreases the expression of genes that are associated with β-cell function and activates stress genes, such as HO-1, glutathione peroxidase, and A20, which are all involved in cell damage as well as cell defense [4,14,18].
- The intracellular peroxide levels were detected using cytometric analysis to observe the effect of HO-1 up-regulation. Our finding that HG, rather than lower glucose level, is capable of generating more ROS in INS-1 cell lines is compatible with the findings published by Won et al. [19], which suggest that oxidative stress might be mediated by glucotoxicity. In this experiment, apoptosis was confirmed by the caspase-3 and TUNEL assay. Increased caspase-3 protein level and cell death rate in HG conditions were both decreased in parallel with the addition of CoPP. The effect of CoPP on cell protection is known to be related to the up-regulation of HO-1. HO-1 is one of the antioxidant enzymes responsible for heme degradation, which catalyzes its oxidation into biliverdin, carbon monoxide (CO) and free iron [20]. The induction of HO-1 results in partial cytokine-mediated apoptosis in the βTC3 cell line and preservation of insulin release in vitro [21]. The mechanisms of action of HO-1 can be explained by the elevated level of bilirubin, which has an antioxidant property via scavenging for ROS and the production of CO, both of which have an anti-inflammatory effect and inhibit apoptosis. In addition, cellular free iron can lead to the formation of ferritin, which has an iron detoxifying effect [22].
- Previous studies have shown that a marker for oxidative stress is elevated in an animal model of non-obese type 2 diabetes [23]. However, antioxidant enzyme expression and activity in insulin producing cells are known to be very low compared with those in other tissues [7]. Similarly, the results of our previous study, which observed gene expression in β-cell-rich tissue using laser capture microdissection, demonstrated that HO-1, an antioxidant enzyme, was not detected in endogenous islets [24].
- There is recent evidence that treatment of diabetic rats with antioxidants does protect β-cells against glucose toxicity. Antioxidants, such as NG-Methyl-l-arginine or aminoguanidine, have demonstrated recovery of insulin mRNA expression and release in HG conditions [25]. Also, over-expression of an antioxidant enzyme, such as superoxide dismutase or catalase, showed islet protection from oxidative stress in animal models [26,27].
- Previous studies have demonstrated that CoPP has a cytoprotective effect, attributed to its ability to reduce inflammation and cell damage via up-regulation of HO-1 [28]. Won et al. [19] has reported that hemin, another HO-1 inducer, increased HO-1 mRNA expression and insulin secretion was restored at high glucose condition (30 mM). In terms of insulin secretion, our finding is different from that of Won et al. [19]. However, the direct effect of metaloporphyrin on insulin secretion is not fully elucidated. In addition, the glucose concentration in culture media and incubation time with metaloporphyrin was different from those of our experiment. In the present experiment, HO-mRNA expression by CoPP increased in both a dose- and time-dependent manner. The optimal dose determined for HO-1 induction was different from that determined in another experiment, and the higher concentration of CoPP leading to cell death in our study suggests that CoPP might have direct toxic effects on cultured islets even in lower glucose conditions. HO-1 protein levels were similar regardless of the glucose concentration and culture time, but the augmented response after addition of CoPP was observed until 72 hours. This finding suggests that high glucose condition induces HO-1 induction but is not sufficient for cell protection. In terms of insulin secretion, protophophyrin has been shown to enhance insulin secretion [14] and up-regulation of HO-1 increases GSIS under high glucose conditions. GSIS in INS-1 cells cultured in a high glucose condition for 72 hours was significantly decreased compared to cells in the LG condition; in addition, it was not restored in the presence of CoPP. It is not clear whether HO-1 directly increases insulin secretion, but the insulin content was not measured in the present study. The exact mechanism by which HO-1 up-regulation preserves insulin secretion from high glucose should be the subject of future research and elucidated. In summary, these results suggest that the induction of HO-1 in response to CoPP in a β-cell line provides a protective effect against HG-induced oxidative stress; however, the glucose stimulated insulin secretory response was not restored under HG condition.
DISCUSSION
-
Acknowledgements
- This study was supported by the National Research Foundation of Korea Grant funded by the Korean government (NRF-2011-0026129).
ACKNOWLEDGMENTS
- 1. Weyer C, Bogardus C, Mott DM, Pratley RE. The natural history of insulin secretory dysfunction and insulin resistance in the pathogenesis of type 2 diabetes mellitus. J Clin Invest 1999;104:787-794. ArticlePubMedPMC
- 2. Kahn SE. The relative contributions of insulin resistance and beta-cell dysfunction to the pathophysiology of type 2 diabetes. Diabetologia 2003;46:3-19. ArticlePubMedPDF
- 3. Hou ZQ, Li HL, Gao L, Pan L, Zhao JJ, Li GW. Involvement of chronic stresses in rat islet and INS-1 cell glucotoxicity induced by intermittent high glucose. Mol Cell Endocrinol 2008;291:71-78. ArticlePubMed
- 4. Tanaka Y, Tran PO, Harmon J, Robertson RP. A role for glutathione peroxidase in protecting pancreatic beta cells against oxidative stress in a model of glucose toxicity. Proc Natl Acad Sci U S A 2002;99:12363-12368. PubMedPMC
- 5. Sumoski W, Baquerizo H, Rabinovitch A. Oxygen free radical scavengers protect rat islet cells from damage by cytokines. Diabetologia 1989;32:792-796. ArticlePubMedPDF
- 6. Busik JV, Mohr S, Grant MB. Hyperglycemia-induced reactive oxygen species toxicity to endothelial cells is dependent on paracrine mediators. Diabetes 2008;57:1952-1965. ArticlePubMedPMCPDF
- 7. Tiedge M, Lortz S, Drinkgern J, Lenzen S. Relation between antioxidant enzyme gene expression and antioxidative defense status of insulin-producing cells. Diabetes 1997;46:1733-1742. ArticlePubMed
- 8. Tiedge M, Lortz S, Munday R, Lenzen S. Protection against the co-operative toxicity of nitric oxide and oxygen free radicals by overexpression of antioxidant enzymes in bioengineered insulin-producing RINm5F cells. Diabetologia 1999;42:849-855. ArticlePubMedPDF
- 9. Hohmeier HE, Thigpen A, Tran VV, Davis R, Newgard CB. Stable expression of manganese superoxide dismutase (MnSOD) in insulinoma cells prevents IL-1beta-induced cytotoxicity and reduces nitric oxide production. J Clin Invest 1998;101:1811-1820. ArticlePubMedPMC
- 10. Moriscot C, Pattou F, Kerr-Conte J, Richard MJ, Lemarchand P, Benhamou PY. Contribution of adenoviral-mediated superoxide dismutase gene transfer to the reduction in nitric oxide-induced cytotoxicity on human islets and INS-1 insulin-secreting cells. Diabetologia 2000;43:625-631. ArticlePubMedPDF
- 11. Maines MD. The heme oxygenase system: a regulator of second messenger gases. Annu Rev Pharmacol Toxicol 1997;37:517-554. ArticlePubMed
- 12. Terry CM, Clikeman JA, Hoidal JR, Callahan KS. Effect of tumor necrosis factor-alpha and interleukin-1 alpha on heme oxygenase-1 expression in human endothelial cells. Am J Physiol 1998;274(3 Pt 2):H883-H891. PubMed
- 13. Durante W, Kroll MH, Christodoulides N, Peyton KJ, Schafer AI. Nitric oxide induces heme oxygenase-1 gene expression and carbon monoxide production in vascular smooth muscle cells. Circ Res 1997;80:557-564. ArticlePubMed
- 14. Ye J, Laychock SG. A protective role for heme oxygenase expression in pancreatic islets exposed to interleukin-1beta. Endocrinology 1998;139:4155-4163. ArticlePubMed
- 15. Piro S, Anello M, Di Pietro C, Lizzio MN, Patane G, Rabuazzo AM, Vigneri R, Purrello M, Purrello F. Chronic exposure to free fatty acids or high glucose induces apoptosis in rat pancreatic islets: possible role of oxidative stress. Metabolism 2002;51:1340-1347. ArticlePubMed
- 16. Mellado-Gil JM, Aguilar-Diosdado M. High glucose potentiates cytokine- and streptozotocin-induced apoptosis of rat islet cells: effect on apoptosis-related genes. J Endocrinol 2004;183:155-162. ArticlePubMed
- 17. Halliwell B, Gutteridge JM. Free radical in biology and medicine. 1989. 2nd ed. Oxford: Clarendon Press.
- 18. Grey ST, Arvelo MB, Hasenkamp W, Bach FH, Ferran C. A20 inhibits cytokine-induced apoptosis and nuclear factor kappaB-dependent gene activation in islets. J Exp Med 1999;190:1135-1146. PubMedPMC
- 19. Won KC, Moon JS, Eun MJ, Yoon JS, Chun KA, Cho IH, Kim YW, Lee HW. A protective role for heme oxygenase-1 in INS-1 cells and rat islets that are exposed to high glucose conditions. J Korean Med Sci 2006;21:418-424. ArticlePubMedPMC
- 20. Maines MD. Heme oxygenase: function, multiplicity, regulatory mechanisms, and clinical applications. FASEB J 1988;2:2557-2568. ArticlePubMedPDF
- 21. Pileggi A, Molano RD, Berney T, Cattan P, Vizzardelli C, Oliver R, Fraker C, Ricordi C, Pastori RL, Bach FH, Inverardi L. Heme oxygenase-1 induction in islet cells results in protection from apoptosis and improved in vivo function after transplantation. Diabetes 2001;50:1983-1991. ArticlePubMedPDF
- 22. Ferris CD, Jaffrey SR, Sawa A, Takahashi M, Brady SD, Barrow RK, Tysoe SA, Wolosker H, Baranano DE, Dore S, Poss KD, Snyder SH. Haem oxygenase-1 prevents cell death by regulating cellular iron. Nat Cell Biol 1999;1:152-157. ArticlePubMedPDF
- 23. Ihara Y, Toyokuni S, Uchida K, Odaka H, Tanaka T, Ikeda H, Hiai H, Seino Y, Yamada Y. Hyperglycemia causes oxidative stress in pancreatic beta-cells of GK rats, a model of type 2 diabetes. Diabetes 1999;48:927-932. ArticlePubMedPDF
- 24. Ahn YB, Xu G, Marselli L, Toschi E, Sharma A, Bonner-Weir S, Sgroi DC, Weir GC. Changes in gene expression in beta cells after islet isolation and transplantation using laser-capture microdissection. Diabetologia 2007;50:334-342. ArticlePubMedPDF
- 25. Tajiri Y, Moller C, Grill V. Long-term effects of aminoguanidine on insulin release and biosynthesis: evidence that the formation of advanced glycosylation end products inhibits B cell function. Endocrinology 1997;138:273-280. ArticlePubMed
- 26. Chen H, Li X, Epstein PN. MnSOD and catalase transgenes demonstrate that protection of islets from oxidative stress does not alter cytokine toxicity. Diabetes 2005;54:1437-1446. ArticlePubMedPDF
- 27. Woo J, Iyer S, Mori N, Buelow R. Alleviation of graft-versus-host disease after conditioning with cobalt-protoporphyrin, an inducer of heme oxygenase-1. Transplantation 2000;69:623-633. ArticlePubMed
- 28. Chen X, Zhang Z, Su C, Gu W, Li H, Zhou G. Protective effect of heme oxygenase-1 to pancreas islet xenograft. J Surg Res 2010;164:336-343. ArticlePubMed
REFERENCES
Fig. 1mRNA expression of heme oxygenase-1 (HO-1) in INS-1 cells after 24 hours treatment with different concentration of cobalt protoporphyrin (CoPP) (0 nM, 500 pM, 5 nM, 50 nM, 500 nM, 5 µM, 50 µM). Data are mean±standard error of the 3 separate experiments. aP<0.01 vs. control (0 nM).

Fig. 2Heme oxygenase-1 (HO-1) mRNA expression of INS-1 cells in the presence of 500 nM of cobalt protoporphyrin (CoPP) with different time course (1, 2, 4, 6, and 24 hours). Data are mean±standard error of the 3 separate experiments. aP<0.01 vs. control (0 nM).
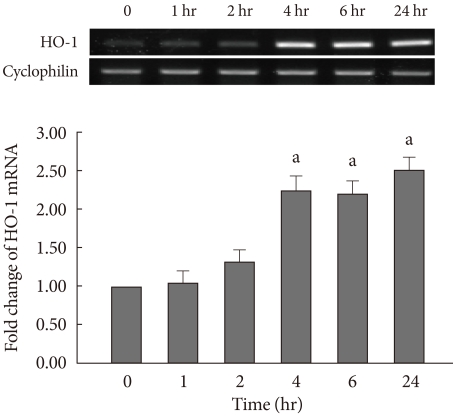
Fig. 3Cytotoxicity assay of qualifying cell death in INS-1 cells. 5×10⁵ cells/well were seeded into a 96-well plate, and each well was treated with 10 µL of CCk-8 solution (Cell counting kit-8) for 3 hours at 37℃ containing 5% CO2. Data are expressed as mean±standard error of the 3 separate experiments. aP<0.05 vs. control (0 nM).
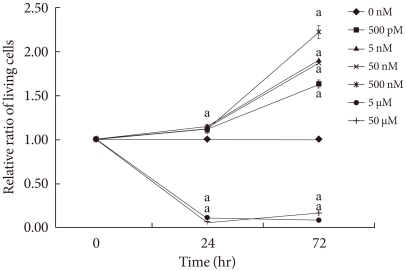
Fig. 4Cell death rate in cultured INS-1 cells according to acridine orange (AO)/propidium iodide (PI) staining. (A) AO/PI staining in the presence of mannitol, low glucose (LG; 5.5 mM/L), and high glucose (HG; 27.7 mM/L) concentrations in INS-1 cells. The red-stained cells are dead. (B) Time-dependent course of cell death rate. Image was obtained using a microscope (×200). Data are expressed as mean±standard error of the 3 separate experiments. aP<0.05 vs. LG (72 hours).

Fig. 5Effect of cobalt protoporphyrin (CoPP) on cell death rate in cultured INS-1 cells using acridine orange (AO)/propidium iodide (PI) staining. (A) AO/PI staining in the presence or absence of CoPP (500 nM) in INS-1 cells at different glucose concentrations. The red-stained cells represent dead cells. (B) Effect of CoPP on cell death rate in cultured INS-1 cells using AO/PI staining. Imaging performed with a microscope (×200). Data are expressed as mean±standard error of the three separate experiments. aP<0.05 vs. low glucose (LG), bP<0.01 vs. high glucose (HG).

Fig. 6Intracellular peroxide level in INS-1 cells using flow cytometry. (A) The amount of reactive oxygen species (ROS) was measured to observe the effect of cobalt protoporphyrin (CoPP). (B) Fluorescence microscopy of ROS staining in INS-1 cells. The green staining is DCFDA and the red staining is propidium iodide. Image obtained using a microscope (×200). Data are expressed as mean±standard error of the three separate experiments. aP<0.01 vs. low glucose (LG), bP<0.05 vs. high glucose (HG).
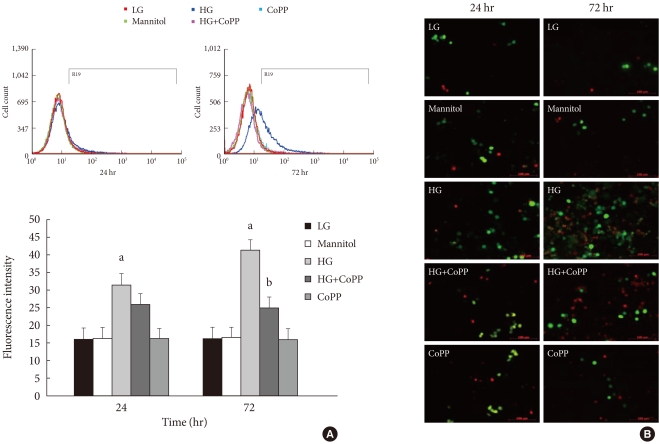
Fig. 7Effect of cobalt protoporphyrin (CoPP) on protein level was determined using a Western blot analysis. (A) The level of heme oxygenase-1 (HO-1) protein. (B) The level of caspase-3 protein. (C) Confocal microscopy for TUNEL staining in INS-1 cells at 72 hours. The green staining is TUNEL and the blue staining is DAPI. Imaging performed with a confocal microscope (×400). Data are expressed as mean±standard error for the 3 separate experiments. aP<0.05 vs. low glucose (LG), bP<0.01 vs. high glucose (HG).
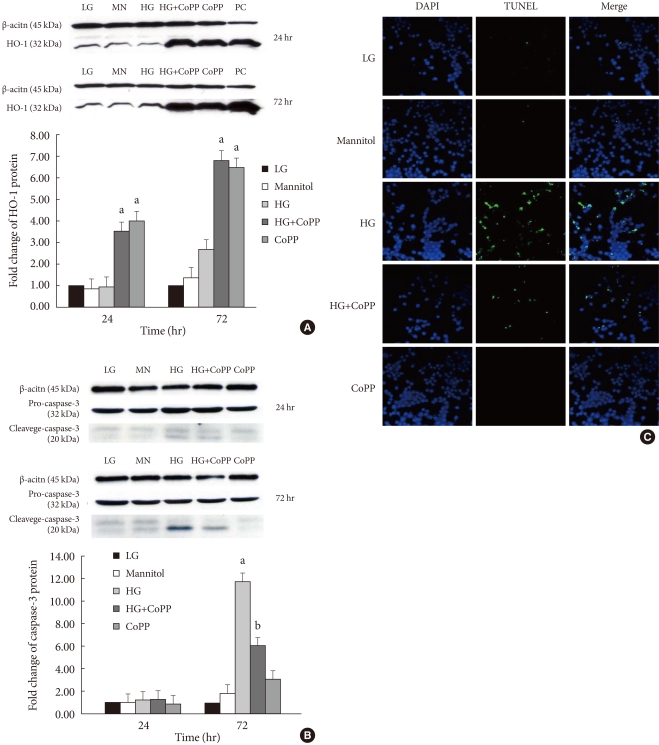
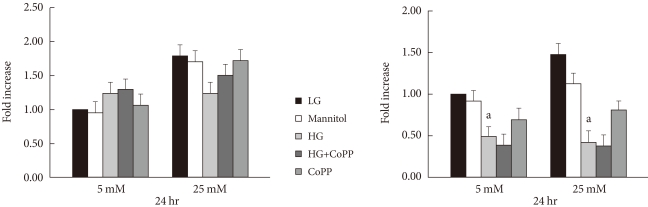
Figure & Data
References
Citations
Citations to this article as recorded by 
- Diabetes: Risk factor and translational therapeutic implications for Alzheimer's disease
Jeffrey Cummings, Andrew Ortiz, Janelle Castellino, Jefferson Kinney
European Journal of Neuroscience.2022; 56(9): 5727. CrossRef - The ischaemic preconditioning paradox and its implications for islet isolation from heart-beating and non heart-beating donors
Daniel Brandhorst, Heide Brandhorst, Samuel Acreman, Paul R. V. Johnson
Scientific Reports.2022;[Epub] CrossRef - CYTOCHROMES OF MITOCHONDRIES AND ACTIVITY OF HEME METABOLISM ENZYMES IN THE LIVER UNDER DIFFERENT NUTRIENT REGIMES
G.P. Kopylchuk, Z.-M. I. Grynenkiv, O.M. Voloshchuk
Fiziolohichnyĭ zhurnal.2021; 67(2): 37. CrossRef - Heme Oxygenase-1 (HMOX-1) and inhibitor of differentiation proteins (ID1, ID3) are key response mechanisms against iron-overload in pancreatic β-cells
Mawieh Hamad, Abdul Khader Mohammed, Mahmood Y. Hachim, Debasmita Mukhopadhy, Anila Khalique, Amina Laham, Sarah Dhaiban, Khuloud Bajbouj, Jalal Taneera
Molecular and Cellular Endocrinology.2021; 538: 111462. CrossRef - Food-derived cyanidin-3-O-glucoside alleviates oxidative stress: evidence from the islet cell line and diabetic db/db mice
Xiang Ye, Wen Chen, Pengcheng Tu, Ruoyi Jia, Yangyang Liu, Yonglu Li, Qiong Tang, Xiaodong Zheng, Qiang Chu
Food & Function.2021; 12(22): 11599. CrossRef - Telmisartan protects against high glucose/high lipid‐induced apoptosis and insulin secretion by reducing the oxidative and ER stress
Yan Wang, Jingjing Xue, Yan Li, Xin Zhou, Shun Qiao, Dewu Han
Cell Biochemistry and Function.2019; 37(3): 161. CrossRef - Ropivacaine regulates the expression and function of heme oxygenase-1
Xiangbiao Yan, Yu Li, Xuechang Han, Xu Dong, Yajie Zhang, Qunzhi Xing
Biomedicine & Pharmacotherapy.2018; 103: 284. CrossRef - A review on heme oxygenase-1 induction: is it a necessary evil
Ajaz Ahmad Waza, Zeenat Hamid, Sajad Ali, Shabir Ahmad Bhat, Musadiq Ahmad Bhat
Inflammation Research.2018; 67(7): 579. CrossRef - Diabetes and Alzheimer's Disease: Mechanisms and Nutritional Aspects
Hee Jae Lee, Hye In Seo, Hee Yun Cha, Yun Jung Yang, Soo Hyun Kwon, Soo Jin Yang
Clinical Nutrition Research.2018; 7(4): 229. CrossRef - Social, economic, and policy implications of organ preservation advances
Alyssa Ward, David K. Klassen, Kate M. Franz, Sebastian Giwa, Jedediah K. Lewis
Current Opinion in Organ Transplantation.2018; 23(3): 336. CrossRef - Geniposide protects pancreatic β cells from high glucose‐mediated injury by activation of AMP‐activated protein kinase
Chunyan Liu, Yanan Hao, Fei Yin, Yonglan Zhang, Jianhui Liu
Cell Biology International.2017; 41(5): 544. CrossRef - Eff ects of hemin, a heme oxygenase-1 inducer in L-arginine-induced acute pancreatitis and associated lung injury in adult male albino rats
N. M. Aziz, M. Y. Kamel, R. A. Rifaai
Endocrine Regulations.2017; 51(1): 20. CrossRef - Downregulation of microRNA-155 ameliorates high glucose-induced endothelial injury by inhibiting NF-κB activation and promoting HO-1 and NO production
Xi Zhang, Xiangyang Liu, Yang Li, Jingbo Lai, Nana Zhang, Jie Ming, Xianjie Ma, Qiuhe Ji, Ying Xing
Biomedicine & Pharmacotherapy.2017; 88: 1227. CrossRef - Sulforaphane Protects against High Cholesterol-Induced Mitochondrial Bioenergetics Impairments, Inflammation, and Oxidative Stress and Preserves Pancreaticβ-Cells Function
Catalina Carrasco-Pozo, Kah Ni Tan, Martin Gotteland, Karin Borges
Oxidative Medicine and Cellular Longevity.2017; 2017: 1. CrossRef - Aromatic malononitriles stimulate the resistance of insulin-producing beta-cells to oxidants and inflammatory cytokines
Kyril Turpaev, Nils Welsh
European Journal of Pharmacology.2016; 784: 69. CrossRef - Differences in insulin biosynthesis pathway between small and large islets do not correspond to insulin secretion
Han-Hung Huang, Lisa Stehno-Bittel
Islets.2015; 7(5): e1129097. CrossRef - A newly identified polysaccharide from Ganoderma atrum attenuates hyperglycemia and hyperlipidemia
Kexue Zhu, Shaoping Nie, Chuan Li, Suli Lin, Mengmeng Xing, Wenjuan Li, Deming Gong, Mingyong Xie
International Journal of Biological Macromolecules.2013; 57: 142. CrossRef - Glycated Albumin Causes Pancreatic β-Cells Dysfunction Through Autophagy Dysfunction
Young Mi Song, Sun Ok Song, Young-Hye You, Kun-Ho Yoon, Eun Seok Kang, Bong Soo Cha, Hyun Chul Lee, Ji-Won Kim, Byung-Wan Lee
Endocrinology.2013; 154(8): 2626. CrossRef - Chronic Resveratrol Treatment Protects Pancreatic Islets against Oxidative Stress in db/db Mice
Young-Eun Lee, Ji-Won Kim, Eun-Mi Lee, Yu-Bae Ahn, Ki-Ho Song, Kun-Ho Yoon, Hyung-Wook Kim, Cheol-Whee Park, Guolian Li, Zhenqi Liu, Seung-Hyun Ko, Kathrin Maedler
PLoS ONE.2012; 7(11): e50412. CrossRef
 PubReader
 Cite
Cite