Diabetes Mellitus in the Elderly Adults in Korea: Based on Data from the Korea National Health and Nutrition Examination Survey 2019 to 2020
Article information

Abstract
Background
We evaluated the prevalence and management of diabetes mellitus (DM) in elderly Korean patients based on data from the Korea National Health and Nutrition Examination Survey (KNHANES).
Methods
A total of 3,068 adults aged 65 years and older (19.8% of total population) were analyzed using KNHANES from 2019 to 2020. Prevalence, awareness, treatment, and control rates, and comorbidities were analyzed. Lifestyle behaviors and energy intake were also measured.
Results
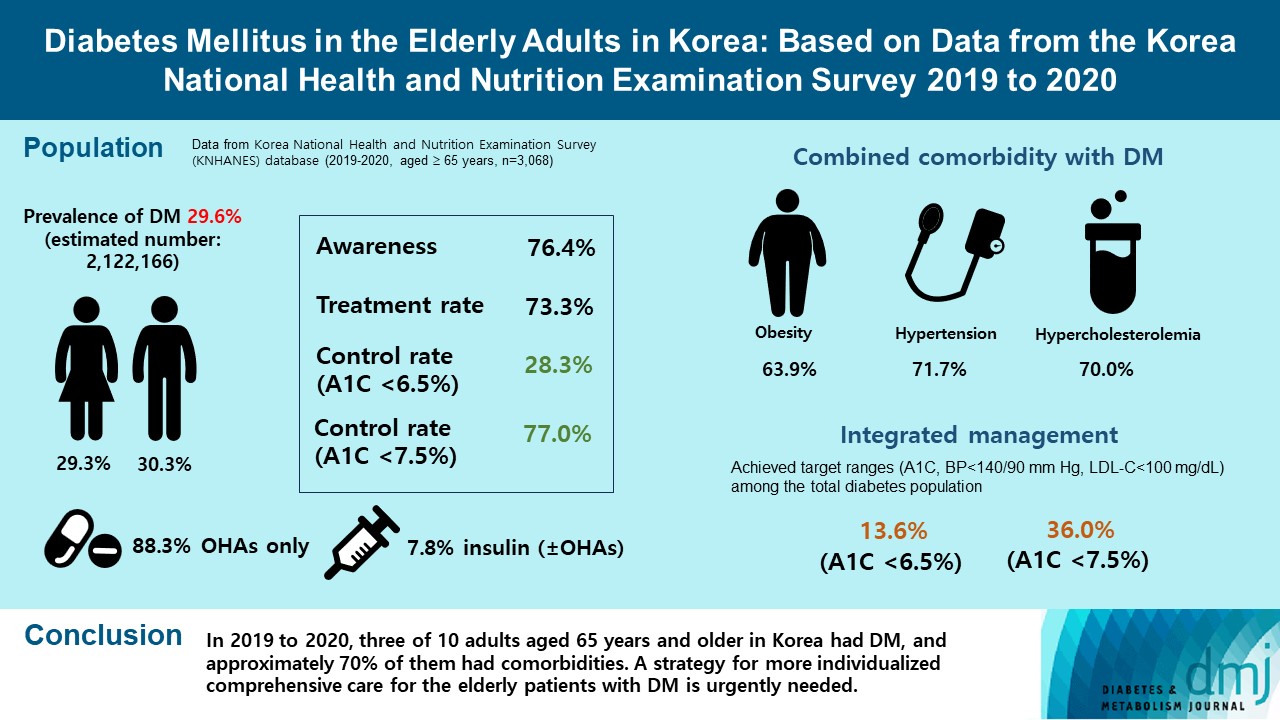
The prevalence of DM and prediabetes was 29.6% and 50.5%, respectively. The awareness, treatment and control rates were 76.4%, 73.3%, and 28.3%, respectively. The control rate was 77.0% if A1C <7.5% criteria was used. The mean A1C value of individuals with known DM was 7.1%, and 14.5% of the known DM patients had A1C ≥8.0%. Abdominal obesity, hypertension, and hypercholesterolemia were combined with DM in 63.9%, 71.7%, and 70.7%, respectively, and the rate of integrated management was 36.0% (A1C <7.5% criteria). A total of 40.1% of those with DM walked regularly. The percentage of energy intake from carbohydrates was higher in those with DM than in those without DM (P=0.044), while those of fat (P=0.003) and protein (P=0.025) were lower in those with DM than in those without DM in women.
Conclusion
In 2019 to 2020, three of 10 adults aged 65 years and older in Korea had DM, and approximately 70% of them had comorbidities. A strategy for more individualized comprehensive care for the elderly patients with DM is urgently needed.
INTRODUCTION
South Korea is one of the most rapidly aging societies worldwide. South Korea became an aged society in 2017 and is predicted to become a superaged society, defined as ≥20.0% of the population being aged 65 years or older, by 2025 [1]. According to Korean statistics in 2019, the population aged 65 years or older totaled 7,746 thousand persons, accounting for 15.5% of the total population [2]. In particular, the remaining life expectancies at 60 years of age were 28.1 and 23.3 years for women and men, respectively [3].
Aging is inevitably accompanied by various comorbidities and chronic diseases. The average number of chronic diseases in Korean older adults was 1.9, with 84% of the population having more than one chronic disease [1]. The top three chronic diseases were hypertension (56.8% to 64.4%), diabetes mellitus (DM; 24.2% to 29.0%), and dyslipidemia (17.1% to 38.9%) [1]. Among them, DM especially requires lifetime care, including lifestyle modification, medication adherence, and management of morbidities. In 2019, it was estimated that 19.3% of people aged 65 to 99 years (135.6 million) live with diabetes, and the number of people older than 65 years (65 to 99 years) with diabetes will reach 195.2 million by 2030 and 276.2 million by 2045 [4].
Advancing age is also an important factor in the increased prevalence, morbidity and mortality rates associated with DM. Compared to people with younger onset, those diagnosed when older had more multimorbidity, a higher prevalence of diabetes-related complications, and proportionally lower antidiabetic drug usage [5,6]. In a retrospective cohort study using Taiwan National Health Insurance Research Database claims data from 2000 to 2013, people who were older versus younger at diabetes diagnosis had a higher cumulative incidence of macrovascular complications but lower rates of microvascular complications (except nephropathy) [5]. Diabetes onset at an older age (≥65 years) was associated with increased risks of all-cause mortality, cardiovascular (CV) mortality, major CV events, and hypoglycemia after adjusting for the severity of diabetes and antidiabetic treatment [7].
Furthermore, older people with diabetes have heterogeneous clinical characteristics and complications. In addition to higher morbidity and mortality rates compared to younger people, older populations with DM have higher likelihoods of multimorbidity, geriatric syndromes, frailty, polypharmacy, cognitive deficits, and lower activity of daily life [5]. Diabetes management and glycemic control status could affect these comorbidities or frailty. Therefore, a more detailed and individualized strategy for comprehensive diabetes care in older people with diabetes is needed.
The aim of our study was to evaluate the prevalence, management status, and comorbidities in older Korean subjects with DM. From this study, we intended to provide an up-to-date reference from Korean nationwide statistical data and basic data for establishment of individualized care strategy for elderly DM.
METHODS
Data sources
We used the Korea National Health and Nutrition Examination Survey (KNHANES) database [8,9]. KNHANES is a population-based cross-sectional survey designed to assess Koreans’ health-related behavior, health condition, and nutritional state [8]. A retrospective sample of noninstitutionalized civilians was obtained from all geographic regions in Korea. In the current study, data from eight phase (2019 to 2020) of the KNHANES were used, and adults aged 65 years and older were included. In this KNHANES dataset, we analyzed the laboratory test results (fasting plasma glucose [FPG], A1C, total cholesterol, triglyceride, low density lipoprotein cholesterol [LDLC], and high density lipoprotein cholesterol) and collected questionnaire data corresponding to diabetes management, lifestyle habits, accompanying comorbidities, and nutritional status [8-10]. Confined to the estimation of the trends in the prevalence and total number of patients with DM in the elderly population (aged 65 years and older), we used the KNHANES database from 2012 to 2020. This study was approved by both the KNHANES and the Institutional Review Board of Korea University Anam Hospital (IRB No. 2022AN-0146). Therefore, the need for written informed consent was waived. All methods were performed in accordance with the relevant guidelines and regulations.
Definition of diabetes, socioeconomic variables, and comorbidities
The presence of DM was defined if any of the following were present: (1) FPG level of ≥126 mg/dL; (2) current use of any antidiabetic medications; (3) a previous history of diagnosed DM; or (4) A1C level of ≥6.5%. Prediabetes was defined as an FPG of 100 to 125 mg/dL or an A1C of 5.7% to 6.4% [10]. Hypertension was defined as a systolic blood pressure (SBP) of ≥140 mm Hg or diastolic blood pressure (DBP) of ≥90 mm Hg or taking antihypertensive drugs. Hypercholesterolemia was defined as an LDL-C level of ≥100 mg/dL or taking lipidlowering drugs [8]. Obesity was defined as a body mass index (BMI) of ≥25.0 kg/m2, and abdominal obesity was defined as waist circumference ≥90 cm in men and ≥85 cm in women [11,12]. Information about other comorbidities, including stroke, myocardial infarction, angina, and cancer, was also collected from a self-administered questionnaire.
Lifestyle behaviors and nutritional survey by questionnaire
Regular walking was defined as walking for at least 30 minutes per day at least five times per week. Current smoking was defined as having smoked five packs (or 100 cigarettes) in his or her lifetime and currently smoking cigarettes. High-risk alcohol consumption was defined as more than seven drinks twice a week for men and more than five for women [8-10]. Excess energy intake was defined as 125% or more of the estimated energy requirement recommended by the dietary reference intakes for Koreans 2015 [8,13-15]. The percentages of energy intake from macronutrients (carbohydrates, protein, and fat) were calculated as previously reported [13-15]. In this analysis, prevalent DM was defined as known DM and newly diagnosed DM.
Definition of diabetes management status and integrated management
We used the definitions for awareness, treatment rate, and control rate of DM according to previously published criteria [8,15]. We defined awareness of DM as the percentage of people previously diagnosed with DM among people with DM. The treatment rate of DM was defined as the percentage of people taking antidiabetic medications among people with DM. For the control rate, we used two criteria. The control rate of DM was defined as the percentage of people with A1C <6.5% among people with DM. Also, the Korean Diabetes Association (KDA) recommends that the target of glycemic control in elderly DM patients is generally A1C <7.5%, we also investigated the control rate this criterion [11]. We defined the control rate of hypertension as the percentage of subjects with SBP <140 mm Hg and DBP <90 mm Hg in the DM population [8,16,17]. We defined lipid control as LDL-C <100 mg/dL [8,11]. The target goals of blood glucose, blood pressure (BP), and LDL-C levels were as follows: A1C <6.5% or 7.5%, BP <140/90 mm Hg, and LDL-C <100 mg/dL; therefore, the integrated management rate was defined as the proportion of patients with achieved target ranges among the total diabetes population.
Statistical methods
Descriptive statistics were used to characterize the data in the study. The baseline characteristics are presented as percentage (standard error [SE]) for categorical variables and mean±SE for continuous variables. A linear regression analysis was conducted to compare the means of continuous variables, while a Rao-Scott chi-square test was conducted to compare the proportions between categorical variables. The estimated DM prevalence was presented as the percentage and SE. For the subgroup analysis, domain option was applied in survey procedure to preserve appropriate subsample in the complex sampling design. All P values provided are two-sided, with the level of significance set at 0.05. Statistical analyses were performed using SAS version 9.4 (SAS Institute Inc., Cary, NC, USA), and the name of SAS procedure was SURVEYFREQ, SURVEYMEANS, SURVEYREG, SURVEYLOGISTIC.
RESULTS
Prevalence of prediabetes and diabetes
Overall, among 15,469 subjects from KNHANES from 2019 to 2020, we identified 3,477 subjects (22.5%) aged ≥65 years. Ultimately, 3,068 subjects were included in the study, excluding those with missing values or missing blood test results in the KNHANES data (Table 1). The mean age of the study population was 73.1±0.1 years, with men accounting for 43.1%. The mean BMI and waist circumference values of total elderly population were 24.0±0.1 kg/m2 and 87.2±0.2 cm, respectively. However, the mean age and mean BMI value of subjects with elderly DM were 73.4±0.2 years and 24.8±0.1 kg/m2, respectively (Table 1).
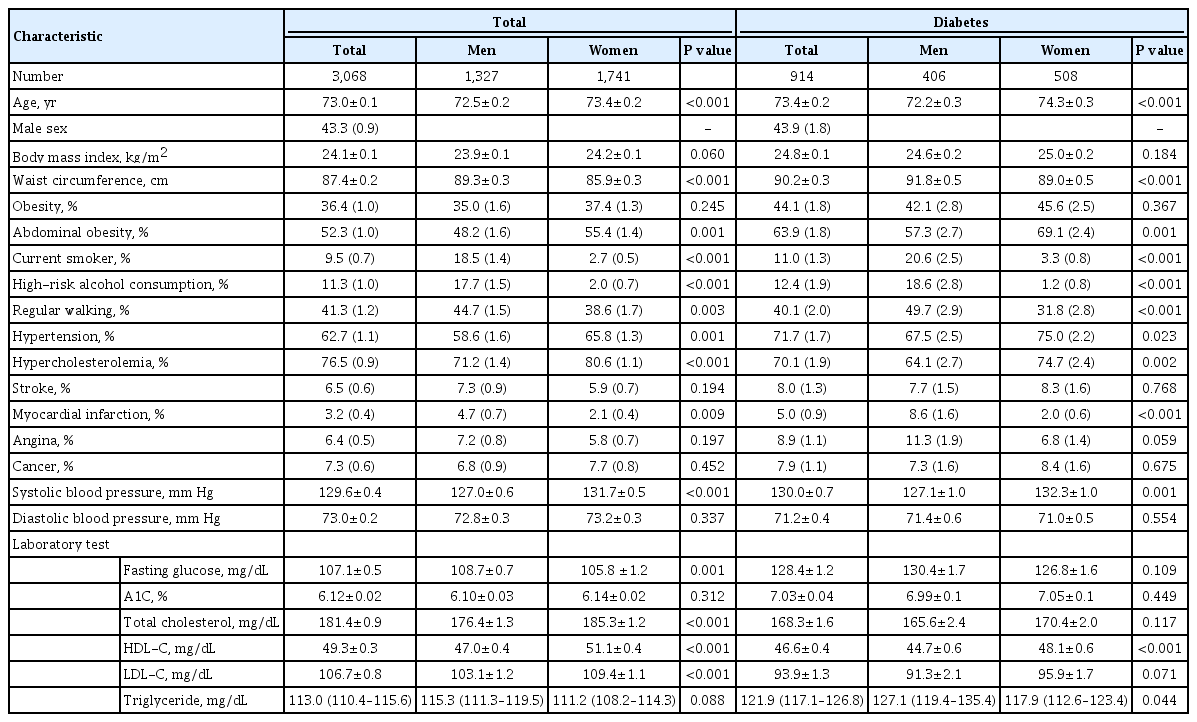
Baseline characteristics of study participants in aged 65 years and older, KNHANES 2019 to 2020
The estimated prevalence of DM and prediabetes among adults aged 65 years and older in 2019 to 2020 was 29.6% (30.3% in men and 29.3% in women) and 50.5% (51.1% in men and 49.9% in women), respectively (Table 2, Supplementary Table 1). The prevalence of DM was 26.0% according to the FPG criteria only and 29.6% according to both the FPG and A1C criteria (Table 2). Additionally, the estimated numbers of people with DM and prediabetes in the elderly population were 2,122,166 (930,681 in men and 1,191,485 in women) and 3,620,684 (1,588,338 in men and 2,032,346 in women), respectively. There were no statistically significant differences between men and women (Table 2).

Prevalence and estimated number of diabetes and prediabetes in study participants aged 65 years and older, KNHANES 2019 to 2020
The trend of DM prevalence in older Korean adults is shown in Fig. 1. Although the prevalence showed a consistent pattern (Fig. 1A), the estimated total number of patients with DM has been steadily increasing since 2014 (Fig. 1B).
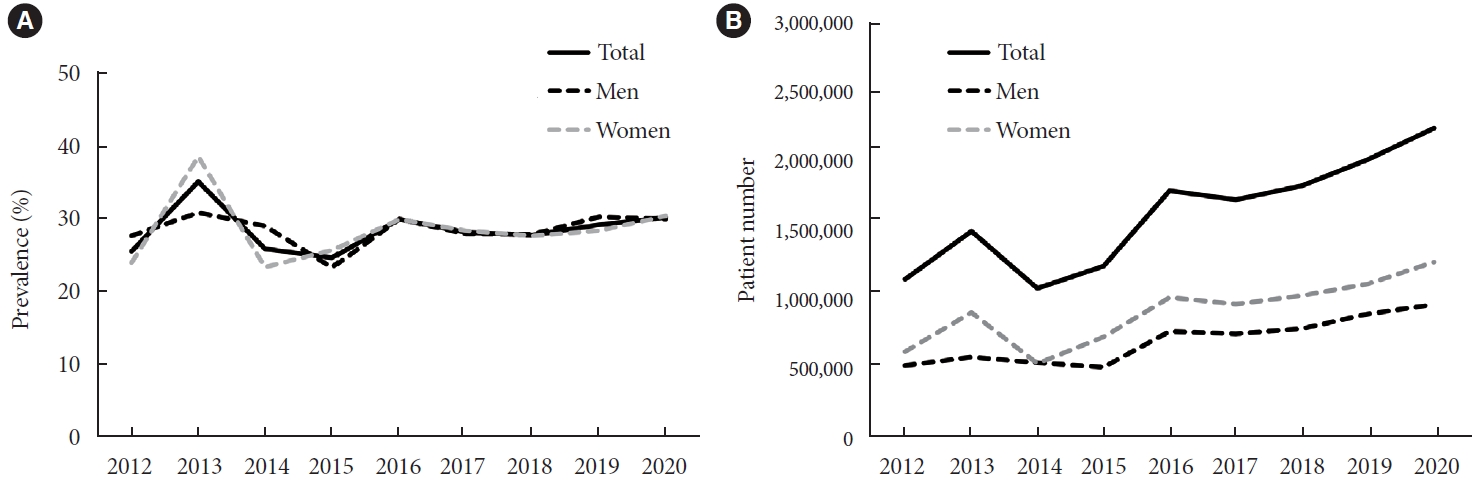
Prevalence of diabetes (A) and number of patients with diabetes (B) in aged 65 years and older in Korea, Korea National Health and Nutrition Examination Survey 2012 to 2020.
Diabetes management status
From 2019 through 2020, the awareness and treatment rate of DM in older adults were 76.4% and 73.3%, respectively. The control rate of DM in older adults were 28.3% (32.3% in men, 25.2% in women) based on A1C level of 6.5% and 77.0% (78.9% in men, 75.5% in women) based on A1C level of 7.5%, respectively. There were no significant differences between men and women for awareness (P=0.671) and treatment rate (P=0.244); however, the control rate was significantly higher in men than in women if A1C <6.5% criterion was used (P=0.041) (Fig. 2A). When the subjects with DM were categorized according to A1C levels, the proportions of DM patients with A1C levels of <6.5% and 6.5%–6.9% were 28.3% and 32.0%, respectively. In addition, 6.7% of all patients with DM had an A1C level of ≥9.0% (Fig. 2B). The mean A1C level of subjects with prevalent DM in 2019 to 2020 was 7.03%, and there were no statistically significant differences between men and women (P=0.449) (Supplementary Table 2). The proportion of older adults with DM receiving oral hypoglycemic agents (OHAs) or insulin (±OHAs) treatment is described in Supplementary Table 3. Among the known DM population, only 0.1% were on a diet and exercise alone regimen, 88.3% took OHAs only, and 7.8% were treated with insulin (±OHAs). Compared to patients treated with diet and exercise alone (6.40%) or OHAs (7.02%), the mean value of the A1C level (8.04%) was higher in patients treated with insulin.

(A) Awareness, treatment rate, and control rate of patients with diabetes aged 65 years and older, Korea National Health and Nutrition Examination Survey 2019 to 2020. (B) Distribution of percentage of patients with diabetes mellitus according to A1C category. aP value <0.005 for control rate, men vs. women.
Combined comorbidities and lifestyle behaviors
When the study subjects were stratified by their BMI, the percentages of overweight and obese populations with DM were 27.6% and 44.0%, respectively, and there was no statistically significant difference between men and women (P=0.116). In other words, only 26.8% of elderly patients with DM were within the normal BMI range (Supplementary Fig. 1). Among the study population with DM, 71.7% of patients had hypertension, and 70.0% had hypercholesterolemia. The control rates of hypertension and hypercholesterolemia were 62.8% and 61.7%, respectively. In particular, 50.7% of elderly DM subjects had comorbid hypertension, dyslipidemia, and obesity at the same time. For all three comorbidities, the prevalence rates were higher in women than in men (P=0.001 for obesity, P=0.023 for hypertension, and P=0.002 for hypercholesterolemia) (Table 3).

Combined comorbidity and lifestyle behaviors among subjects aged 65 years and older with diabetes, KNHANES 2019 to 2020
Only 13.6% of older adults with DM achieved all three goals of A1C <6.5%, BP <140/90 mm Hg, and LDL-C <100 mg/dL based on the 2021 KDA clinical practice guideline. However, the A1C cutoff level of <7.5% was used, the integrated management rate increased up to 36.0%. The proportion of patients undergoing integrated management was lower in women than men (men vs. women, 18.1% vs. 10.1%, P=0.0025, A1C <6.5%; 40.1% vs. 32.8%, P=0.0379, A1C <7.5%) (Table 3).
Current smoking and high-risk alcohol consumption were observed in 11.0% (20.6% in men and 3.3% in women) and 12.4% (18.6% in men and 1.2% in women) of older adults with DM, respectively. Those who walked regularly accounted for 40.1% (49.7% of men and 31.8% of women). For these lifestyle behaviors, the proportion of women with DM was significantly lower than that of men with DM (Table 3).
Energy intake status among older adults with diabetes
Total daily energy intake was higher in men than in women among the elderly population with DM (P<0.001); however, there was no difference between subjects with prevalent DM and subjects without DM (P=0.493). Among the individuals with prevalent of known DM, the percentage of energy intake from carbohydrates was higher in women than in men with DM, whereas those from protein and fat were higher in men than in women (Table 4). In addition, the percentage of energy intake from carbohydrates was higher in those with DM than in those without DM, especially in women (P=0.002). However, those from protein (P=0.025) and fat (P=0.003) were lower in patients with DM than in those without DM, particularly in women (Table 4).
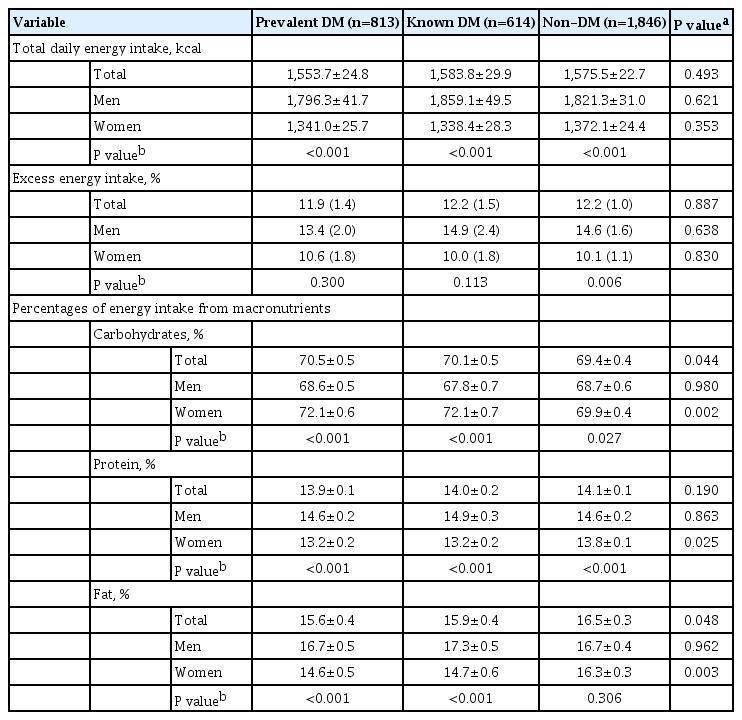
Energy intake status among subjects aged 65 years and older adults with diabetes, 2019 to 2020
DISCUSSION
From this nationwide cross-sectional study, the estimated prevalence and management status of DM was investigated among Korean older adults in 2019 to 2020. As the elderly population increases, the total number of elderly patients with DM has also steadily increased in Korea. In this elderly population, the estimated DM prevalence was 29.6% based on the both FPG and A1C criteria, which corresponds to approximately 2.1 million people in Korea. Additionally, half of older Korean adults (50.5%, 3.6 million) are presumed to have prediabetes. According to the KDA, 16.7% (19.2% of men and 14.3% of women) of Korean adults aged 30 years or older, approximately 6.05 million people, had DM in 2020 [8]. Therefore, the prevalence rate was 1.8- fold higher in the older population than in the general adult population in Korea.
In 2019 to 2020, 76.4% of older subjects with DM were aware of their disease, and 73.3% were treated with antidiabetic medications. These figures are relatively higher compared to those in adults with DM aged 30 years or older, i.e., 65.8% and 61.4%, respectively [8]. In addition, the control rate, which is the percentage of adults with DM who achieved an A1C level <6.5% among prevalent DM patients, was also higher in older patients (28.3%) than in the general adult population (24.5%). When the A1C criterion of <7.5% was applied according to the A1C target of the elderly DM population (aged 65 years and older) by clinical practice guidelines from the KDA [11], the control rate rose to 77.0% in older patients with DM. Additionally, approximately 15% of all older patients with DM showed an A1C level of ≥8.0% in 2019 to 2020.
From a retrospective observational study using administrative data from the Department of Veterans Affairs and Medicare, maintaining A1C levels within individualized target ranges was associated with a lower risk of mortality and cardiovascular disease (CVD) in older adults with DM [18,19]. Nakanishi et al. [20] showed that poor glycemic control with A1C levels ≥8.5% increased the risk of microangiopathy, including retinopathy and neuropathy, among Japanese patients aged ≥65 years. In addition, hyperglycemia, defined as A1C levels ≥8.0% or ≥8.5%, is associated with increased risks of frailty, decreased muscle quality, impaired physical performance, injurious falls requiring hospitalization and mortality in older adults [21-23].
In our study, most of the older patients diagnosed with DM (88.3%) were treated with OHAs, and only 7.8% used insulin treatment. Based on the finding that their mean A1C level was 8.04%, insulin-treated older patients are suggested to be in uncontrolled glycemic status with long-standing diabetes. In our analysis, considerable proportion of elderly patients with DM (28.3%) has A1C level of less than 6.5%. Also, only 4% of elderly patients with DM do not receive antidiabetic medication with their mean A1C level was less than 6.5%.
We found that the percentage of older adults with DM who achieved all three goals of A1C, BP <140/90 mm Hg, and LDLC <100 mg/dL were 13.6% for the A1C <6.5% and 36.0% for the A1C <7.5% criteria. A triple combination of comorbidities, such as obesity, hypertension, and hypercholesterolemia, was more prevalent in older women than in older men; however, the control rate and integrated management rate were significantly lower in older women than in older men. Moreover, the percentage of patients with DM who had regular walking habits was also lower in older women than in older men. Therefore, active screening of comorbidities and more intensive lifestyle modification with diabetes treatment are needed, especially in women with DM.
In the data from KNHANES 2019 to 2020, the total energy intake in subjects with and without DM was 1,825 and 1,911 kcal in the general adult population [8] and 1,554 and 1,576 kcal in the elderly population, respectively. According to 2015 dietary reference intakes for Korean presented by Ministry of Health and Welfare, Republic of Korea, estimated energy requirement for elderly men and women (≥65 years) was 2,000 and 1,600 kcal/day, respectively [15]. This finding shows a remarkable decrease in total daily energy intake in the elderly population, and this change was accompanied by an increased proportion in carbohydrate intake. Also percentages of energy intake from macronutrients were different between older people with DM and without DM, only in women. The proportion in carbohydrate intake was higher, whereas those in protein and fat intakes were lower in older women patients with DM compared to those without DM.
Older people with diabetes typically have multiple chronic comorbidities, such as hypertension, hyperlipidemia and others, which may lessen their quality of life and significantly increase their risk of CV adverse outcomes, functional decline, and even mortality [24]. Studies in different countries have also observed that achieving adequate control of risk factors for CVD in new DM patients was challenging and still far from satisfactory, ranging from 1.4% to 24% according to the different targets for blood glucose, BP, and lipids set by different studies [25,26]. We showed that approximately 70% of patients had hyperlipidemia or hypertension, but these conditions were controlled in only 62.8% of older people with DM. Therapies directed at CVD risk factor reduction are important therapeutic priorities for older adults with diabetes for the prevention of CV events and the improvement of health-related quality of life [27]. The American College of Cardiology/American Heart Association and KDA lipid-lowering guidelines recommend active treatment with statins for older patients with DM with and without atherosclerotic CVD [26,27]. In addition, the 8th Joint National Committee (JNC 8) provides recommendations regarding the benefits of BP-lowering therapy in older adults, emphasizing that goals should be tailored to individual patient characteristics to minimize the risk of harm [26,27].
The Montana Cardiovascular Disease and Diabetes Prevention Program showed that older adults had higher lifestyle participation and self-monitoring rates than younger subjects [28]. Based on the diabetes fact sheet in Korea 2021, the percentages of DM patients with smoking and high-risk alcohol consumption in the general adult population were 22.3% and 22.8%, respectively [8]. Current smokers and those with high-risk alcohol intake were approximately half of the older DM population. However, 20% of older men are still current smokers and heavy alcohol drinkers; therefore, reinforcement education and intensive lifestyle modification should be emphasized, especially in older men with DM [29].
The strength of our study is that it was a large-scale nationwide study in older patients with DM. Nevertheless, our study lacked some important variables, such diabetes duration, medication information, diabetic complications, and socioeconomic status such as educational attainment and income status. Despite these limitations, it is very important to understand the current situation of diabetes management in older patients with DM in Korea.
In summary, about one third of Korean elderly population has DM. Balanced and adequate nutrition is essential for older adults, especially those with multiple comorbidities [30]. Therefore, specialized nutritional education programs for older patients with DM should be developed and implemented. In addition to comprehensive diabetes care, a more intensive, individualized and patient-centered detailed approach should be emphasized in this older population with DM.
SUPPLEMENTARY MATERIALS
Supplementary materials related to this article can be found online at https://doi.org/10.4093/dmj.2023.0041.
Total number of prevalent, known, and newly diagnosed old patients with DM, KNHANES 2019 to 2020
Mean value of A1C (%) in prevalent, known, and newly diagnosed old patients with DM, KNHANES 2019 to 2020
Diabetes treatment status and mean A1C levels according to diabetes treatment in old patients with diabetes, KNHANES 2019 to 2020
Distribution of body mass index (BMI) in adults aged 65 years and older patients with diabetes mellitus (Korea National Health and Nutrition Examination Survey 2019 to 2020).
Notes
CONFLICTS OF INTEREST
Seung-Hyun Ko is associate editor of the Diabetes & Metabolism Journal from 2022 to 2023. Yong-Moon Park has been statistical advisor of the Diabetes & Metabolism Journal since 2022.
They were not involved in the review process of this article. Otherwise, there was no conflict of interest.
AUTHOR CONTRIBUTIONS
Conception or design: S.H.K., K.D.H.
Acquisition, analysis, or interpretation of data: K.D.H., Y.M.P.
Drafting the work or revising: S.H.K., Y.M.P., J.S.Y., K.K., J. H.B., H.S.K., N.H.K.
Final approval of the manuscript: S.H.K., K.D.H., Y.M.P., J.S.Y., K.K., J.H.B., H.S.K., N.H.K.
FUNDING
This work was supported by the Bio & Medical Technology Development Program of the National Research Foundation (NRF) funded by the Korean government (MSIT) (NRF-2019M3E5D3073102), and National IT Industry Promotion Agency (NIPA) grant funded by MSIT (No. S0252-21-1001, Development of AI Precision Medical Solution [Doctor Answer 2.0]).
Acknowledgements
None