Glimepiride Compared to Liraglutide Increases Plasma Levels of miR-206, miR-182-5p, and miR-766-3p in Type 2 Diabetes Mellitus: A Randomized Controlled Trial
Article information

Abstract
Background
Diabetes is a chronic disease with several long-term complications. Several glucose-lowering drugs are used to treat type 2 diabetes mellitus (T2DM), e.g., glimepiride and liraglutide, in which both having different modes of action. Circulating microRNAs (miRNAs) are suggested as potential biomarkers that are associated with the disease development and the effects of the treatment. In the current study we evaluated the effect of glimepiride, liraglutide on the expression of the circulating miRNAs.
Methods
The present study is a post hoc trial from a previously randomized control trial comparing liraglutide versus glimepiride both in combination with metformin in subjects with T2DM, and subclinical heart failure. miRNAs were determined in the subjects’ serum samples with next generation sequencing. Expression patterns of the circulating miRNAs were analyzed using bioinformatic univariate and multivariate analyses (clinical trial registration: NCT01425580).
Results
Univariate analyses show that treatment with glimepiride altered expression of three miRNAs in patient serum, miR-206, miR-182-5p, and miR-766-3p. Both miR-182-5p and miR-766-3p were also picked up among the top contributing miRNAs with penalized regularised logistic regressions (Lasso). The highest-ranked miRNAs with respect to Lasso coefficients were miR-3960, miR-31-5p, miR-3613-3p, and miR-378a-3p. Liraglutide treatment did not significantly influence levels of circulating miRNAs.
Conclusion
Present study indicates that glucose-lowering drugs differently affect the expression of circulating miRNAs in serum in individuals with T2DM. More studies are required to investigate possible mechanisms by which glimepiride is affecting the expression of circulating miRNAs.

INTRODUCTION
Diabetes is a prevalent and costly chronic disease associated with several long-term complications. Worldwide, the prevalence of diabetes has increased dramatically over the past two decades and is expected to affect more than 500 million adults by 2030, with most having type 2 diabetes mellitus (T2DM) [1]. Myocardial infarction is the most common cause of death in individuals with diabetes [2,3]. Although factors that are known to reduce the risk of myocardial infarction [4,5] include the use of lipid-lowering and antihypertensive medications and better glycemic control [6-8] an excess risk of death still exists.
There are several glucose-lowering agents available for the treatment of T2DM, including glimepiride, a second-generation sulfonylurea, e.g., glimepiride, improving the relative insulin secretory deficit found in T2DM, and glucagon-like peptide 1 (GLP-1) receptor antagonists, e.g., liraglutide, which acts via insulin release and reduction in glucagon secretion in the presence of elevated glucose concentrations.
MicroRNAs (miRNAs) consisting of short (21 to 22 nucleotides), single-stranded, non-coding RNAs are prevalent in human plasma and other biological fluids, and their expression has been proven to be disease-specific [9-13]. miRNAs have been identified as key regulators of complex biological processes linked to multiple cardiovascular pathologies, including left ventricular hypertrophy, ischemic heart disease, heart failure, hypertension, and arrhythmias. Compared with conventional biomarkers, miRNAs offer advantages with high stability [14]. In addition, miRNAs have been identified as regulators of the β-cells’ mass and function, and thus putatively involved in the pathogenesis of T2DM [13,15,16]. The aim of the present study is to evaluate the effect of two different classes of glucoselowering drugs, liraglutide and glimepiride, on the expression pattern of circulating miRNAs in patients with T2DM.
METHODS
Cohort
The present study is a post hoc trial from the main study [17-19]; which was an assessor-blinded and active-controlled parallel-group trial comparing liraglutide 1.8 mg subcutaneously versus glimepiride 4 mg orally both once daily and in combination with metformin during 18 weeks in subjects with T2DM and subclinical heart failure.
The trial protocol was approved (number D-nr 2011/233-31/1) by regional ethics committees at both participating centers and was conducted in accordance with International Conference on Harmonization-Good Clinical Practice guidelines. Participants gave written informed consent before being enrolled. The clinical trial registration information can be found at ClinicalTrials.gov with the identifier NCT01425580.
The definition of subclinical heart failure was fulfillment of one of the following criteria: left ventricular ejection fraction ≤50%, or evidence of systolic dysfunction as shown by reduced relaxation velocity, in the left ventricular long axis, of 20% compared to a normal population. Key exclusion criteria were heart failure classified according to the New York Heart Association (NYHA) classification III–IV; history of atrial fibrillation or flutter; presence of acute myocarditis or significant valvulopathies [19]. The primary endpoint was treatment change in either longitudinal functional reserve index (LFRI) and (diastolic functional reserve index [DFRI] and, systolic functional reserve index [SFRI], respectively). Briefly, LFRI was constructed by collecting e´ and s´ at rest (e´rest, s´rest), and during bicycle exercise stress test (e´exercise, s´exercise) using the formula: LFRIdiastolic=Δe´×[1−(1/e´rest)], and LFRIsystolic=Δs´×[1−(1/s´rest)], respectively. Where Δe´ is the difference between e´exercise and e´rest and Δs´ is the difference between s´exercise and s´rest (Note that LFRI has no magnitude).
The baseline characteristics of the cohort are shown in Table 1.

Baseline characteristics of the study population
Serum samples collection
Plasma samples were collected at baseline and after 18 weeks of treatment with liraglutide or glimepiride and the plasma samples were after spinning and aliquoting into the Eppendorf vessels and stored at –80°C.
miRNA isolation and quality control
Serum-ethylenediaminetetraacetic acid (EDTA) samples were preserved at –80°C until dry ice shipment to the Qiagen Genomic Services lab (Qiagen, Hilden, Germany) for further miRNA purification and analysis. According to Qiagen miRNA was purified from the serum-EDTA samples using miRNeasy Kit (Qiagen) according to the manufacturer’s instructions. Purified miRNA quality was checked by quantitative polymerase chain reaction (qPCR) to evaluate if the expression levels of selected miRNAs in our samples were within the expected range. In this analysis, the expression levels of miRNAs hsa-miR-103a-3p, hsa-miR-191-5p, hsa-miR-451a, hsa-miR23a-3p, and hsa-miR-30c-5p was done since those miRNAs are stably expressed in biofluids like serum and plasma. To assess hemolysis qPCR quantification of two miRNAs was used: miRNA-451 which is expressed in red blood cells and miRNA23a which is relatively stable in serum and plasma and not affected by hemolysis (miRNA-23a).
Library preparation and sequencing
The library preparation was done using the QIAseq miRNA Library Kit (Qiagen). A total of 5 μL total RNA was converted into miRNA next generation sequencing libraries. Adapters containing unique molecular identifiers were ligated to the RNA which was subsequently converted to cDNA. The cDNA was amplified using PCR and purified. Library preparation quality check was performed using Bioanalyzer 2100 (Agilent Technologies, Santa Clara, CA, USA). Based on the quality of the inserts and the concentration measurements the libraries were pooled in equimolar ratios. The library pool(s) were quantified using qPCR and sequenced on a NextSeq550 sequencing instrument according to the manufacturer’s instructions. Raw data were demultiplexed and FASTQ files for each sample were generated using the bcl2fastq software (Illumina, San Diego, CA, USA). FASTQ data were checked using the FastQC tool (https://www.bioinformatics.babraham.ac.uk/projects/fastqc/). Sequencing and processed miRNA data are available under gene accession no. GSE223538 at the public functional genomics data repository Gene Expression Omnibus (GEO).
The raw sequencing data and its corresponding meta data for the miRNA results, are in the process of being uploaded for evaluation by the public functional genomics data repository GEO with minimum information about a microarray experiment (MIAME)-compliant data submission.
Statistical and bioinformatical analysis
For the statistical analysis of the cohort, continuous data are summarized as mean±standard deviation and categorical data are presented as percentages. A two-sided P value of less than 0.05 was considered statistically significant. Data were analyzed using Stata 14.2 (StataCorp., College Station, TX, USA).
Qiagen Genomic Service generated the raw counts of miRNAs. miRNAs with a mean total read count ≥50 were used as input into the DESeq2 Bioconductor package in R (R Foundation for Statistical Computing, Vienna, Austria) for statistical analysis. Differential expression tests were conducted with DESeq function to estimate size factors, dispersions and for fitting a patient paired binomial generalized linear models for each miRNA and Wald test for significance testing (design: patient+gender+cardiovascular disease background+treatment). miRNAs were considered as differentially expressed if the absolute value of fold change was >1.5 and the Benjamini-Hochberg adjusted P value was <0.05.
Linear mixed effects models evaluating effect of differentially expressed miRNA and treatment changes in SFRI and DFRI were fitted for fixed effects of gender, cardiovascular disease background and treatment, with individual patients as random effect (lme4 and lmerTest package in R) [19].
Unsupervised dimensionality reduction of miRNA expressions was performed with principal component analysis (PCA) and with Uniform Manifold Approximation and Projection (UMAP; embed package in R) algorithms in R. Unsupervised Gaussian finite mixture model clustering and evaluation were performed on miRNA expressions (mclust package in R). Supervised UMAP and partial least squares (PLS) in R were used for supervised dimensionality reduction of miRNA expressions for dimensional separation of treatment groups.
Evaluation of multivariate effects of miRNA expressions related to treatments was performed with a nested cross-validation machine learning workflow assessing miRNAs as predictors and classifiers of treatments. miRNAs with a total variance <0.2 and missing values >30% were excluded as predictors. Data were partitioned into training (75%) and testing (25%) sets. Each set was z-normalized, and knn-imputation of missing values was performed on the training set. Thereafter, penalized regularised logistic regressions (Lasso; glmnet package in R), Random forests (ranger package in R), XGBoosted trees (xgboost package in R), and neural network, performed on both miRNAs and PCA-derived principal components as main variables (TensorFlow and Keras integration with R) were in parallel hyperparameter tuned. Hyperparameters for Lasso (penalty); Random Forest (number of variables included in each random tree and minimum n for split); XGBoosted trees (number of variables included in each tree, tree depth, loss reduction, learning rate, and minimum n for split) and neural network (number of hidden layers and penalty) were tuned with a Latin hypercube search approach. Tuning was performed with internal validation on 25 bootstraps of the training data with evaluation through the receiver operating characteristic (ROC) area under the curve (AUC). Optimal hyperparameters were used in the final models and performance was tested on hold-out testing data. This workflow procedure was repeated iteratively 100 times as randomized nested cross-validation with random partitioning of samples to training and testing set at each iteration to estimate the robustness of predictions with regards to random effects of partitioning. Model variable importance was assessed with coefficients (Lasso) and permutation (Random forest, XGBoosted trees) with the variable importance plots (VIP) package in R. Model performance was compared using random effects and Bayesian statistics with Stan [20] through specifying and fitting the models via the rstanarm package in R for posterior distributions of mean AUC and difference in AUC.
The CyTargetLinker plug-in tool (version 4.1.0) in Cytoscape (version 3.9.1) was used to predict miRNA target genes (linkset miRTarBase release 8.0). The stringApp (version 1.7) plug-in tool in Cytoscape was used to retrieve and filter for Gene Ontology (GO) annotations for the targeted genes.
RESULTS
One hundred and five patients were screened for eligibility, 62 met the criteria and were randomized to liraglutide or glimepiride. Basal characteristics of the study population are shown in Table 1. Treatment groups were well-balanced except for triacylglycerols and glycosylated hemoglobin which was higher in subjects randomized to liraglutide treatment. Treatment change of secondary outcomes after 18-week treatment showed no significant changes in clinical or echocardiographic parameters apart from body weight (–3.7 kg vs. –0.2 kg), waist circumference (–3.1 cm vs. –0.8 cm), and heart rate (6.3 bpm vs. –2.3 bpm) in liraglutide and glimepiride respectively, as shown in Table 2.

Treatment change of secondary outcomes during 18-week treatment
In total 2,632 different miRNAs were detected among the patient’s serum samples. Of these 683 miRNAs were expressed in at least 25% of the samples and 320 in at least 90% of the samples. Two hundred and three miRNAs with a total mean read count ≥50 were further evaluated for univariate differential expression and multivariate patterns in machine learning associated with treatment with liraglutide or glimepiride in individuals with T2DM. Additionally, we evaluated if the manifestation of cardiovascular disease or their gender has an impact on the miRNA expression.
Unsupervised discrimination of global variation of miRNA expression in patient serum before and after treatment
Unsupervised dimensional reduction with PCA and UMAP shows no apparent capture of global variation in principal components one to four associated with treatment groups (Fig. 1A and B). This was also true for gender and cardiovascular disease background (Supplementary Fig. 1). In addition, unsupervised Gaussian finite mixture model-based clustering shows no apparent clusters related to the treatment groups (Fig. 1C), an indication that treatment did not induce a large variation in miRNA expressions in blood.
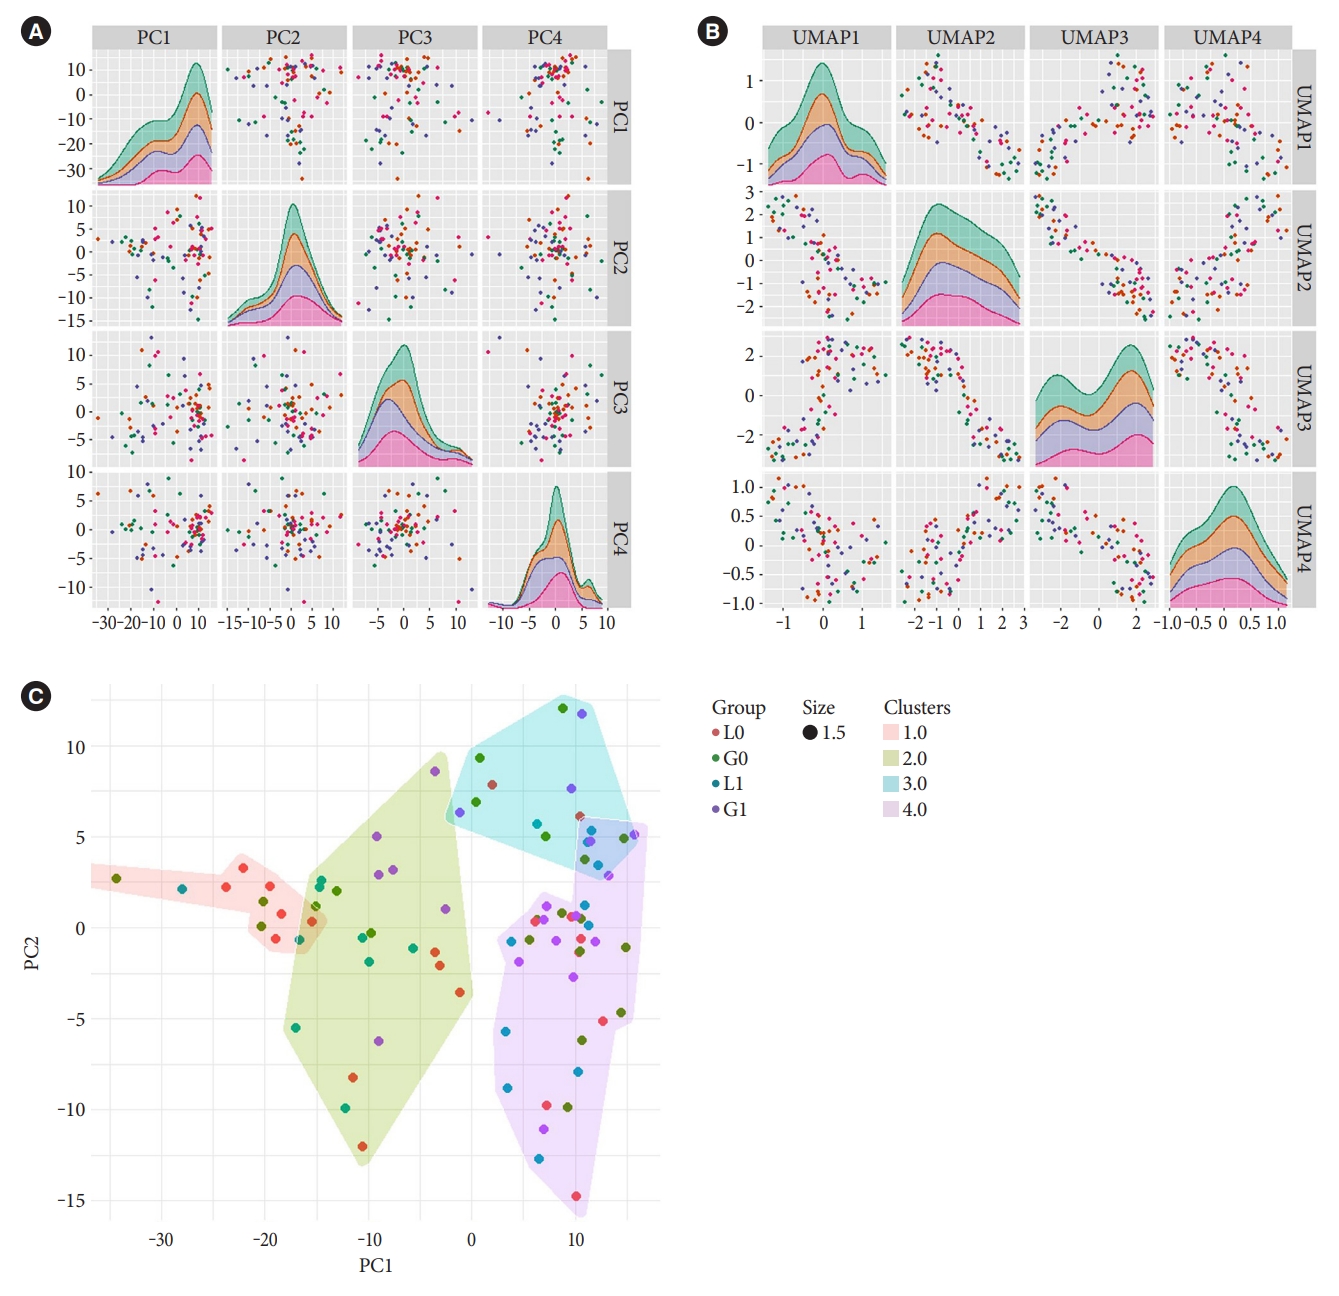
Distribution of variation in microRNA (miRNA) expression in samples with respect to treatments. Unsupervised dimensionality reduction of miRNA expressions with (A) principal component analysis (PCA) and with (B) uniform manifold approximation and projection (UMAP), with first four dimensions shown, and (C) Gaussian finite mixture model-based clustering of miRNA expressions into four clusters. Figures are overlaid with colour representing the treatment groups (before treatment with liraglutide [L0] or glimepiride [G0] and after treatment with liraglutide [L1] or glimepiride [G1]).
Differential univariate expression of miRNA in patient serum after treatments
Univariate analysis with patient paired design showed that glimepiride treatment significantly altered the expression of three circulating serum miRNAs: miR-206, miR-182-5p, and miR-766-3p (Fig. 2, Supplementary Table 1). These changes in miRNA expression were not dependent on either the sex of the patients or their cardiovascular disease background (data not shown). Treatment with liraglutide didn’t cause any significant changes in miRNAs in serum (Supplementary Table 2).

Univariate differential expression in microRNAs (miRNAs) before and after glimepiride treatment. (A) Volcano plot of miRNA log fold changes (FCs) and statistical significance show three differentially expressed miRNAs (red dots) further depicted in (B, C, D) box-violin plots with patient paired individual points overlaid. Statistical analysis performed with DESeq fitting patient paired binomial generalized linear models and Wald test for significance testing. Biological and statistical significance was set at a FC >1.5 and a Benjamini-Hochberg adjusted P<0.05, respectively. NS, not significant.
Linear mixed effect models show an increased performance with miR-206 and miR-182-5p on DFRI when controlling for gender, cardiovascular disease background and treatment. When added miR-206 and miR-182-5p significantly increased model R2 from 0.73 to 0.75 (P=0.028) and from 0.73 to 0.74 (P=0.019) respectively. However, only miR-182-5p, and not miR-206, show a significant model effect size (0.629, P=0.036; and 0.556, P=0.053, respectively). Analysis on SFRI shows no significant changes correlated to the miR-206, miR-182-5p, and miR-766-3p (data not shown).
Supervised discrimination of global variation of miRNA expression in patient serum before and after treatment
For evaluation of possible multivariate effects, supervised dimensional reduction with PLS and UMAP was performed and show partial separation between some of the treatment groups, especially with glimepiride treatment (Supplementary Fig. 2). This multivariate separation was further evaluated with supervised machine learning to find signatures for before and after treatment.
Multivariate expression patterns of miRNA in serum for discrimination of before and after treatment
The different machine learning algorithms used to model multivariate patterns between before and after treatment show a moderate predictive power of miRNAs to separate samples before and after glimepiride treatment. This was not observed for the liraglutide treatment (data not shown). Evaluation of model performances with posterior distributions of AUC (Fig. 3A) showed that the Lasso models had the best performance with an average iteration mean AUC of 0.68 (95% cofidence interval, 0.61 to 0.75) (Fig. 3B). The variable importance for the Lasso models was evaluated by the averaged iterated variable coefficients of all included miRNAs. The top 40 contributing miRNAs are presented in Fig. 3C. miR-182-5p and miR-766-3p, but not miR-206, were among the top 40 contributing miRNAs. However, they were not among the highest-ranked miRNAs. The two miRNAs with the highest positive coefficients were miR-3960 and miR-31-5p, and the highest negative coefficients were miR-3613-3p and miR-378a-3p. These were in the univariate analyses either not statistically significant or did not reach the cut-off for fold change, reflecting their dependence of multivariate co-expression of other miRNAs for combined predictive strength.
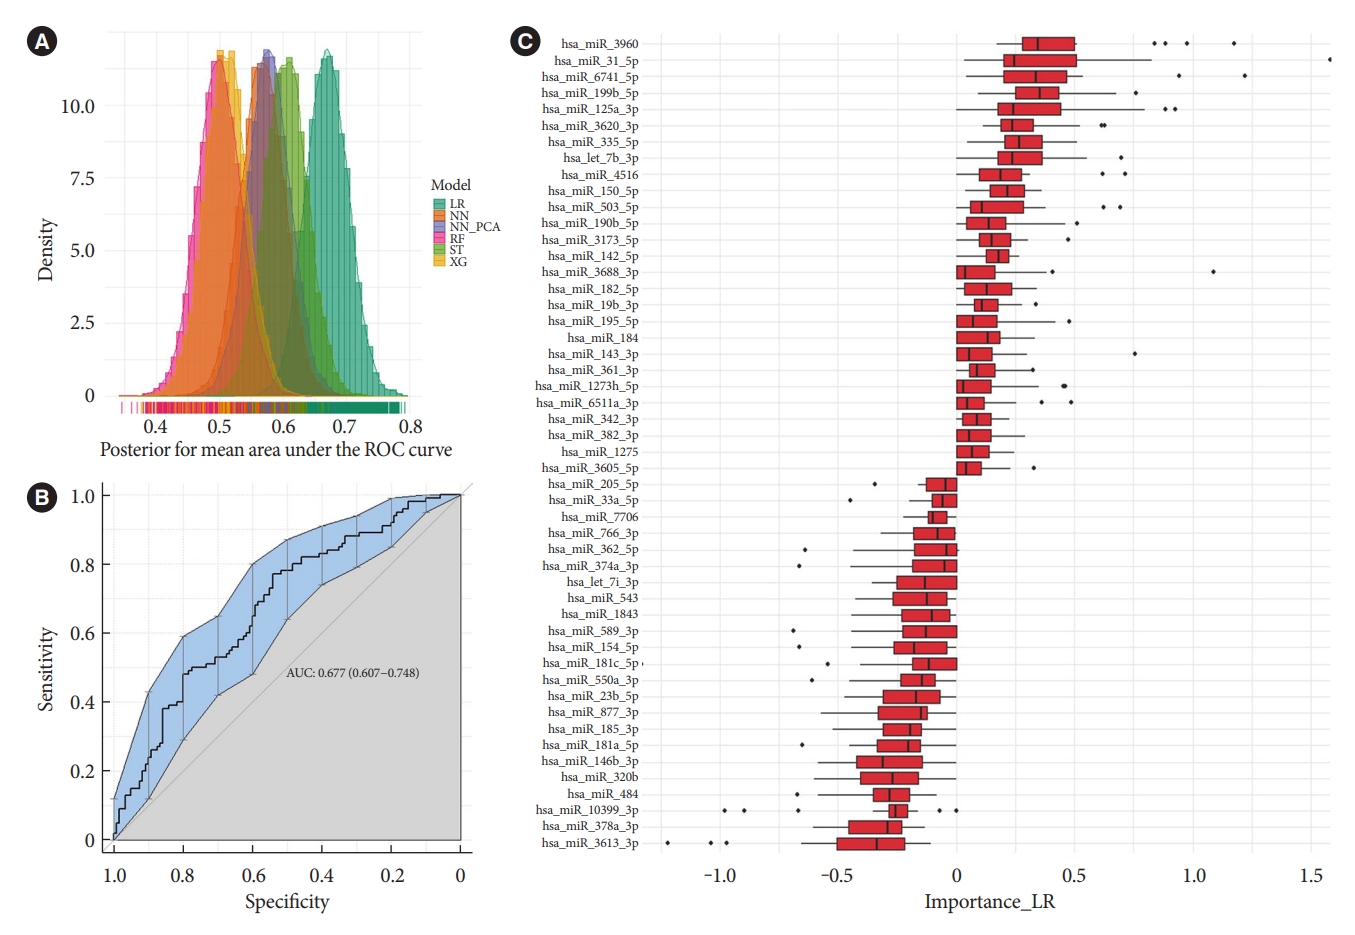
Machine learning multivariate classification of microRNA (miRNA) expression before and after glimepiride treatment. (A) Posterior distributions of receiver operating characteristic (ROC) and area under the curve (AUC) from penalized regularised logistic regressions (Lasso), Random forests, XGBoosted trees, and Neural network (performed on both miRNAs and principal component analysis [PCA]-derived principal components). (B) Show the ROC-curve and (C) show the averaged iterated variable coefficients of the top 40 contributing miRNAs for the Lasso models. LR, penalized regularised logistic regressions (Lasso); NN, Neural network; NN_PCA, Neural network on PCA-derived principal components; RF, random forest; XG, XGBoosted trees; ST, stack of LR, XG and RF.
Functional annotation and target interaction of differentially expressed miRNA
The miRNAs miR-206, miR-182-5p, and miR-766-3p that are seen to be differentially expressed with glimepiride have many biological targets that can be predicted with miRTarBase target analysis. Their involvement in processes and pathways associated with insulin signalling and signalling pathways in diabetes was given focus with target predictions of the miRNAs towards targets belonging to gene ontologies and pathways of relevance. miRTarBase predicted targets connected to insulin signalling/responses are shown in Fig. 4A and connected to advanced glycation endproduct/receptor for advanced glycation end product (AGE-RAGE) signalling pathway in diabetic complications are shown in Fig. 4B.
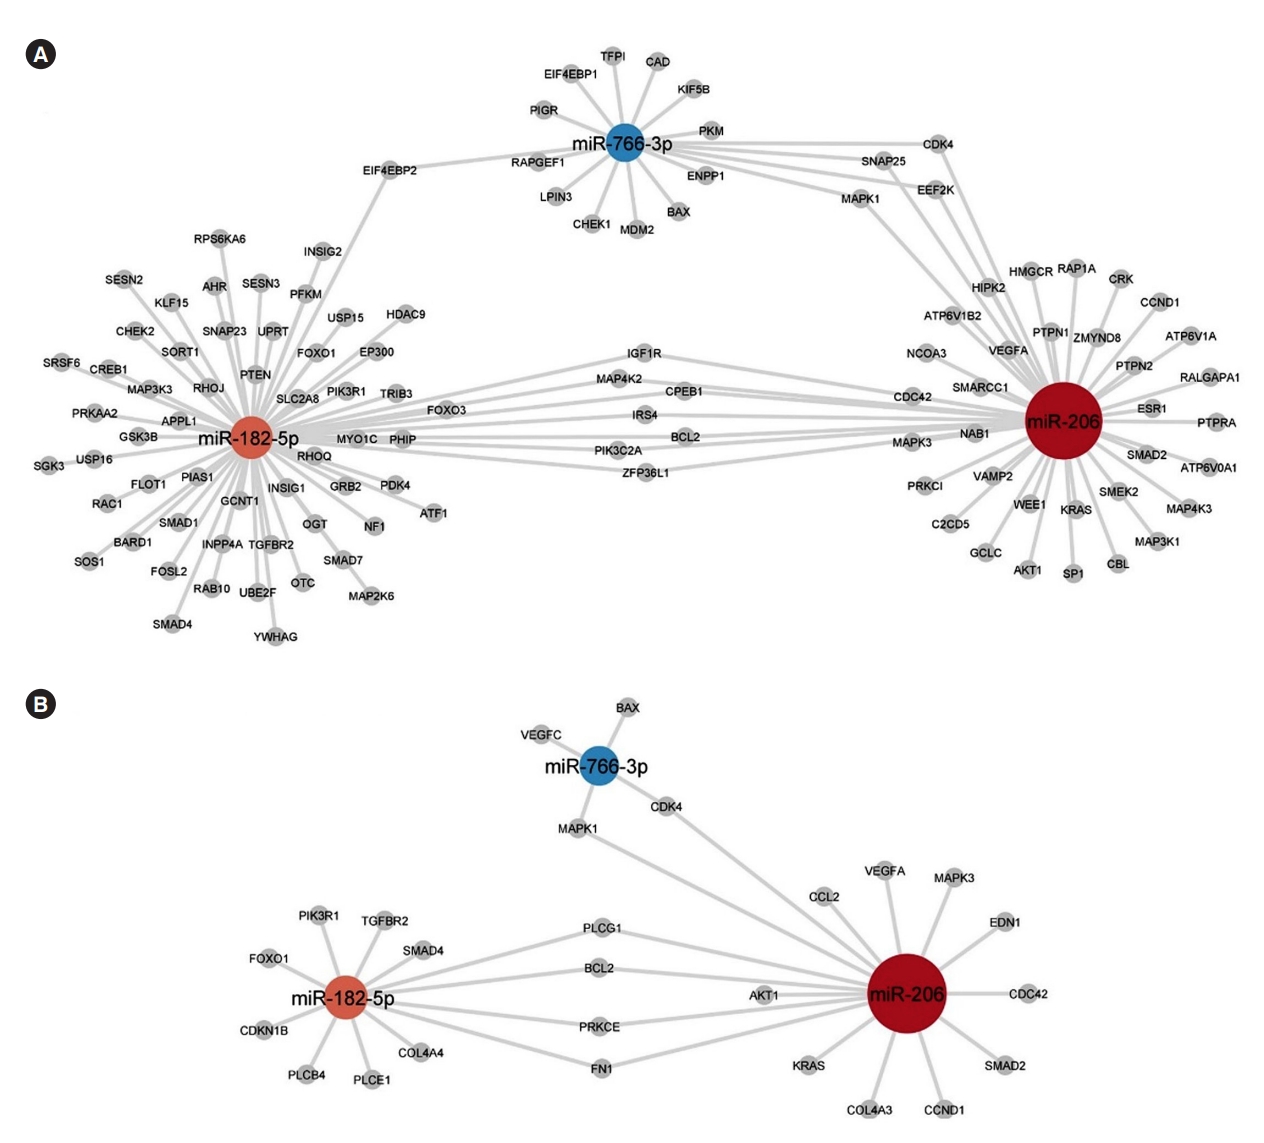
The three microRNAs (miRNAs) differentially expressed with glimepiride treatment; miR-206, miR-182-5p, and miR-766-3p, and their mRNA-associated targets with a focus on targets belonging to (A) the gene ontologies/WikiPathways “Cellular response to insulin stimulus” (GO:0032869), “Response to insulin” (GO:0032868), “Insulin signalling” (WP481), and “Insulin receptor signalling pathway” (GO:0008286), and (B) targets belonging to the Kyoto Encyclopedia of Genes and Genomes (KEGG) pathway “advanced glycation endproduct/receptor for advanced glycation end product (AGE-RAGE) signalling pathway in diabetic complications” (hsa04933). Node color of miRNAs reflect their fold change and edges reflects miRTarBase prediction towards gene products (grey nodes).
DISCUSSION
In this post hoc randomized control trial, we evaluated the effect of two different classes of glucose-lowering drugs, liraglutide and glimepiride, on the expression pattern of circulating miRNAs in people with T2DM before and after 3-month of treatment. The univariate results of our study show that glimepiride significantly changes serum levels of three miRNAs: miR-206, miR-182-5p, and miR-766-3p. Although a combined multivariate expression of miRNAs reaches a moderate level of machine learning predictive power, neither treatment appears to extensively affect the expression of circulating miRNAs in the present study.
miR-206 belongs to the myomiR family and is probably one of the most studied miRNAs today. Profiling of miRNA expression in different tissues showed that miR-206 was found to be primarily expressed in the skeletal muscle but also in the heart [21]. In skeletal muscle, this miRNA positively regulates muscle growth and differentiation and showed to be specifically induced during myogenesis [22]. In cardiomyocytes, an increase of the miR-206 expression was shown to negatively regulate apoptosis after ischemic injury [23]. It was also shown that an intracellular increase in miR-1/miR206 in vitro was able to promote high glucose-induced cardiac cell apoptosis [24].
The activity of miR-206 has also been shown in other tissues, such as pancreatic islets, brain, intestine, and liver where miR-206 in mice was strongly induced by a high-fat diet, and involved in the repression of the activity of the rate-limiting glucose sensor–glucokinase [25]. This study showed that miR-206 was involved in the regulation of an important glycolytic gene glucokinase, in the murine islets, thus indicating involvement in glucose homeostasis. However, this relationship between miR-206 and glucokinase has not been confirmed in humans [26].
miRNAs are acting intracellularly but their presence has been shown in different biological fluids including plasma and serum and is suggested as biomarkers for different physiological and pathological conditions [27-29]. Levels of circulating miR-206 were shown to be affected by several conditions such as muscle damage induced by physical exercise [30], muscular dystrophy [31], or amyotrophic lateral sclerosis [32] as well as cancer [33,34]. miR-206 has been suggested as a biomarker of disease development, especially in cancer patients. Also, cardiovascular diseases are shown to affect levels of miR-206. Decreased levels of circulating miR-206 have been associated with increased blood pressure in patients with left heart disease, LHD [35]. miR-206 together with let-7c-5p, miR-765, miR483-5p, and miR-31-5p were shown to be elevated in the plasma of patients with coronary heart disease [36]. Albeit, in several studies reporting the changes of miRNA levels in the serum/plasma levels in individuals with diabetes (reviewed in [37]), the levels of circulating miR-206 were not shown to be affected by this condition. Using both in vivo (mice) and in vitro (human hepatocytes) studies, Wu et al. [38] have shown miR-206 to be an effective inhibitor for gluconeogenesis and lipogenesis in studied models thus having therapeutic potential in the treatment of hyperglycemia and nonalcoholic fatty liver disease. The effect of mir-206 was shown to be mediated by protein tyrosine phosphatase non-receptor type 1-insulin receptor (PTPN1-INSR)/insulin receptor substrate 1 (IRS1) axis.
Studies have also established links between miR-182-5p and miR-766-3p and cardiovascular diseases. Elevated levels of miR-182-5p together with miR-199a-5p and miR-5187-5p were found to be associated with the presence of the unprotected left main coronary artery disease (uLMCAD) in patients with symptoms of coronary artery disease [39]. In a study aimed to investigate the diagnostic potential of miR-182-5p together with miR30a-5p, those miRNAs were shown to be associated with dysglycemia. Expression levels of miR-182-p were found to increase in individuals with prediabetes or screen-detected diabetes individuals; however, in individuals with T2DM expression of that miRNA was decreasing. This suggests that levels of that miRNA were decreasing with the duration of the disease [40,41]. This is in line with conclusions made by others [42] that also showed the miR-182 to be a potential modulator of the transcription factor Forkhead box protein O1 (FOXO1), known to regulate hepatic gluconeogenesis and glycogenolysis in response to insulin. miR-182 is a negative regulator of the FOXO1 protein and was suggested to reduce gluconeogenesis in a compensatory way during prediabetes but increase during T2DM.
miR-766-3p has previously been shown to be involved in cancer, be connected to aging, and have anti-inflammatory properties by reducing nuclear factor-κB activity [43-45]. T2DM individuals were having a lower expression of miR-766-3p compared to healthy subjects [46], but levels of that miRNA were positively affected by physical training [47]. In the study by Cao et al. [48], it was shown that miR-766-3p has its putative binding site in the sequence of long non-coding RNA LINC-P21 and that the levels of LINC-P21 and miR-766-3p expression were correlated in a reverse ratio in a pancreatic β-cell line INS-1. The study also concludes that LINC-P21 inhibits the proliferation of β-cells and decreases insulin secretion by competitively binding miR-766-3p and thus up-regulating another target of miR-766-3p—a nuclear receptor nuclear receptor subfamily 3 group C member 2 (NR3C2) gene.
Findings on drug-induced changes in plasma/serum miRNA levels are scarce. To our knowledge, only a few studies have evaluated the effect of glucose-lowering drugs on circulating miRNAs. Demirsoy et al. [49] in a targeted miRNA study shows that in subjects with T2DM, glucose-lowering treatment with metformin downregulated 13 different miRNAs in plasma samples (hsa-let-7e-5p, hsa-let-7f-5p, hsa-miR-21-5p, hsamiR-24-3p, hsa-miR-26b-5p, hsa-miR-126-5p, hsa-miR-129-5p, hsa-miR-130b-3p, hsa-miR-146a-5p, has-miR-148a-3p, hsa-miR-152-3p, hsa-miR-194-5p, hsa-miR-99a-5p). In addition, metformin has also been shown to significantly change the expression of miR-192, miR-140-5p, and miR-222 [50]. The results of the two studies are not confirmative and the analysis depth of miRNAs differ significantly between them. In the present study glimepiride and liraglutide was an add-on to metformin treatment, which may have demasked the effects of the metformin on circulating miRNAs. Also, in the present study, with a more in-depth characterisation of circulating miRNAs, none of the above miRNAs were significantly affected by glimepiride or liraglutide, in combination with metformin. However, differences in treatment’s impact on the expression of circulated miRNA might depend on the differences in mechanism action between the different glucose-lowering drugs. Metformin decreases blood glucose through inhibition of mitochondrial complex I activity and decrease of adenosine triphosphate (ATP) production in hepatocytes, leading to activation of adenosine monophosphate (AMP) activated protein kinase-activated protein kinase and inhibition of fructose-1,6-bisphosphatase enzyme. Glimepiride blocks ATP-sensitive potassium channels (KATP channels) by binding to sulfonylurea receptors 1 and 2 on pancreatic β-cells. Blockage of (KATP channels) causes depolarisation of the cell membrane and release of insulin granules. In contrast, liraglutide increases intracellular production of cyclic AMP which in turn stimulates the glucose-dependent release of insulin and glucose-dependent inhibition of glucagon. Despite knowledge about the mechanisms of action of those drugs it is still difficult to explain why glimepiride changes the expression of the discussed above miRNA. Interestingly, expression levels of miR-186-5p were previously shown to be insensitive to the treatment with metformin and/or insulin [41].
The current study was conducted on a relatively small number of patients which, with respect to high interindividual variations in circulating miRNAs, might introduce some uncertainty in the results with regards to subtle changes after treatment. In addition, a longer treatment period with glucose-lowering drugs may also result in more pronounced differential expressions of the circulating serum miRNA. Nevertheless, the in-depth characterisation of circulating miRNAs and the interesting results obtained in the current study prompts the necessity of further studies to evaluate mechanisms that involve miRNAs in patients’ response to glimepiride and liraglutide.
In conclusion, the present study indicates that glucose-lowering drugs differently affect the expression of circulating miRNAs in serum in individuals with T2DM. More studies are required to investigate possible mechanisms by which glimepiride is affecting the expression of circulating miRNAs. Since the miRNAs, studied in the present study, are suggested as potential biomarkers in patients with different diseases, further studies on the effect of glimepiride on plasma levels of those biomarkers are much needed.
SUPPLEMENTARY MATERIALS
Supplementary materials related to this article can be found online at https://doi.org/10.4093/dmj.2022.0342.
Statistical univariate analysis with patient paired design for before and after glimepiride treatment
Statistical univariate analysis with patient paired design for before and after liraglutide treatment
Distribution of variation in microRNA (miRNA) expression in samples with dimensionality reduction of miRNA expressions with respect to (A) gender and (B) cardiovascular disease background. Figures are overlaid with colour representing the groups (male or female and with cardiovascular disease background [CVD] or without [NO_CVD]).
Distribution of variation in microRNA (miRNA) expression in samples with respect to treatments. Supervised dimensionality reduction of miRNA expressions with (A) partial least squares (PLS) and with (B) supervised uniform manifold approximation and projection (UMAP), with first four dimensions shown. Figures are overlaid with colour representing the treatment groups (before treatment with liraglutide [L0] or glimepiride [G0] and after treatment with liraglutide [L1] or glimepiride [G1]).
Notes
CONFLICTS OF INTEREST
Nikolai N. Scherbak and Robert Kruse has nothing to declare. Johan Jendle has received grants from Medtronic and Novo Nordisk; and lecture/other fees from Abbott, AstraZeneca, Boehringer Ingelheim, Eli Lilly, Nordic Infucare, Novo Nordisk, and Sanofi. Thomas Nyström as received unrestricted grants from AstraZeneca and NovoNordisk and has served on national advisory boards of Amgen, Novo Nordisk, Sanofi-Aventis, Eli Lilly, MSD, and Boehringer Ingelheim.
AUTHOR CONTRIBUTIONS
Conception or design: N.S., T.N., J.J.
Acquisition, analysis, or interpretation of data: N.S., R.K., T.N., J.J.
Drafting the work or revising: N.S., R.K., J.J.
Final approval of the manuscript: N.S., R.K., T.N., J.J.
FUNDING
This study was investigator-initiated and investigator-designed. The investigators received an unrestricted grant from Novo Nordisk A/S, but the company was not involved in data collection, study management, analysis, or interpretation of data. Nor was the company involved in the decisions regarding the submission of the manuscript.
Acknowledgements
None