A Multicentre, Multinational, Open-Label, 52-Week Extension Study of Gemigliptin (LC15-0444) Monotherapy in Patients with Type 2 Diabetes Mellitus
Article information

Abstract
The purpose of this extension study was to assess the long-term efficacy and safety of gemigliptin 50 mg in patients with type 2 diabetes mellitus (T2DM). Patients with T2DM who had completed the initial 24-week study comparing gemigliptin monotherapy with placebo were eligible to enrol. In the open-label, 28-week extension study, all enrolled patients received gemigliptin, regardless of the treatment received during the initial 24-week study period. The mean reduction±standard deviation (SD) in glycosylated hemoglobin (HbA1c) observed after 24 weeks of treatment (–0.6%±1.1%) was further decreased for the gemi-gemi group and the mean change in HbA1c at week 52 from baseline was –0.9%±1.2% (P<0.0001). For the pbo-gemi group, HbA1c decreased after they were switched to gemigliptin, and the mean change in HbA1c at week 52 from baseline was –0.7%±1.2% (P<0.0001). Furthermore, the overall incidence of adverse events demonstrated that gemigliptin was safe and well tolerated up to 52 weeks.
INTRODUCTION
Dipeptidyl peptidase-4 (DPP-4) inhibitors are a class of oral anti-diabetic agents that selectively inhibit the DPP-4 enzyme that degrades the incretin hormones glucagon-like peptide-1 and glucose-dependent insulinotropic peptide [1]. In the general recommendations outlined by American Diabetes Association and European Association for the Study of Diabetes, DPP-4 inhibitors are positioned as a second-line add-on to metformin or as an alternative anti-hyperglycaemic therapy in patients for whom the use of metformin is contraindicated [2]. DPP-4 inhibitors, when administered as monotherapy, were significantly more efficacious in reducing mean glycosylated hemoglobin (HbA1c) from baseline compared to placebo [3]. Furthermore, DPP-4 inhibitors have additive glucose-lowering effects when combined with other oral agents used to treat diabetes [3]. The major benefit of using DPP-4 inhibitors is their low risk of hypoglycaemia, which is expected from their glucose-dependent mechanism of action [4,5].
Gemigliptin is a potent, selective DPP-4 inhibitor, which is indicated as an adjunct to diet and exercise to improve glycaemic control in adults with type 2 diabetes mellitus (T2DM). The present 52-week study was conducted to evaluate the longterm efficacy and safety of gemigliptin when given as monotherapy in patients with T2DM. Results of the initial 24-week, randomized, double-blind, placebo-controlled phase of this study, in which patients with T2DM were given either gemigliptin 50 mg or placebo, have been previously reported [6]. The placebo-subtracted change from baseline in HbA1c was –0.7% (95% confidence interval, –1.04 to –0.37), indicating superior glycaemic control of gemigliptin over placebo [6]. Furthermore, the proportion of patients achieving HbA1c <7% at week 24 was greater in the gemigliptin group (43.0%) when compared with the placebo group (16.0%), with an adverse events (AEs) profile similar to that of the placebo group [6]. In this paper, we report the results of the 28-week, open-label, exploratory investigation, which was conducted subsequently after the completion of the initial 24-week, to assess the longterm safety and efficacy of gemigliptin monotherapy.
METHODS
Patients with T2DM who completed the initial 24-week phase of the 52-week study, and who had consented to receive further treatment with gemigliptin, could enrol in the 28-week extension study. Methodologies for the randomized treatment phase of the study and inclusion and exclusion criteria have been previously reported [6]. In brief, patients between the ages of 18 and 75 years, with a history of T2DM and HbA1c between 7% and 11%, were enrolled. After the initial 24-week, placebo-treated patients were switched to receive gemigliptin for another 28 weeks, while the patients who were randomly allocated to receive gemigliptin at baseline continued with the same treatment for the entire 52 weeks. Patients who received gemigliptin during both the initial and extension phases were referred to as the ‘gemi-gemi group,’ and patients who received placebo during the initial phase and gemigliptin during the extension phase were referred to as the ‘pbo-gemi group’ (ClinicalTrials.gov Identifier: NCT01601990).
This study was carried out in accordance with the ethical principles laid down in the Declaration of Helsinki and Good Clinical Principles issued by Internal Conference on Harmonization. This study was approved by the Institutional Review Boards of Asan Medical Center (IRB No. 2009-0571), Nowon Eulji Medical Center (IRB No. 09-69), Inha University Hospital (IRB No. 10-06), Hallym University Kangdong Sacred Heart Hospital (IRB No. 09-99). Written informed consent was obtained from all patients.
The primary efficacy endpoint of the extension study was change in HbA1c from baseline at week 52. Key secondary endpoints included the proportion of patients achieving HbA1c <7% and <6.5% at week 52 and changes in fasting plasma glucose (FPG) at week 52 relative to baseline. Please see Table 1 for a complete list of efficacy endpoints measured.

Summary of changes in efficacy parameters at week 52 from baseline (FAS)
Efficacy was analysed with the full analysis set and safety analyses were based on a safety set. All continuous and categorical efficacy variables were summarized using descriptive statistics. Continuous variables were described by the mean±standard deviation (SD), and assessed by a paired t-test (or Wilcoxon signed rank test), whereas categorical variables were presented as numbers of patients expressed as percentages. All statistical analyses were performed using SAS version 9.1 (SAS Institute, Cary, NC, USA). With the exception of oral glucose tolerance test (OGTT) parameters, missing efficacy variables were imputed using the last observation carried forward method.
RESULTS
In the initial randomized, placebo-controlled study, a total of 182 patients (90 and 92 patients in the gemigliptin and placebo groups, respectively) were enrolled, and 167 patients completed the 24-week of treatment. Of the original population, 165 patients consented to continue the study and receive further treatment of gemigliptin 50 mg for 28 weeks: 158 of these patients completed the entire study. Baseline characteristics and demographics were generally similar for both study groups.
Efficacy results
At week 24, a clinically and statistically significant decrease in HbA1c was observed when treated with gemigliptin 50 mg [6]. No notable change in HbA1c from baseline was observed in the placebo group during the initial 24-week period [6]. During the extension period, a further decrease in HbA1c was observed for the gemi-gemi group, and the mean change±SD in HbA1c at week 52 from baseline was statistically significant (–0.9%± 1.2%, P<0.0001) (Fig. 1A). For the pbo-gemi group, HbA1c decreased after the placebo-treated patients were switched to gemigliptin. The mean change in HbA1c at week 52 from baseline was –0.7%±1.2%, which is similar to the level attained (–0.6%±1.1%) in patients who had received gemigliptin during the initial 24-week double-blind phase of the trial. Furthermore, the proportion of patients achieving HbA1c level of <7% and <6.5% increased with the gemi-gemi group at 52 weeks (HbA1c <7%, 41.3% at week 24 vs. 52.5% at week 52; HbA1c <6.5%, 16.3% at week 24 vs. 26.3% at week 52). In the pbo-gemi group, the proportion of patients reaching HbA1c level of <7% almost doubled (21.1% at week 24 vs. 46.5% at week 52), and those reaching <6.5% increased 6-fold (4.2% at week 24 vs. 23.9% at week 52) after 52 weeks (Fig. 1B). Continued treatment with gemigliptin for 52 weeks also resulted in a significant reduction in FPG. Furthermore, a significant decrease in homeostasis model assessment of insulin resistance from baseline at week 52 was observed in the gemi-gemi group (P=0.0065), suggestive of increased insulin sensitivity. Gemigliptin also reduced postprandial glucose and fasting triglyceride, while significantly increasing high-density lipoprotein in both study groups from baseline at week 52.
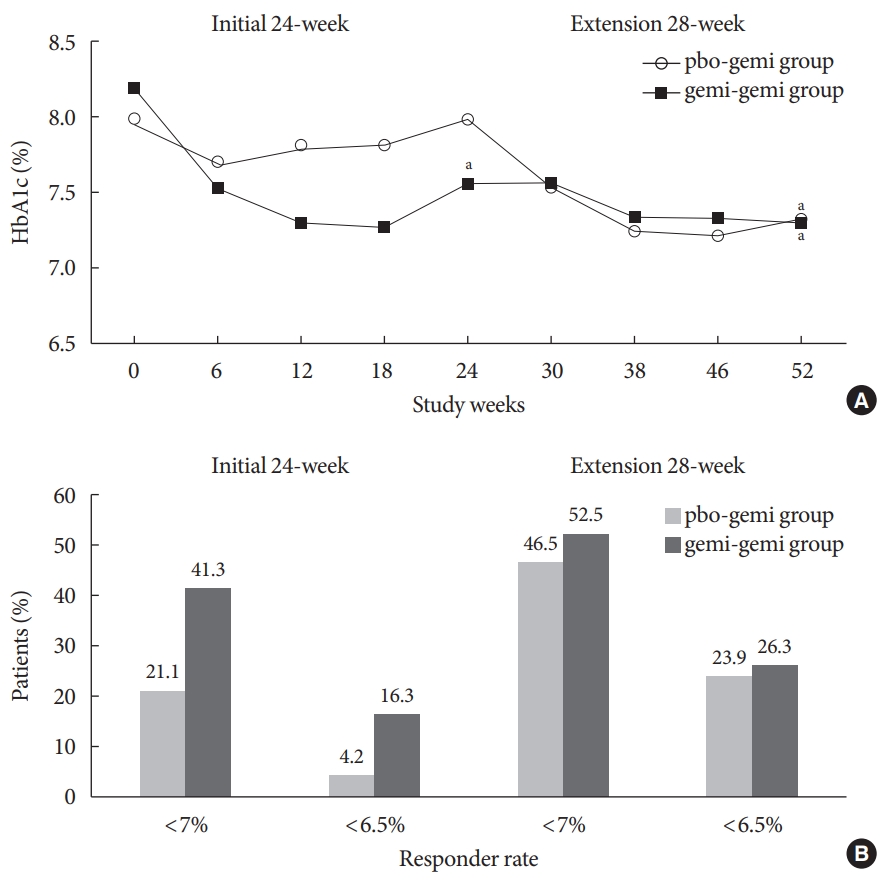
(A) Mean glycosylated hemoglobin (HbA1c) over time (full analysis set [FAS]). (B) Percentages of responders achieving HbA1c <7% or <6.5% (FAS). pbo-gemi group=placebo→gemigliptin; gemi-gemi group=gemigliptin→gemigliptin. aP<0.0001.
At week 52, data from 27 patients were available for analysis of OGTT; however, the number of patients was too small, and the findings from these data were insufficient to draw any conclusive interpretation. Detailed results of the efficacy endpoints are demonstrated in Table 1.
Safety results
Overall, the incidence of AEs was similar between the study groups (58.0% and 60.9% in the pbo-gemi and gemi-gemi groups, respectively), with adverse drug reactions occurring in small percentages of patients. Most of the AEs were mild in severity and resolved without sequelae. No patient was withdrawn because of AEs or serious AEs, and no deaths occurred during this study. Clinically meaningful abnormalities in electrocardiograms or vital signs were not found.
DISCUSSION
In this 28-week extension study, the gemigliptin-mediated glycaemic control observed during the initial phase was well maintained, and gemigliptin was well tolerated for up to 52 weeks in patients with T2DM. In general, the HbA1c reduction associated with this class of therapies demonstrates a reduction of approximately 0.5% to 1% when used as monotherapy [3]. The glycaemic durability mediated by gemigliptin was also evident in the level of FPG at week 52, which was reduced by twice as much when compared to the result obtained at week 24.
Overall, long-term treatment with gemigliptin was well tolerated. The benign safety profile of DPP-4 inhibitors has been documented in several meta-analyses, and the safety results obtained in this study further contribute to the available evidence [7-9]. One of the clinical advantages of DPP-4 inhibitors includes a low risk of hypoglycaemia [3]. In agreement with the published findings to date, the incidence of hypoglycaemia was relatively low with gemigliptin, occurring only in two patients in the gemi-gemi group.
The limitations of our study include the absence of a control group in the extension period, as the long-term efficacy and safety were assessed in two study groups, both of which received gemigliptin. Nonetheless, placebo-controlled efficacy and safety data up to 24 weeks are available in the prior publication of this study. Moreover, the ability to draw a firm conclusion from the OGTT was diminished because of the limited number of patients who consented to undergo and completed the OGTT. Nevertheless, the findings of this study provide strong evidence for the long-term efficacy and safety of gemigliptin 50 mg monotherapy up to 52 weeks in patients with T2DM.
Notes
CONFLICT OF INTEREST
No potential conflict of interest relevant to this article was reported.
AUTHOR CONTRIBUTIONS
Conception or design: S.H.B.
Acquisition, analysis, or interpretation of data: K.W.M., S.K.G., J.Y.P., V.K.S., P.K.A., D.M.K., Y.S.K.
Drafting the work or revising: S.J.Y.
Final approval of the manuscript: S.J.Y., K.W.M., S.K.G., J.Y.P., V.K.S., P.K.A., D.M.K., Y.S.K., S.H.B.
FUNDING
The study was funded by LG Chem, Ltd., Seoul, Republic of Korea, the manufacturer of gemigliptin.
Acknowledgements
The authors wish to thank all the investigators and patients for their participation in this study. The authors also thank Yoo Hyun Won for medical writing support during the preparation of this manuscript.