- Current
- Browse
- Collections
-
For contributors
- For Authors
- Instructions to authors
- Article processing charge
- e-submission
- For Reviewers
- Instructions for reviewers
- How to become a reviewer
- Best reviewers
- For Readers
- Readership
- Subscription
- Permission guidelines
- About
- Editorial policy
Articles
- Page Path
- HOME > Diabetes Metab J > Volume 44(2); 2020 > Article
-
Original ArticleBasic Research Combination of Probiotics and
Salvia miltiorrhiza Polysaccharide Alleviates Hepatic Steatosis via Gut Microbiota Modulation and Insulin Resistance Improvement in High Fat-Induced NAFLD Mice -
Wei Wang1,2
 , Ai-Lei Xu2, Zheng-Chao Li1, Yi Li2, Shun-Fu Xu2, Hua-Chao Sang2, Fachao Zhi1
 -
Diabetes & Metabolism Journal 2020;44(2):336-348.
DOI: https://doi.org/10.4093/dmj.2019.0042
Published online: December 3, 2019
1Guangdong Provincial Key Laboratory of Gastroenterology, Department of Gastroenterology, Institute of Gastroenterology of Guangdong Province, Nanfang Hospital, Southern Medical University, Guangzhou, China.
2Department of Gastroenterology, Sir Run Run Hospital, Nanjing Medical University, Nanjing, China.
- Corresponding author: Fachao Zhi. Guangdong Provincial Key Laboratory of Gastroenterology, Department of Gastroenterology, Institute of Gastroenterology of Guangdong Province, Nanfang Hospital, Southern Medical University, Guangzhou, No. 1838, Guangzhou Avenue North Rd, Baiyun District, Guangzhou 510515, China. zhifc41532@163.com
Copyright © 2020 Korean Diabetes Association
This is an Open Access article distributed under the terms of the Creative Commons Attribution Non-Commercial License (http://creativecommons.org/licenses/by-nc/4.0/) which permits unrestricted non-commercial use, distribution, and reproduction in any medium, provided the original work is properly cited.
ABSTRACT
-
Background
- Nonalcoholic fatty liver disease (NAFLD) increases the risk of hepatocellular carcinoma, which is currently the leading cause of obesity-related cancer deaths in middle-aged men.
-
Methods
- Probiotics with lipid-lowering function were screened from the fecal microbiota of healthy adults. Polysaccharide from different sources was screened for improving insulin resistance. The combination of probiotics and Salvia miltiorrhiza polysaccharide (LBM) was investigated for alleviating hepatic steatosis.
-
Results
- First, Bifidobacterium bifidum V (BbV) and Lactobacillus plantarum X (LpX) were obtained from the fecal microbiota of healthy adults. Second, to improve insulin resistance, a Salvia miltiorrhiza Bunge polysaccharide showing good performance in reducing insulin resistance was obtained. The liver total cholesterol (TC) and total triglyceride (TG) levels and the serum levels of free fatty acid, alanine transaminase, aspartate transaminase, low density lipoprotein cholesterol, TG, and TC can be significantly reduced through supplementation with LpX-BbV (LB) in NAFLD mice. Interestingly, the function of the probiotic LB can be enhanced by S. miltiorrhiza Bunge polysaccharide. Furthermore, the gut microbiota was modulated by LpX-BbV+S. miltiorrhiza Bunge polysaccharide (LBM). The lipopolysaccharide concentration of the LBM group was decreased by 73.6% compared to the NAFLD group. Ultimately, the mRNA concentrations of the proinflammatory cytokines (tumor necrosis factor α, interleukin 1β [IL-1β], and IL-6) decreased with LB and LBM treatment.
-
Conclusion
- The results of this this study indicate that the LBM combination can be used as a therapeutic for ameliorating NAFLD via modulating the gut microbiota and improving insulin resistance.
- Nonalcoholic fatty liver disease (NAFLD) is characterized by hepatic steatosis in the absence of a history of significant drinking (alcohol) or other known history liver diseases. NAFLD resembles alcohol-induced fatty liver damage, which can develop into nonalcoholic steatohepatitis (NASH) and, eventually, hepatocellular carcinoma [1]. NAFLD is the most common cause of chronic liver disease worldwide. Approximately 20% to 30% of adults in developed countries suffer from NAFLD [2], and the prevalence of NAFLD in obese adults and those suffering from type 2 diabetes mellitus has increased to 75% and 50% to 75%, respectively [34]. NAFLD is a multifactorial disease [5]. Inflammatory, environmental, metabolic, and various genetic factors and diets (the most important factor) have been considered in its pathogenesis. Up to 80% of obese people suffer from NAFLD disease [67]. NAFLD is a new challenge in the field of modern medicine. There are two routes to relieve NAFLD: one route is inhibiting triglyceride (TG) synthesis, and the other one is promoting the metabolism of TGs. Hepatic steatosis can be improved by inhibiting lipid synthesis and promoting fatty acid oxidation, especially β-oxidation [2].
- NAFLD is an acquired metabolic stress-induced liver injury associated with insulin resistance and genetic susceptibility [89]. Endogenous ethanol [10], gut microbiota [5], and hepatic tumor necrosis factor α (TNF-α) [11] play important roles in the pathogenesis of NAFLD. Systemic inflammation can be induced by high-fat diets (HFDs); insulin resistance, weight gain, and nonalcoholic fatty liver can be caused by disturbed metabolic homeostasis and gut microbial derangements. In patients with fatty liver, intestinal bacterial overgrowth is common [1213]. Intestinal permeability is associated with a fatty liver. The risk of spontaneous bacterial peritonitis can be increased by the increased intestinal permeability [14]. In addition, the bacterial endotoxin has been considered as a hepatotoxin [15], which is produced by gram-negative bacteria. Considerable evidence shows that the balance of gut microbiota and insulin resistance is considered a key role in the pathogenesis of NAFLD and NASH [516].
- Fortunately, accumulating evidence has shown that probiotics are able to inhibit harmful bacteria and improve gastrointestinal barrier function [17]. In particular, various Lactobacilli isolates attenuated liver pathology via stabilization of the intestinal barrier and anti-inflammatory actions [18]. A study demonstrated that alanine transaminase (ALTase), aspartate transaminase (ASTase), TNF-α, and total cholesterol (TC) of NAFLD patients were reduced by Lactobacillus, Bifidobacterium, and Streptococcus [19]. Previous studies found that the serum lipid profiles can be influenced by Lactobacillus and Bifidobacterium [20].
- Probiotics should impart the ability to tolerate gastric acidity and bile toxicity, survive under stressed conditions of the intestine and have antimicrobial effects against pathogens [21]. In this study, we attempt to relieve NAFLD by blocking TG synthesis (or enhancing TG metabolism) and reducing insulin resistance. The probiotics from the fecal microbiota of healthy adults were screened for cholesterol and TG clearance. Moreover, polysaccharides were also screened for insulin resistance improvement. We aim to quickly establish methods for probiotic screening, and the effect of a probiotic combination (Lactobacillus plantarum+Bifidobacterium bifidum+polysaccharide) on the mitigation of NAFLD was examined.
INTRODUCTION
- Isolation of probiotics from fecal microbiota of healthy adults
- Samples were collected from fecal microbiota in healthy adults. To ensure general health, the vital signs of volunteers were assessed and inclusion criteria were as follows: (1) 20 to 30 years of age; (2) free of known gastrointestinal and metabolic diseases, no history of gastrointestinal or metabolic disorders; (3) avoid taking medications; (4) limit alcohol consumption; (5) agree to avoid any changes in chronic medications; (6) willing to fill out all necessary research questionnaires and donate stool specimens; and (7) voluntary signing of written informed consent prior to participation in the study. Stool samples were harvested in sterile transparent-glass tubes (20 mL) and stored at 4℃. Stools were diluted by 10−4 to 10−6 with sterilized saline. Then, 50-µL dilutions were spread onto the MRS (de MAN, ROGOSA and SHARPE) broth, and MRSP (MRS broth was added with 1.8 mmol/L sodium thioglycolate, 2.8 mmol/L L-cysteine hydrochloride, and 0.9 mmol/L CaCl2) and M17 agar plates in anaerobic incubation at 37℃ for 48 hours.
- Probiotics and polysaccharide screening
- The cholesterol-lowering capability of the candidate strains determined by the ferric ammonium sulfate [2223]. Briefly, isolates were inoculated (1%, v/v) into MRSC broth (MRS broth supplemented with 1.0 g/L cholesterol) and incubated at 37℃ for 48 hours anaerobically. Next, 200-µL cultures were mixed with 4,800 µL ethanol after incubation. Then, the cells were removed by centrifugation (4,500 rpm, 20 minutes) at 4℃. Next, 4 mL of supernatant was slowly added to 2 mL of ferric ammonium sulfate reagent (Aladdin, Shanghai, China) and mixed well. The absorbance of the supernatant was measured by a spectrophotometer (Shimadzu, Kyoto, Japan) at 560 nm. The uninoculated samples were used as a negative control. Cholesterol clearance (CC) was calculated by the following formula: CC=[(Ao−A)/Ao]×100%, where Ao and A are the absorbance of uninoculated and inoculated samples, respectively.
- The TG-reducing activity was tested according to the Saravanan and Ponmurugan [24] method. Isolates were inoculated (1%, v/v) into 25 mL of MRST broth (MRS broth supplemented with 1.0 g/L TG) and incubated at 37℃ for 48 hours. Samples cultured in MRS medium were used as a negative control. The supernatant of the cultures obtained by centrifugation (4,500 rpm, 20 minutes, 4℃) was saponified by adding 0.5 mL saponification reagent (50 g of potassium hydroxide, 400 mL isopropanol, 600 mL distilled water) followed by 0.5 mL of acetylacetone reagent (0.75 mL of acetylacetone, 40 mL of isopropanol, 60 mL distilled water). Evenly mixed mixtures were kept at 65℃ for 1 hour in an oil bath and cooled. The blank control and a series of standard concentrations of triolein were treated using the same method, and absorbance at 420 nm was read: C×T=cholesterol reduction rate (%)×TG reduction rate (%).
- Polysaccharides from Dendrobium officinale, Talinum triangulare, and other sources were prepared according to the report [25]. Briefly, the D. officinale or other medicinal plant powder (20 g) was boiled three times with 600 mL distilled water for 3 hours. The polysaccharide was obtained by ethanol precipitation. After an 8-hour fast, mice were injected with glucose (3 g/kg), and after 15 minutes of glucose loading, an equal amount of polysaccharides was given by intragastric administration for 4 weeks. After the last administration, all the mice were fasted strictly but allowed free access to water as usual for 4 hours. Blood was collected for measurement of fasting glucose and insulin levels 12 hours after the last polysaccharide administration.
- An insulin enzyme-linked immunosorbent assay (ELISA) kit (TSZ, San Francisco, CA, USA) was used to determine the fasting insulin (FINS). To select the polysaccharide with a good performance on reducing insulin resistance, the insulin sensitivity index (ISI) was calculated according to the following formulas: ISI=Ln [1/(FBG×FINS)] [2627], where FBG was the level of fasting blood glucose (mg/dL) and FINS was the level of FINS (mIU/L). The index of insulin resistance was calculated by the following formulas [28]: homeostasis model assessment of insulin resistance (HOMA-IR)=FINS (mIU/L)×FBG (mmol/L)/22.5.
- Screening and identification of the candidate strains
- The effect of bile salts on the growth of these tested strains was carried out using a method described by Bao et al. [29]. After culturing in MRS broth at 37℃ for 12 hours, the bacterial concentration was adjusted to 108 colony-forming unit (CFU)/mL. Afterward, samples were inoculated into (1%, v/v) MRSB broth (MRS broth supplemented with 0.3% bile salts [oxgall]). Samples inoculated into MRS broth were used as controls. Strains were incubated anaerobically at 37℃ for 24 hours. To monitor bacterial growth, the optical density (OD620nm) was measured with a spectrophotometer. Survival percentage (%)=S/So×100%, where S was the OD620nm of the MRSB culture and So was the OD620nm of the MRS culture (control). Genomic DNA of the strain was extracted and amplified by polymerase chain reaction (PCR) according to the method of Huang et al. [30]. After cloning, the candidate strains were identified by DNA sequencing (Sangon Biotech, Shanghai, China) [31], and the sequence was compared to the National Center for Biotechnology Information (NCBI) database.
- Oral glucose tolerance test and insulin tolerance test
- Oral glucose tolerance tests (OGTTs) were measured at 0 to 6 weeks after treatments. Glucose load (2.0 g/kg of body weight) was conducted after 12 hours of fasting by oral gavage. After glucose administration, blood samples were collected at 0, 15, 30, 60, 90, and 120 minutes. Concentrations of glucose were measured, and the total glucose area under the curve (AUCglucose) were calculated. The insulin tolerance test (ITT) was completed after 6 hours of fasting. Next, 1.5 IU/kg insulin was infused into mice, and glucose was measured intraperitoneally. The constant rate for glucose disappearance during the ITT (KITT) was calculated using the formula 0·693/t1/2, where t1/2 was calculated from the slope of the least square analysis of the blood glucose levels during the linear decay phase of decline.
- Mice and treatments
- Forty male C57BL/6N mice (pathogen-free) were purchased from the Shanghai Laboratory Animal Center (Shanghai, China). The average initial body weight of the mice was approximately 18.5 g. The mice were housed in clean, sterile, polypropylene cages under controlled conditions with a room temperature of 20℃ to 24℃ and a cycle of 12/12 hours light-dark. Moreover, the experimental group and the control group were housed under the same conditions. During the first week, all mice were fed the same normal diet (ND). Afterward, the mice were randomly divided into four groups (n=10/group). The ND group received the normal diet, while the HFD group received the HFD diet; the HFD+(L. plantarum X [LpX]-B. bifidum V [BbV] [LB]) group received an HFD diet supplemented with LB via intragastric administration, and the HFD+(LpX-BbV+Salvia miltiorrhiza Bunge polysaccharide [LBM]) group received an HFD supplemented with LBM via intragastric administration. LB was a mixture of 1×10⁸ CFU/mL of LpX and 2×10⁸ CFU/mL BbV; LBM was composed of LB (1×10⁸ CFU/mL LpX+2×10⁸ CFU/mL BbV) plus S. miltiorrhiza Bunge polysaccharide (50 mg/kg/day). After 30 minutes of LB administration, S. miltiorrhiza Bunge polysaccharide was given by intragastric administration. After the end of the experiment, all mice were sacrificed after fasting for 12 hours. The mice's livers were collected, weighed and stored at −80℃. For bacterial DNA and RNA extraction, the small intestinal and liver were frozen immediately in liquid nitrogen. All animal experiments were approved by the Ethics Committee of Southern Medical University Affiliated Nanfang Hospital (approval no. 20180415-NF325). All animal treatments were carried out in accordance with the Guidelines on Care and Use of Laboratory Animals issued by the Chinese Council on Animal Research and the Guidelines of Animal Care.
- Measurement of biochemical parameters in the serum and liver
- The mice were sacrificed by cervical dislocation. The mice's liver homogenate (1 g of liver tissue and 10 mL of sterilizing saline) was added into Folch solution (chloroform: formaldehyde=2:1 [v/v]), mixed well and centrifuged (4,500 ×g, 5 minutes). The supernatant of the liver was collected. The levels of high density lipoprotein cholesterol (HDL-C) and TC, TG and ASTase activity and ALTase activity were determined using test kits (Biosino Biotechnology and Science Inc., Beijing, China). Endotoxin levels (lipopolysaccharide [LPS]) were measured by using a limulus amebocyte lysate (LAL) assay endotoxin assay kit (Charles River Lab, Wilmington, MA, USA). The concentrations of acetate and butyrate were analyzed by Agilent 1260 Infinity high-performance liquid chromatography (HPLC; Agilent, Santa Clara, CA, USA) according to the report of Adler et al. [32].
- Reverse-transcription quantitative polymerase chain reaction
- Total RNA of the collected tissue was extracted by using a TranZol RNA Extraction Kit (Trans Gen Biotech, Beijing, China). Afterward, cDNA was obtained from the total RNA by reverse transcription using a cDNA synthesis kit (Takara Bio, Dalian, China). Interleukin 1β (IL-1β), TNF-α, and IL-6 were completed by using SYBR premix from Takara Bio. Primer sequences used for mRNA quantification are presented in Supplementary Table 1.
- Sequences of the primers used in the lipid metabolism gene detection are presented in Supplementary Table 2. Fecal DNA was isolated using the QIAmp DNA stool mini kit (Qiagen, Hilden, Germany). Quantitative PCR analysis was performed using different genus- and phyla-specific primers for different bacterial groups according to the Kump et al. [33].
- Statistical analysis
- The software package SPSS version 13.0 (SPSS Inc., Chicago, IL, USA) was used for data analysis. All data are presented as the mean±standard deviation, and statistical significance was performed by one-way analysis of variance (ANOVA) followed by least significant difference for multiple comparisons. P values less than 0.05 were considered to be statistically significant.
METHODS
- Screening of probiotics from the fecal microbiota of healthy adults
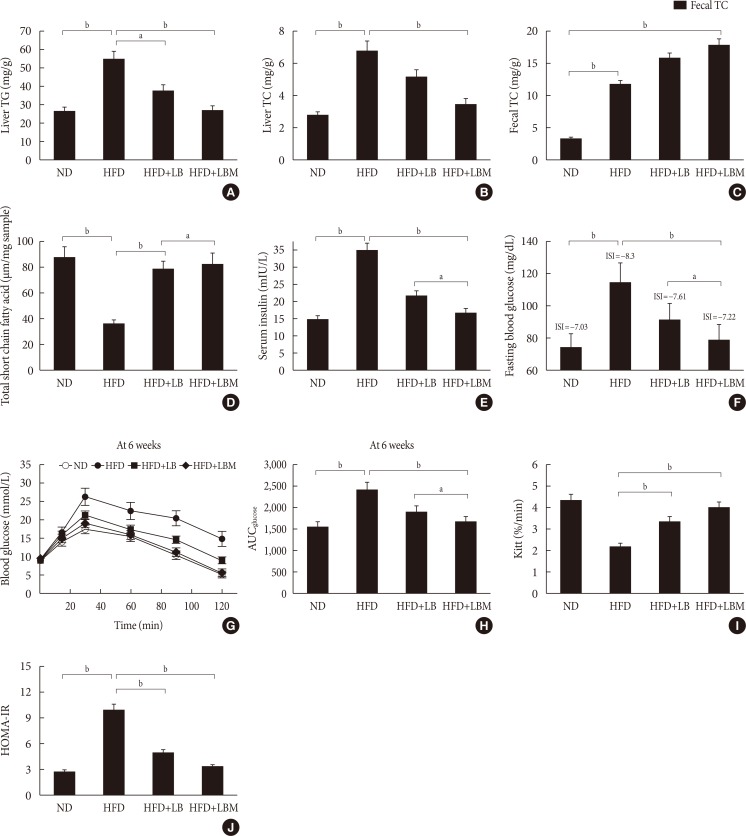
- High levels of cholesterol and TGs were associated with the formation of hyperlipidemia [34]. To obtain the strain with a highly effective lipid-lowering function, 47 candidates isolated from fecal samples were examined. The results are shown in Fig. 1A. Isolate V exhibited the highest activity on TG clearance (68% TG clearance, 25% CC). The IX isolate showed the highest activity on CC. Interestingly, isolate X exhibited outstanding performance, with cholesterol and TG clearance of 57% and 53%, respectively. The selected candidate isolates (X, IX, V) were cultured in the simulated gastric fluid. Fortunately, the survival rates of isolates V and X were up to 87.4% and 78.6%, respectively. However, the IX isolates had relatively low bile resistance (survival rates <20%). Meanwhile, Δlag phase of the tested isolates was investigated. The results showed that the growth of isolates X was slower than that of isolates V with a long Δlag phase of 2.1 hours (Fig. 1B). Based on the 16S rDNA sequence identification, strain V, X was B. bifidum and L. plantarum, respectively. To enhance the performances of the strains synergistically, the ratio of LB was optimized in vitro. The result showed that the cholesterol-TG clearance rate was up to the highest with a C×T value of 0.47, while the ratio of LB was 1:2 (Fig. 1C).
- Insulin resistance is a cardinal feature of NAFLD [35]. Insulin resistance plays an important role during the development of NAFLD and progression to NASH [36]. To increase insulin sensitivity, polysaccharides derived from different sources were screened. The results showed that most of the tested polysaccharides can improve insulin resistance. In particular, compared to the other sources, the S. miltiorrhiza Bunge polysaccharide showed good performance with an ISI value of −4.26 was selected to reduce insulin resistance (Fig. 1D). Next, 50 mg/kg/day S. miltiorrhiza Bunge polysaccharide was observed to improve insulin resistance (Fig. 1E).
- Effects of probiotic combination (LBM) on body index
- After HFD-induced treatment, the liver weight and body weight in the HFD group mice were significantly higher than those fed the ND. However, after LB or LBM treatment, a reduction in body weight was observed (Table 1, Fig. 1F). The total body weight of the LB group and LBM group was reduced by 12.5% and 21.5%, respectively, compared to the HFD mouse models. This weight loss was not related to reduced food intake (Fig. 1G) [37]. In addition, compared to the HFD group, a significant reduction of the liver was observed in the HFD+LB group. Moreover, S. miltiorrhiza Bunge polysaccharide contributed to reducing the liver index values of HFD groups; however, the promoting effect was not significant (Table 1). The liver TC levels and liver TG levels were increased in the HFD group compared to the control group. In contrast, the liver TC and TG levels can be decreased by LB (1:2) in mice fed a HFD (Fig. 2A and B). The lipids can be reduced by LB or LBM, where the increased total short-chain fatty acid concentration (the metabolism products of lipids) in cecal content has been observed (Fig. 2D). After 6 weeks of HFD consumption, the mice showed increased glucose blood levels and insulin resistance. After LB or LBM treatment, the blood glucose levels were reduced (close to the control group), and the insulin resistance was improved. Compared to the HFD group, HOMA-IR in the LBM group was reduced by 66.3%, LBM has the potential to reduce insulin resistance and improve insulin sensitivity (Fig. 2E, F, and J). In addition, NAFLD mice fed with LB (1:2) promoted excretion of cholesterol and total bile acid (Fig. 2C). Insulin sensitivity, as determined by the glucose disappearance rate (KITT) (Fig. 2I), ISI, or HOMA-IR (Fig. 2F and J), was decreased in HFD group mice and showed improvement after LB or LBM treatment. In the OGTT, the blood glucose increased to a maximum after 30 minutes of oral administration of glucose in all groups (Fig. 2G and H). This increased blood glucose in the HFD group was significantly decreased after administration of LBM (Fig. 2G). The inhibitory effect of LBM on blood glucose elevation by HFD treatment has been clearly reflected by the AUCglucose values (Fig. 2H).
- Effects of probiotic combination (LBM) on lipid profiles
- The results showed that the serum TC, low density lipoprotein cholesterol (LDL-C), and TG levels of the HFD group decreased significantly by treatment with probiotic LB (1:2) (Table 2). Compared to the ND group, the HDL level decreased significantly in the HFD group. In contrast, the HDL level of HFD-treated mice increased when supplemented with LB (1:2). Furthermore, serum free fatty acid (FFA), ALTase, ASTase, LDL-C, TG and TC levels in the HFD group were reduced by supplementation with LBM significantly.
- Effect of combination (LBM) on gut microbiota
- The relative abundance of gut microbiota at the phylum and genus levels was investigated. For the ND group, Firmicutes and Bacteroidetes (with 80% to 90% abundance) were the main members of the gut bacteria community presenting in the feces at the phylum level. Moreover, compared to the ND group, the abundance of Cyanobacteria was increased by 68.75% in the HFD group (Fig. 3A). After administering the probiotic combination (LBM), the abundance of Cyanobacteria in HFD-fed mice was reduced.
- Moreover, the ratio of Bacteroidetes/Firmicutes in the HFD group decreased by 42.6% compared to the ND group. However, the ratio of Bacteroidetes/Firmicutes was increased by 14.3% and 34.04% relative to the HFD group via administration probiotics LB and LBM, respectively. At the genus level, the expression profiles of each group (16 highly abundant species >1.0% abundance), including the abundance of Bacteroides, Lactobacillus, Parabacteroides, Oscillospira, and Alistipes, were analyzed (Fig. 3B). Of those species, the abundance of Bacteroides, Lactobacillus, and Parabacteroides was increased by treatment with LB probiotics, while the Oscillospira and Alistipes were decreased by LBM.
- Effects of probiotic combination (LBM) on endotoxin and liver inflammation
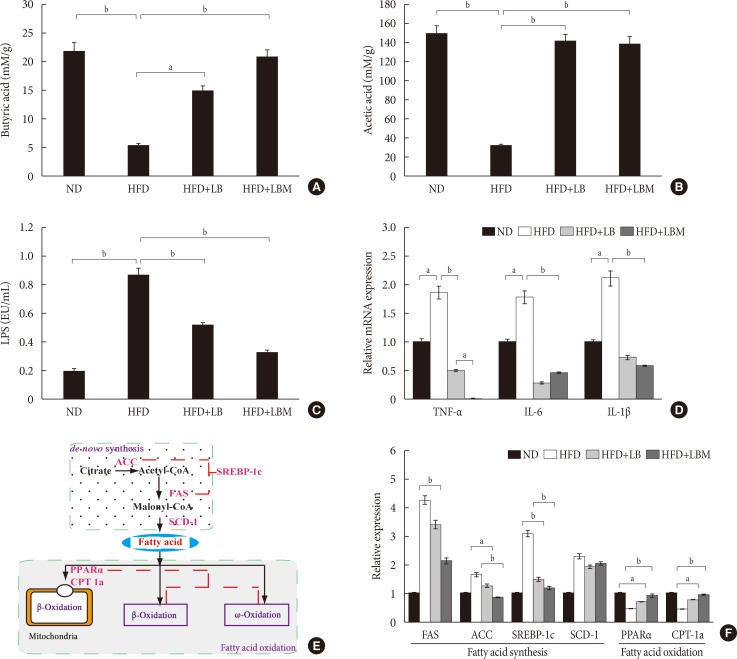
- The concentrations of acetate, butyrate, and LPS were investigated. The total concentrations of acetate and butyrate were significantly reduced by 81.7% and 80% in the HFD groups compared to the ND group. The acetate and butyrate concentrations of NAFLD mice were increased by supplementation with LBM (Fig. 4A and B). Moreover, the HFD group with a high LPS concentration was significantly reduced by probiotic (LB). Moreover, the ability of probiotic LB was enhanced by S. miltiorrhiza Bunge polysaccharide, the LPS concentration of LB group (0.23 endotoxin unit [EU]/mL) decreased by 73.6% compared to the HFD group (0.87 EU/mL); however, the difference between LB and LBM is not significant (P>0.05) (Fig. 4C).
- Based on the changes in short-chain organic acid concentrations and gut microbial abundance in HFD-treated mice, we were trying to reveal the global influence of LBM on liver inflammation. Inflammatory markers (TNF-α, IL-1β, and IL-6) of the liver were investigated. The results showed that inflammatory markers were modulated by the probiotic combination (LBM). Compared to the HFD group, the mRNA concentrations of cytokines (TNF-α, IL-1β, IL-6) were reduced by LB and LBM (Fig. 4D). Interestingly, the TNF-α concentration in the LBM group was significantly lower than that in the ND group.
- The effect of LBM on lipid metabolism was investigated (Fig. 4E), and the results are shown in Fig. 4F. In the way of de novo synthesis, increased hepatic expression of the four genes (acetyl-CoA carboxylase [ACC], fatty acid synthase [FAS], stearoyl-CoA desaturase-1 [SCD-1], and sterol regulatory element binding protein 1c [SREBP-1c]) in the HFD group was observed compared with the ND group. The hepatic expression of ACC, FAS, and SREBP-1c was clearly reduced after LBM treatment. The change in SCD-1 gene expression between the HFD group and the HFD supplemented with LB or LBM group was not significant (P>0.05). Compared to the HFD group, a significant decrease in the hepatic expression of SREBP-1c was induced by LBM (P<0.01) (Fig. 4E and F). Regarding oxidation metabolism, genes associated with fatty acid oxidation (peroxisome proliferator-activated receptor-α [PPARα] and carnitine palmitoyltransferase-1a [CPT-1a]) showed a significant improvement with the help of LBM (P<0.05) (Fig. 4F).
RESULTS
- Blood cholesterol can be reduced by various strains of Lactobacilli and Bifidobacteria, which is safe for consumption, such as Lactobacilli rhamnosus, L. paracasei, L. casei, and L. plantarum [3839]. Fecal microbiota transplantation has been used for the treatment of Clostridium difficile-associated diarrhea and pseudomembranous colitis [40], which highlighted a disease improvement or resolution rate of 83% to 92% [41]. Therefore, the fecal microbiota of healthy adults was selected for the screening of probiotics (Lactobacillus), and most of the isolates performed a high CC capability in this study.
- In addition, insulin resistance has been regarded as a key factor in the pathogenesis of metabolic syndrome [11]. Hepatocyte injury and inflammation could be promoted by hepatic insulin resistance [1642]. It has been reported that different sources of polysaccharides (such as Ganoderma lucidum) could improve insulin resistance by regulating gut microbiota composition and inflammatory cytokines [43]. In the present study, different polysaccharides were screened, and the insulin sensitivity was improved by polysaccharides from S. miltiorrhiza Bunge, which was the outstanding performer among the tested polysaccharides. Finally, the FFA, ALTase, ASTase, LDL-C, TG and TC levels of HFD-treated mice in serum were significantly reduced by LB (1:2). The function of the probiotic LB was enhanced by S. miltiorrhiza Bunge polysaccharide. In previous research, polysaccharides have been used to reduce IL-6, IL-1β, and TNF-α concentrations in plasma [43]. TNF-α expression and hepatic inflammation can be reduced by L. rhamnosus and other probiotics [44]. Our research showed that the expression levels of TNF-α, IL-1β, and IL-6 can be reduced by LBM; we speculate that it was the result of the synergy between L. plantarum-B. bifidum and S. miltiorrhiza Bunge. Furthermore, it was shown that the composition of the intestinal microbiota can be regrouped by LBM in this study. The abundance of Cyanobacteria in HFD-fed mice was reduced by administering LBM. Previous studies indicated that microbiota composition is related to insulin resistance. Increased Cyanobacteria (gram-negative bacteria) have been demonstrated as contributors to increased LPS levels, and all types of Cyanobacteria can produce various toxins, which are involved in various human diseases via increasing the hepatic damage triggered by hepatotoxins [45]. Moreover, we found that Bacteroidetes/Firmicutes can be increased by LB and LBM. Numerous studies have suggested that Firmicutes/Bacteroidetes ratios are a compositional biomarker for obesity [46] and type 1 diabetes mellitus [47]. Moreover, fecal extracts of ulcerative colitis patients were characterized by reduced levels of butyrate, acetate, methylamine, and trimethylamine in comparison with a control population [4849]. The acetate and butyrate concentrations of NAFLD mice were increased by supplementation LBM in this study. This result was consistent with the report of Turnbaugh et al. [49] and de Wit et al. [50]. Therefore, LBM combination has the potential to be used as a therapeutic for ameliorating NAFLD via modulation of the gut microbiota and improvement of insulin resistance.
DISCUSSION
-
Acknowledgements
- Funding for this study was provided by the Chinese Foundation for Hepatitis Prevention and Control–TianQing Liver Disease Research Fund Subject TQGB20190130 (http://www.cfhpc.org). The funders had no role in study design, data collection and analysis, decision to publish, or preparation of the manuscript.
ACKNOWLEDGMENTS
-
CONFLICTS OF INTEREST: No potential conflict of interest relevant to this article was reported.
-
AUTHOR CONTRIBUTIONS:
NOTES
SUPPLEMENTARY MATERIALS
Supplementary Table 2
- 1. European Association for the Study of the Liver (EASL). European Association for the Study of Diabetes (EASD). European Association for the Study of Obesity (EASO). EASL-EASD-EASO clinical practice guidelines for the management of non-alcoholic fatty liver disease. Obes Facts 2016;9:65-90. ArticlePubMedPMCPDF
- 2. Nomura K, Yamanouchi T. The role of fructose-enriched diets in mechanisms of nonalcoholic fatty liver disease. J Nutr Biochem 2012;23:203-208. ArticlePubMed
- 3. Athyros VG, Tziomalos K, Gossios TD, Griva T, Anagnostis P, Kargiotis K, Pagourelias ED, Theocharidou E, Karagiannis A, Mikhailidis DP. GREACE Study Collaborative Group. Safety and efficacy of long-term statin treatment for cardiovascular events in patients with coronary heart disease and abnormal liver tests in the Greek Atorvastatin and Coronary Heart Disease Evaluation (GREACE) Study: a post-hoc analysis. Lancet 2010;376:1916-1922. ArticlePubMed
- 4. Michelotti GA, Machado MV, Diehl AM. NAFLD, NASH and liver cancer. Nat Rev Gastroenterol Hepatol 2013;10:656-665. ArticlePubMedPDF
- 5. Abu-Shanab A, Quigley EM. The role of the gut microbiota in nonalcoholic fatty liver disease. Nat Rev Gastroenterol Hepatol 2010;7:691-701. ArticlePubMedPDF
- 6. Sanyal AJ. American Gastroenterological Association. AGA technical review on nonalcoholic fatty liver disease. Gastroenterology 2002;123:1705-1725. ArticlePubMed
- 7. Ahmed M. Non-alcoholic fatty liver disease in 2015. World J Hepatol 2015;7:1450-1459. ArticlePubMedPMC
- 8. Gaggini M, Morelli M, Buzzigoli E, DeFronzo RA, Bugianesi E, Gastaldelli A. Non-alcoholic fatty liver disease (NAFLD) and its connection with insulin resistance, dyslipidemia, atherosclerosis and coronary heart disease. Nutrients 2013;5:1544-1560. ArticlePubMedPMC
- 9. Loomba R, Sanyal AJ. The global NAFLD epidemic. Nat Rev Gastroenterol Hepatol 2013;10:686-690. ArticlePubMedPDF
- 10. Cope K, Risby T, Diehl AM. Increased gastrointestinal ethanol production in obese mice: implications for fatty liver disease pathogenesis. Gastroenterology 2000;119:1340-1347. ArticlePubMed
- 11. Kakino S, Ohki T, Nakayama H, Yuan X, Otabe S, Hashinaga T, Wada N, Kurita Y, Tanaka K, Hara K, Soejima E, Tajiri Y, Yamada K. Pivotal role of TNF-α in the development and progression of nonalcoholic fatty liver disease in a murine model. Horm Metab Res 2018;50:80-87. ArticlePubMed
- 12. Bauer TM, Schwacha H, Steinbruckner B, Brinkmann FE, Ditzen AK, Aponte JJ, Pelz K, Berger D, Kist M, Blum HE. Small intestinal bacterial overgrowth in human cirrhosis is associated with systemic endotoxemia. Am J Gastroenterol 2002;97:2364-2370. ArticlePubMed
- 13. Madrid AM, Hurtado C, Venegas M, Cumsille F, Defilippi C. Long-term treatment with cisapride and antibiotics in liver cirrhosis: effect on small intestinal motility, bacterial overgrowth, and liver function. Am J Gastroenterol 2001;96:1251-1255. ArticlePubMed
- 14. Thalheimer U, De Iorio F, Capra F, del Mar Lleo M, Zuliani V, Ghidini V, Tafi MC, Caburlotto G, Gennari M, Burroughs AK, Vantini I. Altered intestinal function precedes the appearance of bacterial DNA in serum and ascites in patients with cirrhosis: a pilot study. Eur J Gastroenterol Hepatol 2010;22:1228-1234. ArticlePubMed
- 15. Kirsch R, Clarkson V, Verdonk RC, Marais AD, Shephard EG, Ryffel B, de la M Hall P. Rodent nutritional model of steatohepatitis: effects of endotoxin (lipopolysaccharide) and tumor necrosis factor alpha deficiency. J Gastroenterol Hepatol 2006;21:174-182. ArticlePubMed
- 16. Pagano G, Pacini G, Musso G, Gambino R, Mecca F, Depetris N, Cassader M, David E, Cavallo-Perin P, Rizzetto M. Nonalcoholic steatohepatitis, insulin resistance, and metabolic syndrome: further evidence for an etiologic association. Hepatology 2002;35:367-372. ArticlePubMedPDF
- 17. Karczewski J, Troost FJ, Konings I, Dekker J, Kleerebezem M, Brummer RJ, Wells JM. Regulation of human epithelial tight junction proteins by Lactobacillus plantarum in vivo and protective effects on the epithelial barrier. Am J Physiol Gastrointest Liver Physiol 2010;298:G851-G859. ArticlePubMed
- 18. Xu RY, Wan YP, Fang QY, Lu W, Cai W. Supplementation with probiotics modifies gut flora and attenuates liver fat accumulation in rat nonalcoholic fatty liver disease model. J Clin Biochem Nutr 2012;50:72-77. ArticlePubMed
- 19. Ma YY, Li L, Yu CH, Shen Z, Chen LH, Li YM. Effects of probiotics on nonalcoholic fatty liver disease: a meta-analysis. World J Gastroenterol 2013;19:6911-6918. ArticlePubMedPMC
- 20. Malaguarnera M, Vacante M, Antic T, Giordano M, Chisari G, Acquaviva R, Mastrojeni S, Malaguarnera G, Mistretta A, Li Volti G, Galvano F. Bifidobacterium longum with fructo-oligosaccharides in patients with non alcoholic steatohepatitis. Dig Dis Sci 2012;57:545-553. ArticlePubMedPDF
- 21. Cani PD, Delzenne NM. The role of the gut microbiota in energy metabolism and metabolic disease. Curr Pharm Des 2009;15:1546-1558. ArticlePubMed
- 22. Azat R, Liu Y, Li W, Kayir A, Lin DB, Zhou WW, Zheng XD. Probiotic properties of lactic acid bacteria isolated from traditionally fermented Xinjiang cheese. J Zhejiang Univ Sci B 2016;17:597-609. ArticlePubMedPMCPDF
- 23. Mei L, Tang Y, Li M, Yang P, Liu Z, Yuan J, Zheng P. Co-Administration of cholesterol-lowering probiotics and anthraquinone from Cassia obtusifolia L. Ameliorate non-alcoholic fatty liver. PLoS One 2015;10:e0138078. ArticlePubMedPMC
- 24. Saravanan G, Ponmurugan P. Ameliorative potential of S-allylcysteine: effect on lipid profile and changes in tissue fatty acid composition in experimental diabetes. Exp Toxicol Pathol 2012;64:639-644. ArticlePubMed
- 25. Zhang W, Zheng L, Zhang Z, Hai CX. Protective effect of a water-soluble polysaccharide from Salvia miltiorrhiza Bunge on insulin resistance in rats. Carbohydr Polym 2012;89:890-898. ArticlePubMed
- 26. Xing XY, Li YF, Fu ZD, Chen YY, Wang YF, Liu XL, Liu WY, Li GW. Antihypertensive effect of metformin in essential hypertensive patients with hyperinsulinemia. Zhonghua Nei Ke Za Zhi 2010;49:14-18. PubMed
- 27. Zhang Y, Hu T, Zhou H, Zhang Y, Jin G, Yang Y. Antidiabetic effect of polysaccharides from Pleurotus ostreatus in streptozotocin-induced diabetic rats. Int J Biol Macromol 2016;83:126-132. ArticlePubMed
- 28. Ren D, Hu Y, Luo Y, Yang X. Selenium-containing polysaccharides from Ziyang green tea ameliorate high-fructose diet induced insulin resistance and hepatic oxidative stress in mice. Food Funct 2015;6:3342-3350. ArticlePubMed
- 29. Bao Y, Zhang Y, Zhang Y, Liu Y, Wang S, Dong X, Wang Y, Zhang H. Screening of potential probiotic properties of Lactobacillus fermentum isolated from traditional dairy products. Food Control 2010;21:695-701.Article
- 30. Huang Y, Wang X, Wang J, Wu F, Sui Y, Yang L, Wang Z. Lactobacillus plantarum strains as potential probiotic cultures with cholesterol-lowering activity. J Dairy Sci 2013;96:2746-2753. ArticlePubMed
- 31. Janda JM, Abbott SL. 16S rRNA gene sequencing for bacterial identification in the diagnostic laboratory: pluses, perils, and pitfalls. J Clin Microbiol 2007;45:2761-2764. ArticlePubMedPMCPDF
- 32. Adler P, Frey LJ, Berger A, Bolten CJ, Hansen CE, Wittmann C. The key to acetate: metabolic fluxes of acetic acid bacteria under cocoa pulp fermentation-simulating conditions. Appl Environ Microbiol 2014;80:4702-4716. ArticlePubMedPMCPDF
- 33. Kump PK, Grochenig HP, Lackner S, Trajanoski S, Reicht G, Hoffmann KM, Deutschmann A, Wenzl HH, Petritsch W, Krejs GJ, Gorkiewicz G, Hogenauer C. Alteration of intestinal dysbiosis by fecal microbiota transplantation does not induce remission in patients with chronic active ulcerative colitis. Inflamm Bowel Dis 2013;19:2155-2165. ArticlePubMed
- 34. Watts GF, Burke V. Lipid-lowering trials in the primary and secondary prevention of coronary heart disease: new evidence, implications and outstanding issues. Curr Opin Lipidol 1996;7:341-355. ArticlePubMed
- 35. Utzschneider KM, Kahn SE. Review: the role of insulin resistance in nonalcoholic fatty liver disease. J Clin Endocrinol Metab 2006;91:4753-4761. PubMed
- 36. Peverill W, Powell LW, Skoien R. Evolving concepts in the pathogenesis of NASH: beyond steatosis and inflammation. Int J Mol Sci 2014;15:8591-8638. ArticlePubMedPMC
- 37. Ding W, Shi C, Chen M, Zhou J, Long R, Guo X. Screening for lactic acid bacteria in traditional fermented Tibetan yak milk and evaluating their probiotic and cholesterol-lowering potentials in rats fed a high-cholesterol diet. J Funct Foods 2017;32:324-332.Article
- 38. Ooi LG, Liong MT. Cholesterol-lowering effects of probiotics and prebiotics: a review of in vivo and in vitro findings. Int J Mol Sci 2010;11:2499-2522. ArticlePubMedPMC
- 39. Liu W, Xi X, Sudu Q, Kwok L, Guo Z, Hou Q, Menhe B, Sun T, Zhang H. High-throughput sequencing reveals microbial community diversity of Tibetan naturally fermented yak milk. Ann Microbiol 2015;65:1741-1751.ArticlePDF
- 40. Palmer R. Fecal matters. Nat Med 2011;17:150-152. ArticlePubMedPDF
- 41. Gough E, Shaikh H, Manges AR. Systematic review of intestinal microbiota transplantation (fecal bacteriotherapy) for recurrent Clostridium difficile infection. Clin Infect Dis 2011;53:994-1002. ArticlePubMed
- 42. Farrell GC. Signalling links in the liver: knitting SOCS with fat and inflammation. J Hepatol 2005;43:193-196. ArticlePubMed
- 43. Xu S, Dou Y, Ye B, Wu Q, Wang Y, Hu M, Ma F, Rong X, Guo J. Ganoderma lucidum polysaccharides improve insulin sensitivity by regulating inflammatory cytokines and gut microbiota composition in mice. J Funct Foods 2017;38(Pt A):545-552.Article
- 44. Bluemel S, Williams B, Knight R, Schnabl B. Precision medicine in alcoholic and nonalcoholic fatty liver disease via modulating the gut microbiota. Am J Physiol Gastrointest Liver Physiol 2016;311:G1018-G1036. ArticlePubMedPMC
- 45. Durai P, Batool M, Choi S. Structure and effects of cyanobacterial lipopolysaccharides. Mar Drugs 2015;13:4217-4230. ArticlePubMedPMC
- 46. Ley RE, Turnbaugh PJ, Klein S, Gordon JI. Microbial ecology: human gut microbes associated with obesity. Nature 2006;444:1022-1023. ArticlePubMedPDF
- 47. Wen L, Ley RE, Volchkov PY, Stranges PB, Avanesyan L, Stonebraker AC, Hu C, Wong FS, Szot GL, Bluestone JA, Gordon JI, Chervonsky AV. Innate immunity and intestinal microbiota in the development of type 1 diabetes. Nature 2008;455:1109-1113. ArticlePubMedPMCPDF
- 48. Marchesi JR, Holmes E, Khan F, Kochhar S, Scanlan P, Shanahan F, Wilson ID, Wang Y. Rapid and noninvasive metabonomic characterization of inflammatory bowel disease. J Proteome Res 2007;6:546-551. ArticlePubMed
- 49. Turnbaugh PJ, Ley RE, Mahowald MA, Magrini V, Mardis ER, Gordon JI. An obesity-associated gut microbiome with increased capacity for energy harvest. Nature 2006;444:1027-1031. ArticlePubMedPDF
- 50. de Wit N, Derrien M, Bosch-Vermeulen H, Oosterink E, Keshtkar S, Duval C, de Vogel-van den Bosch J, Kleerebezem M, Muller M, van der Meer R. Saturated fat stimulates obesity and hepatic steatosis and affects gut microbiota composition by an enhanced overflow of dietary fat to the distal intestine. Am J Physiol Gastrointest Liver Physiol 2012;303:G589-G599. ArticlePubMed
REFERENCES
(A) Strains screening. (B) The survival rate of three isolates in MRSB broth (MRS [de MAN, ROGOSA and SHARPE] broth containing 0.3% bile salts). (C) Effect of the ratio of Lactobacillus plantarum to Bifidobacterium bifidum on cholesterol-triglyceride reduction. (D) Effect of different polysaccharides on insulin resistance. (E) Effect of Salvia miltiorrhiza Bunge polysaccharide (M) dose on the insulin sensitivity index (ISI). The changes in (F) body weight and (G) food intake for 6 weeks. Food intake was estimated using the following formulas: Food intake=(initial weight of food provided–the final weight of food recovered [g]). MRSB was MRS broth supplemented with 0.3% bile salts after 3 hours at 37℃. The Δlag phase was calculated as the time needed to increase by 0.5 absorbance units at 620 nm in MRSB minus the time requirement in MRS broth according to Ding et al. [37]. C×T=cholesterol reduction rate (%)×triglyceride reduction rate (%). The ISI was calculated according to the following formulas: ISI=Ln [1/(FBG×FINS)], where FBG was the level of fasting blood glucose (mmol/L) and FINS was the level of fasting insulin (mU/L). All measurements were taken in triplicate, and experiments were repeated three times to evaluate the standard deviation. LB, Lactobacillus plantarum X (LpX)-Bifidobacterium bifidum V (BbV); LBM, LpX-BbV+Salvia miltiorrhiza Bunge polysaccharide; L. barbarum, Lycium barbarum; P. linteus, Phellinus linteus; M. charantia L., Momordicacharantia L.; C. militaris, Cordyceps militaris; A. membranaceus, Astragalus membranaceus (Fisch.) Bunge; S. miltiorrhiza, S. miltiorrhiza Bunge. aP<0.05, bP<0.01 indicates statistically significant differences compared with the high-fat diet (HFD) group (control), cP<0.01 indicates statistically significant differences compared with the normal diet (ND) group (control).
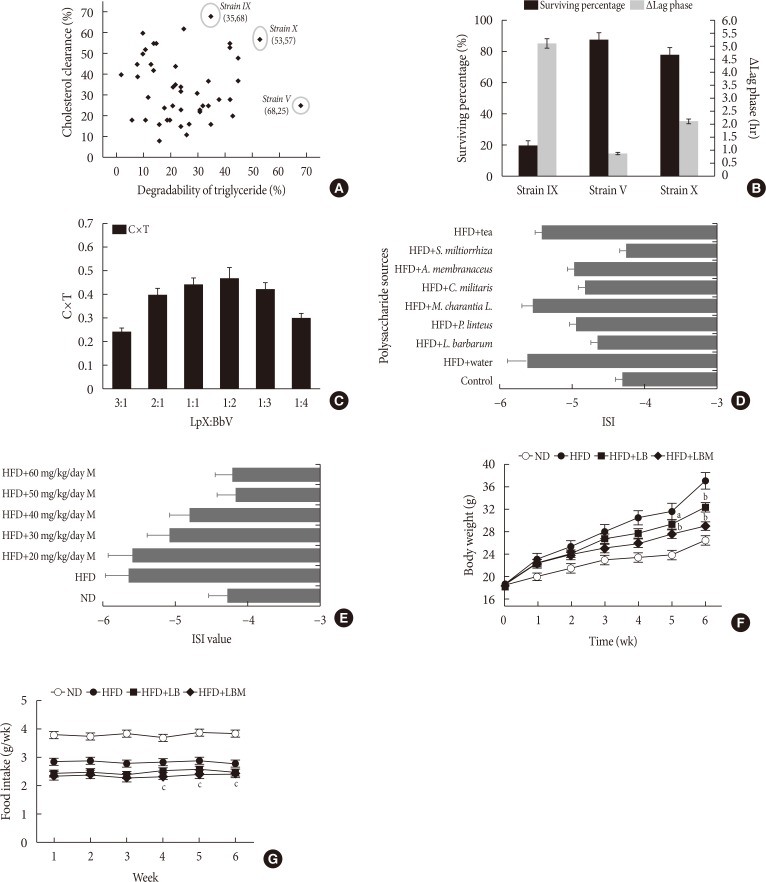
Liver (A) total cholesterol (TC) and (B) triglyceride (TG) levels in mice with different treatments. (C) Fecal TC of the four groups at the end of feeding period, mice orally fed high-fat diet (HFD) supplemented with a mixture of L. plantarum-B. bifidum (1:2) and Salvia miltiorrhiza Bunge polysaccharide. (D) Total short-chain fatty acid concentration (the metabolized products of lipids) in cecal content. (E) Serum insulin; (F) fasting blood glucose (FBG). (G) Oral glucose tolerance test (OGTT) at 6 weeks after treatment and (H) the area under the curve (AUC) of OGTT at 6 weeks. (I) The glucose disappearance rate during the insulin tolerance test (KITT). (J) Homeostasis model assessment of insulin resistance (HOMA-IR). Insulin sensitivity index (ISI)=−ln (FPG×fasting insulin [FINS]). HOMA-IR=FINS (mIU/L)×FBG (mmol/L)/22.5. Data are expressed as the mean±standard deviation. ND, normal diet; LB, Lactobacillus plantarum X (LpX)-Bifidobacterium bifidum V (BbV); LBM, LpX-BbV+Salvia miltiorrhiza Bunge polysaccharide. aP<0.05, bP<0.01.

Effect of probiotic combination (LBM) on gut microbiota in the intestines of tested mice. (A) The relative abundance of four groups at the phyla level and (B) the relative abundance of four groups at the genus level. ND, normal diet; HFD, high-fat diet; LB, Lactobacillus plantarum X (LpX)-Bifidobacterium bifidum V (BbV); LBM, LpX-BbV+Salvia miltiorrhiza Bunge polysaccharide.

Effect of probiotic combination LBM on the concentration of short-chain organic acids and endotoxin (lipopolysaccharide [LPS]) in cecal content. (A) Levels of butyrate in cecal content, (B) levels of acetate in cecal content, (C) LPS, (D) mRNA expression of inflammatory genes in the liver of mice. (E, F) Effect of LBM on the expression of the beginning synthesis genes and lipid oxidation genes. Relative mRNA levels are expressed as a ratio relative to β-actin. Values are expressed as the mean±standard deviation. ND, normal diet; HFD, high-fat diet; LB, Lactobacillus plantarum X (LpX)-Bifidobacterium bifidum V (BbV); LBM, LpX-BbV+Salvia miltiorrhiza Bunge polysaccharide; TNF-α, tumor necrosis factor α; IL-1β, interleukin 1β; IL-6, interleukin 6; FAS, fatty acid synthase; ACC, acetyl-CoA carboxylase; SREBP-1c, sterol regulatory element binding protein 1c; SCD-1, stearoyl-CoA desaturase-1; PPARα, peroxisome proliferator-activated receptor-α; CPT-1a, carnitine palmitoyltransferase-1a. aP<0.05, bP<0.01.
Body weight gain, liver weight, and liver index of mice in four groups
Serum lipid levels in the four groups
Values are presented as mean±standard deviation.
TG, triglyceride; TC, total cholesterol; LDL-C, low density lipoprotein cholesterol; HDL-C, high density lipoprotein cholesterol; ALTase, alanine transaminase; ASTase, aspartate transaminase; ND, normal diet; HFD, high-fat diet; LB, Lactobacillus plantarum X (LpX)-Bifidobacterium bifidum V (BbV); LBM, LpX-BbV+Salvia miltiorrhiza Bunge polysaccharide.
Figure & Data
References
Citations
- Bifidobacterium bifidum BGN4 fractions ameliorate palmitic acid-induced hepatocyte ferroptosis by inhibiting SREBP1-CYP2E1 pathway
Guangkui Bu, Gang Chen, Juan Li, Dan Wu, Jiangtao Liao
Journal of Investigative Medicine.2024; 72(1): 67. CrossRef - Docosahexaenoic acid (DHA) alleviates hepatic lipid accumulation by regulating mitochondrial quality control through ERK signaling pathway in grass carp (Ctenopharyngodon idellus)
Chenchen Bian, Shanghong Ji, Caihong Zeng, Jian Sun, Gen Kaneko, Hong Ji
Aquaculture.2024; 579: 740209. CrossRef - Microbial-Based Bioactive Compounds to Alleviate Inflammation in Obesity
Oladayo Emmanuel Apalowo, Grace Adeola Adegoye, Tolulope Mobolaji Obuotor
Current Issues in Molecular Biology.2024; 46(3): 1810. CrossRef - Understanding the role of ursodeoxycholic acid and gut microbiome in non-alcoholic fatty liver disease: current evidence and perspectives
Qingyi Mao, Beibei Lin, Wenluo Zhang, Yu Zhang, Yu Zhang, Qian Cao, Mengque Xu
Frontiers in Pharmacology.2024;[Epub] CrossRef - Smilax China L. polysaccharide prevents HFD induced-NAFLD by regulating hepatic fat metabolism and gut microbiota
Wenkai Zhang, Longhui Yu, Qinru Yang, Jinfeng Zhang, Wenjing Wang, Xinru Hu, Jingen Li, Guodong Zheng
Phytomedicine.2024; 127: 155478. CrossRef - Breaking the barriers: the role of gut homeostasis in Metabolic-Associated Steatotic Liver Disease (MASLD)
Raquel Benedé-Ubieto, Francisco Javier Cubero, Yulia A. Nevzorova
Gut Microbes.2024;[Epub] CrossRef - Prospect of research on anti-atherosclerosis effect of main components of traditional Chinese medicine Yiqi Huoxue Huatan recipe through gut microbiota: A review
Hongtao Huang, Hanjun Zhao, Lv Wenqing, Feiyue Xu, Xiaolong Wang, Yili Yao, Yu Huang
Medicine.2024; 103(5): e37104. CrossRef - Polysaccharides from Eucommia ulmoides Oliv. Leaves Alleviate Acute Alcoholic Liver Injury by Modulating the Microbiota–Gut–Liver Axis in Mice
Yingzhi Li, Huimei Wang, Xueping Leng, Jiaming Gao, Chang Li, Danfei Huang
Foods.2024; 13(7): 1089. CrossRef - Innovative pharmacotherapy for hepatic metabolic and chronic inflammatory diseases in China
Feng Zhang, Jiaming Ju, Hongtao Diao, Jinglun Song, Yu bian, Baofeng Yang
British Journal of Pharmacology.2024;[Epub] CrossRef - Intestinal dysbiosis in nonalcoholic fatty liver disease (NAFLD): focusing on the gut–liver axis
Hui Han, Yi Jiang, Mengyu Wang, Mebratu Melaku, Lei Liu, Yong Zhao, Nadia Everaert, Bao Yi, Hongfu Zhang
Critical Reviews in Food Science and Nutrition.2023; 63(12): 1689. CrossRef - Epigenetic compounds targeting pharmacological target lysine specific demethylase 1 and its impact on immunotherapy, chemotherapy and radiotherapy for treatment of tumor recurrence and resistance
Clement Agboyibor, Jianshu Dong, Clement Yaw Effah, Emmanuel Kwateng Drokow, Maxwell Ampomah-Wireko, Waqar Pervaiz, Augustina Sangmor, Xinli Ma, Jian Li, Hong-Min Liu, Peng Zhang
Biomedicine & Pharmacotherapy.2023; 157: 113934. CrossRef - Salvia miltiorrhiza polysaccharides alleviate florfenicol-induced inflammation and oxidative stress in chick livers by regulating phagosome signaling pathway
Xiao Wang, Wei Liu, Di Zhang, Yulan Jiao, Qianhui Zhao, Ying Liu, Wanyu Shi, Yongzhan Bao
Ecotoxicology and Environmental Safety.2023; 249: 114428. CrossRef - Preparation methods, structural characteristics, and biological activity of polysaccharides from Salvia miltiorrhiza: A review
Yuanyuan Li, Xin Zhang, Yining Li, Pei Yang, Zhiyuan Zhang, Hang Wu, Lihao Zhu, Yuhong Liu
Journal of Ethnopharmacology.2023; 305: 116090. CrossRef - The spleen-strengthening and liver-draining herbal formula treatment of non-alcoholic fatty liver disease by regulation of intestinal flora in clinical trial
Dengcheng Hui, Lu Liu, Nisma Lena Bahaji Azami, Jingru Song, Yanping Huang, Wan Xu, Chao Wu, Dong Xie, Yulang Jiang, Yanqin Bian, Mingyu Sun
Frontiers in Endocrinology.2023;[Epub] CrossRef - The gut microbiota: A new perspective for tertiary prevention of hepatobiliary and gallbladder diseases
Xiaoyu Huang, Yi Yang, Xueli Li, Xiaoya Zhu, Dan Lin, Yueran Ma, Min Zhou, Xiangyi Cui, Bingyu Zhang, Dongmei Dang, Yuhong Lü, Changwu Yue
Frontiers in Nutrition.2023;[Epub] CrossRef - Polysaccharides from Ostrea rivularis rebuild the balance of gut microbiota to ameliorate non-alcoholic fatty liver disease in ApoE−/− mice
Lijun Zhu, Mingmei Xiao, Jigang Luo, Shijie Li, Wenting Liu, Jinchuan Wu, Zhuoyue Song
International Journal of Biological Macromolecules.2023; 235: 123853. CrossRef - Improvement of Inflammation, Diabetes, and Obesity by Forest
Product-Derived Polysaccharides through the Human Intestinal
Microbiota
Seong-woo MYEONG, Yong Ju LEE, Do Hyun KIM, Tae-Jong KIM
Journal of the Korean Wood Science and Technology.2023; 51(5): 358. CrossRef - Recent developments in Salvia miltiorrhiza polysaccharides: Isolation, purification, structural characteristics and biological activities
Lei Luo, Juan Xue, Zheng Shao, Zhang Zhou, Wenqian Tang, Jinxin Liu, Hongfei Hu, Fan Yang
Frontiers in Pharmacology.2023;[Epub] CrossRef - In Vitro Probiotic Properties of Bifidobacterium animalis subsp. lactis SF and Its Alleviating Effect on Non-Alcoholic Fatty Liver Disease
Huihui Lv, Feiyue Tao, Lingling Peng, Shufang Chen, Zhongyue Ren, Jiahui Chen, Bo Yu, Hua Wei, Cuixiang Wan
Nutrients.2023; 15(6): 1355. CrossRef - Ginsenoside Rg1 Ameliorates Pancreatic Injuries via the AMPK/mTOR Pathway in vivo and in vitro
Jin Chen, Guoping Zhu, Wenbo Xiao, Xiaosong Huang, Kewu Wang, Yi Zong
Diabetes, Metabolic Syndrome and Obesity.2023; Volume 16: 779. CrossRef - Managing metabolic diseases: The roles and therapeutic prospects of herb-derived polysaccharides
Xinmei Xu, Lijie Wang, Kun Zhang, Yi Zhang, Gang Fan
Biomedicine & Pharmacotherapy.2023; 161: 114538. CrossRef - Probio-X Relieves Symptoms of Hyperlipidemia by Regulating Patients’ Gut Microbiome, Blood Lipid Metabolism, and Lifestyle Habits
Huan Wang, Cuicui Ma, Yan Li, Lei Zhang, lima A, Chengcong Yang, Feiyan Zhao, Haifeng Han, Dongyang Shang, Fan Yang, Yuying Zhang, Heping Zhang, Zhihong Sun, Ruifang Guo, Yuan Pin Hung
Microbiology Spectrum.2023;[Epub] CrossRef - Sea cucumber sulfated polysaccharides and Lactobacillus gasseri synergistically ameliorate the overweight induced by altered gut microbiota in mice
Zhengqi Liu, Chunqing Ai, Xinping Lin, Xiaoming Guo, Shuang Song, Beiwei Zhu
Food & Function.2023; 14(9): 4106. CrossRef - Supplementation of Lactobacillus plantarum ATCC14917 mitigates non-alcoholic fatty liver disease in high-fat-diet-fed rats
Xingjian Wen, Hejing Liu, Xiaoling Luo, Li Lui, Jiuyu Fan, Yajing Xing, Jia Wang, Xingfang Qiao, Na Li, Guixue Wang
Frontiers in Microbiology.2023;[Epub] CrossRef - Potential herb–drug interactions between anti-COVID-19 drugs and traditional Chinese medicine
Ling Ye, Shicheng Fan, Pengfei Zhao, Chenghua Wu, Menghua Liu, Shuang Hu, Peng Wang, Hongyu Wang, Huichang Bi
Acta Pharmaceutica Sinica B.2023; 13(9): 3598. CrossRef - α‐Lactalbumin Peptide Asp‐Gln‐Trp Ameliorates Hepatic Steatosis and Oxidative Stress in Free Fatty Acids‐Treated HepG2 Cells and High‐Fat Diet‐Induced NAFLD Mice by Activating the PPARα Pathway
Haoran Chen, Yanfeng Ma, Xiaofen Qi, Jianjun Tian, Ying Ma, Tianjiao Niu
Molecular Nutrition & Food Research.2023;[Epub] CrossRef - Lonicerae flos polysaccharides improve nonalcoholic fatty liver disease by activating the adenosine 5′‐monophosphate‐activated protein kinase pathway and reshaping gut microbiota
Chao Han, Zongshuo Li, Ruiying Liu, Zihan Zhao, Yu Wang, Xuli Zuo, Yushi Zhang, Zeyu Geng, Houyu Huang, Xiuzhen Pan, Weidong Li
Journal of the Science of Food and Agriculture.2023; 103(15): 7721. CrossRef - Polysaccharides: The Potential Prebiotics for Metabolic Associated Fatty Liver Disease (MAFLD)
Qin Guo, Yun Li, Xin Dai, Bangmao Wang, Jie Zhang, Hailong Cao
Nutrients.2023; 15(17): 3722. CrossRef - Prebiotics and Probiotics: Therapeutic Tools for Nonalcoholic Fatty Liver Disease
Alejandra Mijangos-Trejo, Natalia Nuño-Lambarri, Varenka Barbero-Becerra, Misael Uribe-Esquivel, Paulina Vidal-Cevallos, Norberto Chávez-Tapia
International Journal of Molecular Sciences.2023; 24(19): 14918. CrossRef - Repair Effect and Mechanism of Electrospinning Nanocomposite Material with Gelatin-Bletilla Striata Gum/Salvia Miltiorrhiza on Orthopedic Refractory Wounds
Geliang Hu, Ming Deng, Yonggang Ma, Jianghua Ming
Journal of Biomedical Nanotechnology.2023; 19(10): 1783. CrossRef -
Characterisation and skin protection activities of polysaccharides from
Schnabelia terniflora
Ying Zhao, Yixian Liu, Huoxiang Zhou, Wei Guo, Weidong Wang, Huiping Chen
Natural Product Research.2023; : 1. CrossRef - Non-alcoholic fatty liver disease risk prediction model and health management strategies for older Chinese adults: a cross-sectional study
Hong Pan, Baocheng Liu, Xin Luo, Xinxin Shen, Jijia Sun, An Zhang
Lipids in Health and Disease.2023;[Epub] CrossRef - Modulatory effects of polysaccharides from plants, marine algae and edible mushrooms on gut microbiota and related health benefits: A review
Henan Zhang, Fuchun Jiang, Jinsong Zhang, Wenhan Wang, Lin Li, Jingkun Yan
International Journal of Biological Macromolecules.2022; 204: 169. CrossRef - Hepatoprotective mechanism of Silybum marianum on nonalcoholic fatty liver disease based on network pharmacology and experimental verification
Guoyan Jiang, Chunhong Sun, Xiaodong Wang, Jie Mei, Chen Li, Honghong Zhan, Yixuan Liao, Yongjun Zhu, Jingxin Mao
Bioengineered.2022; 13(3): 5216. CrossRef - Gut Microbiome in Non-Alcoholic Fatty Liver Disease: From Mechanisms to Therapeutic Role
Haripriya Gupta, Byeong-Hyun Min, Raja Ganesan, Yoseph Asmelash Gebru, Satya Priya Sharma, Eunju Park, Sung-Min Won, Jin-Ju Jeong, Su-Been Lee, Min-Gi Cha, Goo-Hyun Kwon, Min-Kyo Jeong, Ji-Ye Hyun, Jung-A. Eom, Hee-Jin Park, Sang-Jun Yoon, Mi-Ran Choi, Do
Biomedicines.2022; 10(3): 550. CrossRef - Efficacy and Safety of Probiotics Combined With Traditional Chinese Medicine for Ulcerative Colitis: A Systematic Review and Meta-Analysis
Yu Hu, Zhen Ye, Yingqi She, Linzhen Li, Mingquan Wu, Kaihua Qin, Yuzheng Li, Haiqing He, Zhipeng Hu, Maoyi Yang, Fating Lu, Qiaobo Ye
Frontiers in Pharmacology.2022;[Epub] CrossRef - Hepatoprotection of Probiotics Against Non-Alcoholic Fatty Liver Disease in vivo: A Systematic Review
Faezah Sabirin, Siong Meng Lim, Chin Fen Neoh, Kalavathy Ramasamy
Frontiers in Nutrition.2022;[Epub] CrossRef - Salvia miltiorrhiza Bge. (Danshen) in the Treating Non-alcoholic Fatty Liver Disease Based on the Regulator of Metabolic Targets
Jie Liu, Yun Shi, Daiyin Peng, Lei Wang, Nianjun Yu, Guokai Wang, Weidong Chen
Frontiers in Cardiovascular Medicine.2022;[Epub] CrossRef - The Regulatory Roles of Polysaccharides and Ferroptosis-Related Phytochemicals in Liver Diseases
Yijing Ren, Siyue Li, Zixuan Song, Qiuping Luo, Yingying Zhang, Hao Wang
Nutrients.2022; 14(11): 2303. CrossRef - Astaxanthin Alleviates Nonalcoholic Fatty Liver Disease by Regulating the Intestinal Flora and Targeting the AMPK/Nrf2 Signal Axis
Yuhang Li, Juxiong Liu, Bojian Ye, Yueyao Cui, Ruiqi Geng, Shu Liu, Yufei Zhang, Wenjin Guo, Shoupeng Fu
Journal of Agricultural and Food Chemistry.2022; 70(34): 10620. CrossRef - Application of metabolomics in the diagnosis of non-alcoholic fatty liver disease and the treatment of traditional Chinese medicine
Mingmei Shao, Yifei Lu, Hongjiao Xiang, Junmin Wang, Guang Ji, Tao Wu
Frontiers in Pharmacology.2022;[Epub] CrossRef - The chemistry and efficacy benefits of polysaccharides from Atractylodes macrocephala Koidz
Congying Liu, Shengguang Wang, Zedong Xiang, Tong Xu, Mengyuan He, Qing Xue, Huaying Song, Peng Gao, Zhufeng Cong
Frontiers in Pharmacology.2022;[Epub] CrossRef - An Ethnopharmaceutical Study on the Hypolipidemic Formulae in Taiwan Issued by Traditional Chinese Medicine Pharmacies
Min-Han Chi, Jung Chao, Chien-Yu Ko, Shyh-Shyun Huang
Frontiers in Pharmacology.2022;[Epub] CrossRef - Three water soluble polysaccharides with anti-inflammatory activities from Selaginella uncinata (Desv.) Spring
Haochen Hui, Meng Gao, Xuerong Zhao, Lianhong Yin, Lina Xu, Lili Li, Jinyong Peng
International Journal of Biological Macromolecules.2022; 222: 1983. CrossRef - Research Progress on the Therapeutic Effect of Polysaccharides on Non-Alcoholic Fatty Liver Disease through the Regulation of the Gut–Liver Axis
Xiang Chen, Menghan Liu, Jun Tang, Ning Wang, Yibin Feng, Haotian Ma
International Journal of Molecular Sciences.2022; 23(19): 11710. CrossRef - Modulation of gut microbiota by glycyrrhizic acid may contribute to its anti-NAFLD effect in rats fed a high-fat diet
Sai Wang, Xin-Yu Li, Hong-Fang Ji, Liang Shen
Life Sciences.2022; 310: 121110. CrossRef - Structural Alteration of Gut Microbiota During the Amelioration of Chronic Psychological Stress-Aggravated Diabetes-Associated Cognitive Decline by a Traditional Chinese Herbal Formula, ZiBu PiYin Recipe
Wen Zhou, Libin Zhan, Huiying Xu, Lijing Zhang
Journal of Alzheimer's Disease.2022; 90(4): 1465. CrossRef - Bacillus amyloliquefaciens SC06 in the diet improves egg quality of hens by altering intestinal microbiota and the effect is diminished by antimicrobial peptide
Shujie Xu, Fei Wang, Peng Zou, Xiang Li, Qian Jin, Qi Wang, Baikui Wang, Yuanhao Zhou, Li Tang, Dongyou Yu, Weifen Li
Frontiers in Nutrition.2022;[Epub] CrossRef - Effect of stigma maydis polysaccharide on the gut microbiota and transcriptome of VPA induced autism model rats
Xiaolei Yang, Jiyuan Li, Yang Zhou, Ning Zhang, Jicheng Liu
Frontiers in Microbiology.2022;[Epub] CrossRef -
Salvia miltiorrhiza extract may exert an anti-obesity effect in rats with high-fat diet-induced obesity by modulating gut microbiome and lipid metabolism
Zi-Li Ai, Xian Zhang, Wei Ge, You-Bao Zhong, Hai-Yan Wang, Zheng-Yun Zuo, Duan-Yong Liu
World Journal of Gastroenterology.2022; 28(43): 6131. CrossRef - Dysregulated hepatic lipid metabolism and gut microbiota associated with early-stage NAFLD in ASPP2-deficiency mice
Fang Xie, Hang-fei Xu, Jing Zhang, Xiao-ni Liu, Bu-xin Kou, Meng-yin Cai, Jing Wu, Jin-ling Dong, Qing-hua Meng, Yi Wang, Dexi Chen, Yang Zhang
Frontiers in Immunology.2022;[Epub] CrossRef - Structural elucidation and anti-nonalcoholic fatty liver disease activity of Polygonatum cyrtonema Hua polysaccharide
Wei Liu, Taili Shao, Lei Tian, Zhengrui Ren, Lan Gao, Zhiyan Tang, Zheng Fang, Pingchuan Yuan, Chunyan Liu, Jikun Li, Guodong Wang, Jun Han
Food & Function.2022; 13(24): 12883. CrossRef - The protective effects of sulforaphane on high-fat diet-induced metabolic associated fatty liver disease in mice via mediating the FXR/LXRα pathway
Shaotong Ma, Xinyi Pang, Shuhua Tian, Jing Sun, Qiaobin Hu, Xiangfei Li, Yingjian Lu
Food & Function.2022; 13(24): 12966. CrossRef - Suppression of obesity and inflammation by polysaccharide from sporoderm-broken spore of Ganoderma lucidum via gut microbiota regulation
Tingting Sang, Chengjie Guo, Dandan Guo, Jianjun Wu, Yujie Wang, Ying Wang, Jiajun Chen, Chaojie Chen, Kaikai Wu, Kun Na, Kang Li, Liu Fang, Cuiling Guo, Xingya Wang
Carbohydrate Polymers.2021; 256: 117594. CrossRef - Annual review of LSD1/KDM1A inhibitors in 2020
Dong-Jun Fu, Jun Li, Bin Yu
European Journal of Medicinal Chemistry.2021; 214: 113254. CrossRef - Diet-Regulating Microbiota and Host Immune System in Liver Disease
Jung A Eom, Goo Hyun Kwon, Na Yeon Kim, Eun Ju Park, Sung Min Won, Jin Ju Jeong, Ganesan Raja, Haripriya Gupta, Yoseph Asmelash Gebru, Satyapriya Sharma, Ye Rin Choi, Hyeong Seop Kim, Sang Jun Yoon, Ji Ye Hyun, Min Kyo Jeong, Hee Jin Park, Byeong Hyun Min
International Journal of Molecular Sciences.2021; 22(12): 6326. CrossRef - Lactobacillus johnsonii BS15 combined with abdominal massage on intestinal permeability in rats with nonalcoholic fatty liver and cell biofilm repair
Wei Zhang, Huanan Li, Na Zhao, Xiongfei Luo, Siwen Liu, an Bao, Yingying Chen, Haiteng Wang, Junshi Wang, Jingui Wang
Bioengineered.2021; 12(1): 6354. CrossRef - Effects and Mechanisms of Probiotics, Prebiotics, Synbiotics, and Postbiotics on Metabolic Diseases Targeting Gut Microbiota: A Narrative Review
Hang-Yu Li, Dan-Dan Zhou, Ren-You Gan, Si-Yu Huang, Cai-Ning Zhao, Ao Shang, Xiao-Yu Xu, Hua-Bin Li
Nutrients.2021; 13(9): 3211. CrossRef - Correlation Analysis of Huayu Tongmai Decoction Intervention and Prognosis Indexes of Patients with Carotid Atherosclerosis
Guangqing Cheng, Xiaoni Yan, Fengmeng Wang, Chao Chen, Muhammad Wasim Khan
Evidence-Based Complementary and Alternative Medicine.2021; 2021: 1. CrossRef - Targeting the gut microbiota by Asian and Western dietary constituents: a new avenue for diabetes
Abdul Rahman Conteh, Ruixue Huang
Toxicology Research.2020; 9(4): 569. CrossRef - MiR-455 targeting SOCS3 improve liver lipid disorders in diabetic mice
Shu Fang, Jie Feng, Hongbin Zhang, Ping Li, Yudan Zhang, Yanmei Zeng, Yingying Cai, Xiaochun Lin, Yaoming Xue, Meiping Guan
Adipocyte.2020; 9(1): 179. CrossRef - Chinese Medicinal Herbs Targeting the Gut–Liver Axis and Adipose Tissue–Liver Axis for Non-Alcoholic Fatty Liver Disease Treatments: The Ancient Wisdom and Modern Science
Shuwei Zhang, Yui-Tung Wong, Ka-Yu Tang, Hiu-Yee Kwan, Tao Su
Frontiers in Endocrinology.2020;[Epub] CrossRef - Probiyotiklerin Kolon Mikrobiyotasına Etkileri: Güncel Çalışmalar
Çağlar GÖKIRMAKLI, Zeynep SEYDİM
Journal of Biotechnology and Strategic Health Research.2020; 4(3): 212. CrossRef
 PubReader
 Cite
Cite