
- Current
- Browse
- Collections
-
For contributors
- For Authors
- Instructions to authors
- Article processing charge
- e-submission
- For Reviewers
- Instructions for reviewers
- How to become a reviewer
- Best reviewers
- For Readers
- Readership
- Subscription
- Permission guidelines
- About
- Editorial policy
Articles
- Page Path
- HOME > Diabetes Metab J > Volume 44(2); 2020 > Article
-
Original ArticleCardiovascular Risk/Epidemiology Pre-existing Depression among Newly Diagnosed Dyslipidemia Patients and Cardiovascular Disease Risk
-
Jihoon Andrew Kim1,2
 , Seulggie Choi1, Daein Choi3, Sang Min Park1,4
 -
Diabetes & Metabolism Journal 2020;44(2):307-315.
DOI: https://doi.org/10.4093/dmj.2019.0002
Published online: November 1, 2019
1Department of Biomedical Sciences, Seoul National University Graduate School, Seoul, Korea.
2Changsu Health Center, Pocheon, Korea.
3Pyeongchang Health Center and County Hospital, Pyeongchang, Korea.
4Department of Family Medicine, Seoul National University Hospital, Seoul National University College of Medicine, Seoul, Korea.
- Corresponding author: Sang Min Park. Department of Family Medicine, Seoul National University Hospital, Seoul National University College of Medicine, 101 Daehak-ro, Jongno-gu, Seoul 03080, Korea. smpark.snuh@gmail.com
- *Jihoon Andrew Kim and Seulggie Choi contributed equally to this study as first authors.
Copyright © 2020 Korean Diabetes Association
This is an Open Access article distributed under the terms of the Creative Commons Attribution Non-Commercial License (http://creativecommons.org/licenses/by-nc/4.0/) which permits unrestricted non-commercial use, distribution, and reproduction in any medium, provided the original work is properly cited.
ABSTRACT
-
Background
- Whether depression before diagnosis of dyslipidemia is associated with higher cardiovascular disease (CVD) risk among newly diagnosed dyslipidemia patients is yet unclear.
-
Methods
- The study population consisted of 72,235 newly diagnosed dyslipidemia patients during 2003 to 2012 from the National Health Insurance Service–Health Screening Cohort of South Korea. Newly diagnosed dyslipidemia patients were then detected for pre-existing depression within 3 years before dyslipidemia diagnosis. Starting from 2 years after the diagnosis date, patients were followed up for CVD until 2015. Adjusted hazard ratios (aHRs) and 95% confidence intervals (CIs) for CVD were calculated by Cox proportional hazards regression.
-
Results
- Compared to dyslipidemia patients without depression, those with depression had higher risk for CVD (aHR, 1.24; 95% CI, 1.09 to 1.41). Similarly, pre-existing depression was associated with increased risk for stroke (aHR, 1.27; 95% CI, 1.06 to 1.53). The risk for CVD among depressed dyslipidemia patients for high (aHR, 1.42; 95% CI, 1.06 to 1.90), medium (aHR, 1.17; 95% CI, 0.91 to 1.52), and low (aHR, 1.25; 95% CI, 1.05 to 1.50) statin compliance patients tended to be increased compared to patients without pre-existing dyslipidemia. The risk-elevating effect of depression on CVD tended to be preserved regardless of subgroups of smoking, alcohol consumption, physical activity, and body mass index.
-
Conclusion
- Dyslipidemia patients with pre-existing depression had increased risk for CVD. Future studies that determine CVD risk after management of depression among dyslipidemia patients are needed.
- Dyslipidemia is one of the most prevalent chronic diseases worldwide. In the United States alone, it is estimated that more than 100 million adults have total cholesterol levels of 200 mg/dL or higher and 31 million adults with total cholesterol levels of 240 mg/dL or higher [1]. Similarly, a previous study estimated that 19.5% of adults in South Korea have dyslipidemia in 2015 [2]. Furthermore, dyslipidemia patients are at increased risk for cardiovascular disease (CVD), the leading cause of death globally. Naturally, most guidelines of dyslipidemia management are focused on risk assessment for future CVD risk [34]. Therefore, it is of clinical importance to identify and manage risk factors associated with CVD among dyslipidemia patients.
- Depression has previously been associated with CVD among the general population. According to a systematic review and meta-analysis in 2007, depression was associated with increased myocardial infarction, stroke, and CVD risk [5]. Similarly, another study showed that depression was associated with increased risk of coronary heart disease (CHD) from a pooled analysis of 54 observational studies [6]. Such studies, however, were conducted within the general population. As dyslipidemia patients are at increased risk for CVD, the relationship between depression and CVD among dyslipidemia patients may differ from that of the general population. However, whether depression is a risk factor for CVD among dyslipidemia patients has not yet been explored.
- Therefore, we attempted to investigate the association of pre-existing depression among newly diagnosed dyslipidemia patients on CVD using the Korean National Health Insurance Service (NHIS) database.
INTRODUCTION
- Participants
- The study population was derived from the National Health Insurance Service–Health Screening Cohort (NHIS-HEALS). In South Korea, the NHIS provides mandatory health insurance covering nearly all forms of health services for all Korean citizens, resulting in an enrollment rate of approximately 98% [7]. Furthermore, the NHIS collects all insurance covered records from inpatient and outpatient department visits, drug prescriptions, and procedural or surgical treatments. For all enrollees aged 40 years or older, a biannual health screening examination service is provided by the NHIS, which includes a self-reported questionnaire of health behavior, body measurements including height, weight, and blood pressure, and blood and urine tests [8]. From this claims database, the NHIS provides a part of their data for research purposes, which include information on all hospital use, pharmaceutical prescriptions, and results from the health screening examinations. Several previous studies have used the NHIS database for research purposes and its validity is described in detail elsewhere [7].
- Ethics
- This study was approved by the Institutional Review Board of Seoul National University Hospital (IRB number: E-1803-046-928). The requirement for informed consent was waived as the NHIS-HEALS database is anonymized according to strict confidentiality guidelines prior to distribution.
- Key variables
- Dyslipidemia patients were detected when a participant was prescribed statin medication under the International Classification of Diseases, Tenth Revision (ICD-10) codes for dyslipidemia (E78) as the primary or secondary diagnosis. The first date of statin prescription with the primary or secondary diagnosis for dyslipidemia was used as the diagnosis date. Statin compliance was detected between the diagnosis and index dates, or the first 2 years of dyslipidemia diagnosis. Medication possession ratio (MPR) was used to determine statin compliance, which is calculated by dividing the cumulative daily defined dose during the 3 years by the difference between the last and first prescription dates [9].
- Depression was defined as having visited the outpatient psychiatry department at least twice or hospitalized at least once due to ICD-10 codes for depression (F32, F33). The definition of depression was adapted from another study [10]. CVD was defined when a participant was hospitalized for at least 2 days or died due to CVD, which was adapted from previous studies that used the NHIS database [1112]. CVD included CHD (ICD-10 codes I20–I25) and stroke (ICD-10 codes I60–I69). The ICD-10 codes pertaining to CVD, CHD, and stroke were adapted from the American Heart Association guidelines [1].
- Statistical analysis
- Chi-square tests and t-tests were conducted to determine the difference in proportions of descriptive characteristics according to depression for men and women. Cox proportional hazards regression analysis was used to determine the adjusted hazard ratios (aHRs) and 95% confidence intervals (CIs) for CVD risk according to pre-existing depression before dyslipidemia diagnosis. Upon analysis, the considered covariates included age (continuous, years), sex (categorical, men and women), household income (categorical, 1st, 2nd, 3rd, and 4th quartiles), smoking (categorical, never, past, and current smokers), alcohol consumption (categorical, none, <1, 1 to 2, 3 to 4, and ≥5 times per week), physical activity (categorical, none, 1 to 2, 3 to 4, 5 to 6, and 7 times per week), body mass index (continuous, kg/m2), systolic blood pressure (continuous, mm Hg), fasting serum glucose (continuous, mg/dL), total cholesterol (continuous, mg/dL), statin compliance (continuous, MPR), Charlson comorbidity index (continuous), and index year (continuous). Household income was determined by the insurance premium and body mass index by dividing the weight in kilograms by height in meters squared.
- Two stratified analyses were conducted. First, the association of depression on CVD among newly diagnosed dyslipidemia patients were determined according to subgroups of high (MPR ≥0.8), medium (0.5 to 0.7), and low (<0.5) statin compliance. Second, a separate subgroup analysis was conducted for subgroups of smoking, physical activity, alcohol consumption, and body mass index on the association of depression on CVD. A sensitivity analysis on the association of pre-existing depression on CVD according to non-fatal and fatal CVD was conducted. Furthermore, another sensitivity analysis was conducted by examining CVD risk according to depression among dyslipidemia patients with MPR of 0.5 or higher. Finally, the association of pre-existing depression on the risk of CVD was determined after propensity score matching with consideration of all covariates. Using a caliper of 0.2 times the standard deviation of the logit propensity score, a matching ratio of 1:1 was used.
- Statistical significance was defined as a P value of <0.05 in a two-sided manner. All data analyses were conducted using SAS version 9.4 (SAS Institute Inc., Cary, NC, USA).
METHODS
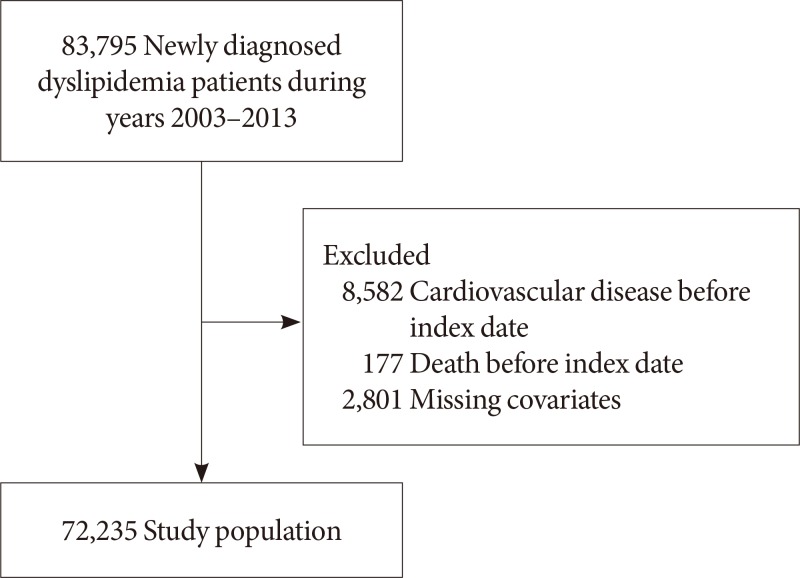
- Fig. 1 shows the flow diagram of the study population. Among 83,795 newly diagnosed dyslipidemia patients aged 40 years or older with health screening data during 2003 to 2012, we excluded 8,582 and 177 patients diagnosed with CVD or who died before the index date or within 2 years after dyslipidemia diagnosis. Furthermore, 2,801 patients with missing values on covariates were excluded, resulting in a study population of 72,235 participants. All patients were detected for depression within 3 years before the diagnosis date for dyslipidemia. The index date was set at 2 years after the diagnosis date for each patient, starting from which all participants were followed up for CVD until the date of death or 31 December 2015.
- Table 1 depicts the descriptive characteristics of the study population. The number of dyslipidemia patients without and with depression were 31,590 and 772 for men and 37,857 and 2,016 for women, respectively. The mean±standard deviation of age for non-depressed and depressed participants were 58.0±8.4 and 60.3±9.2 years for men and 60.4±8.2 and 62.0±8.4 years for women, respectively. Among men, depressed patients were older, consume less alcohol, have lower body mass index, systolic blood pressure, fasting serum glucose, and have more comorbidities compared to those without depression (all P<0.05).
- The association of pre-existing depression on CVD among dyslipidemia patients is shown in Table 2. Compared to patients without depression, those with depression had higher risk for CVD (aHR, 1.24; 95% CI, 1.09 to 1.41). There was a tendency towards elevated risk for CHD among depressed patients compared to those without depression (aHR, 1.20; 95% CI, 1.00 to 1.44). Similarly, patients with depression had increased risk for stroke (aHR, 1.27; 95% CI, 1.06 to 1.53) compared to those without depression. For men and women, the aHR for CVD among depression patients were 1.18 (95% CI, 0.94 to 1.49) and 1.26 (95% CI, 1.07 to 1.48), respectively. As shown in Supplementary Table 1, depression was associated with higher risk for non-fatal CVD (aHR, 1.25; 95% CI, 1.10 to 1.43). Moreover, there was a risk-increasing association of depression for CVD risk (aHR, 1.28; 95% CI, 1.04 to 1.58) among dyslipidemia patients with MPR of 0.5 or higher (Supplementary Table 2). Finally, Supplementary Table 3 depicts that depression was associated with higher risk for CVD (aHR, 1.39; 95% CI, 1.13 to 1.72) after propensity score matching for all covariates.
- Table 3 depicts the relationship between depression and CVD according to subgroups of statin medication compliance. Compared to patients without depression, depressed patients tended to have higher risk for CVD among those with high (aHR, 1.42; 95% CI, 1.06 to 1.90), medium (aHR, 1.17; 95% CI, 0.91 to 1.52), and low (aHR, 1.25; 95% CI, 1.05 to 1.50) statin compliance. The stratified analysis of the association of depression on CVD according to subgroups of lifestyle behaviors is shown in Table 4. There was a tendency towards increased risk among depressed participants for CVD according to subgroups of smoking, alcohol consumption, physical activity, and body mass index.
RESULTS
- In our study, we demonstrated that newly diagnosed dyslipidemia patients with pre-existing depression had higher risk for CVD. This association held true regardless of statin compliance, smoking, alcohol consumption, and physical activity. To our knowledge, this is the first study to investigate the association between pre-diagnosis depression and CVD among newly diagnosed dyslipidemia patients.
- Multiple previous studies have investigated the association of depression on CVD within the general population. In a systematic review and meta-analysis on the link between depression and CVD risk, Van der Kooy et al. [5] determined that depression was associated with higher risk for myocardial infarction (adjusted odds ratio [aOR], 1.60; 95% CI, 1.34 to 1.92), CHD (aHR, 1.48; 95% CI, 1.29 to 1.69), stroke (aOR, 1.43; 95% CI, 1.17 to 1.75), and CVD (aOR, 1.63; 95% CI, 1.26 to 2.12) [5]. In another study investigating the association between mental disorders and CVD, Goodwin et al. [13] showed that major depression was associated with higher risk for CVD among the general population (aOR, 1.22; 95% CI, 1.00 to 1.58). Finally, another meta-analysis from 54 observational studies by Nicholson et al. [6] also depicted that depression was associated with increased risk of CHD (relative risk, 1.81; 95% CI, 1.53 to 2.15). The results from our study further adds to those of previous reports by demonstrating that the risk-increasing effect of depression on CVD also held true for dyslipidemia patients.
- The two primary pathways that could explain the relationship between depression and elevated CVD risk are the hypothalamic-pituitary-adrenal axis [1415] and autonomic nervous system [161718192021]. Furthermore, an additional pathway that could have played a role in the risk-increasing effect of depression on CVD among dyslipidemia patients is lipid metabolism. Previously, a number of studies have shown that depression was associated with deteriorating lipid control and higher risk of dyslipidemia. In 2010, van Reedt Dortland et al. [22] explored the association of depression and anxiety on metabolic syndrome. They found that very severe depression was associated with higher prevalence of metabolic syndrome (aOR, 2.21; 95% CI, 1.06 to 4.64) [22]. Furthermore, it was revealed that hypertriglyceridemia and low high density lipoprotein (HDL) cholesterol both contributed significantly to the association between depression and metabolic syndrome [22]. In another study, it was also shown that initial higher depression severity was associated with reduced HDL levels after 2 years [23]. In addition to the deteriorating lipid metabolism upon depression depicted in previous studies, we were able to demonstrate that pre-existing depression among newly diagnosed dyslipidemia patients was also associated with higher risk for CVD, a major complication of worsening lipid metabolism.
- Outside of lipid control, one other primary factor that could affect the relationship between depression and CVD is medication compliance. In a meta-analysis on the association of depression on medication compliance, DiMatteo et al. [24] demonstrated that depression was significantly associated with higher risk for medical treatment noncompliance (aOR, 3.03; 95% CI, 1.96 to 4.89). This is particularly relevant in our study, as our study population consisted of dyslipidemia patients who were prescribed statin medications. Therefore, it could be argued that the risk-increasing effect of depression on CVD could partly be due to the possible low adherence to statins of depressed dyslipidemia patients [25]. In order to account for this, we conducted a subgroup analysis according to statin compliance determined by MPR and demonstrated that depression was associated with elevated CVD risk among subgroups of low, middle, and high statin compliance. The higher risk observed for depression patients among those with MPR of 0.8 or higher can be explained by the fact that this risk assessment was conducted among those with higher statin compliance only, thus removing the possible CVD risk-increasing effect of non-compliance [26] and accentuating the risk-increasing effect of depression on CVD [6].
- Depression has also previously been linked to increased smoking and alcohol consumption, obesity, and lower physical activity rates [27]. Therefore, such lifestyle factors could act as important confounders in the relationship between depression and CVD. As such, we conducted multiple subgroup analyses according to subgroups of smoking, alcohol, physical activity, and obesity. In our study, we showed that dyslipidemia patients with depression had higher CVD risk among most subgroups of smoking, alcohol, physical activity, and body mass index. The higher risk observed for depression patients among never smokers may be due to the fact that this particular subgroup is composed of those not exposed to the potential confounding effect of smoking [28], and are thus perhaps more prone to the risk-increasing effect of depression on CVD [5].
- Several limitations must be considered upon interpreting the results from our study. First, depression was determined by using ICD-10 codes from a claims database and is not thus verified by medical records, which may have led to reduced accuracy of depression diagnosis. Although a number of previous studies also used ICD-10 codes to define depression in a similar manner [1029], future studies that use a more accurate definition of depression are needed. Second, depression was only determined 3 years prior to dyslipidemia diagnosis. Therefore, whether dyslipidemia patients were diagnosed with depression after diagnosis was not considered and merit further studies. Third, the definition of CVD could not be validated by medical records. Although the operational definition for CVD was adopted from previous studies that also used the NHIS database [1112], future studies with a narrower definition of CVD, perhaps by using procedural codes for cardiovascular interventions or coronary artery bypass grafting operations are needed. Fourth, we could not adjust for certain potential confounders such as education due to the lack of information. We attempted to compensate for this by adjusting for household income, which could act as a surrogate marker for education. Finally, this study was limited to Korean citizens of Asian ethnicity. Future studies that use a more diverse study population are needed to further validate the findings from this study.
- Nonetheless, our study has a number of strengths. First, our study population consisted of newly diagnosed dyslipidemia patients, a group that has not previously been studied on the relationship between depression and CVD. Second, we attempted to enhance the validity of our findings by adjusting for a wide range of covariates, particularly lifestyle factors and statin medication compliance. Third, the longitudinal nature of our study design and relatively large study population further increases the reliability of our findings. Specifically, previous reports have suggested that subclinical CVD may precede depression rather than depression being a risk factor for CVD [3031]. We attempted to highlight the cause-and-effect relationship of depression preceding CVD by excluding depression patients diagnosed with CVD within the first 2 years after dyslipidemia diagnosis.
- In conclusion, dyslipidemia patients with pre-existing depression had higher risk for CVD. Future studies that determine whether depression management among dyslipidemia patients is associated with reduced CVD risk are needed to validate our findings.
DISCUSSION
-
Acknowledgements
- This research was supported by the Basic Science Research Program through the National Research Foundation of Korea funded by the Ministry of Education (grant number 2017R1D1A1B03033721) and the Seoul National University Hospital research fund (grant number 04-2018-0370). Seulggie Choi received a grant from the BK21-plus education program from the National Research Foundation of Korea.
ACKNOWLEDGMENTS
-
CONFLICTS OF INTEREST: No potential conflict of interest relevant to this article was reported.
-
AUTHOR CONTRIBUTIONS:
Study concept and design: J.A.K., S.C., S.M.P.
Acquisition of data: J.A.K., S.C.
Analysis and interpretation of data: J.A.K., S.C., D.C., S.M.P.
Drafting of the manuscript: J.A.K., S.C., S.M.P.
Critical revision of the manuscript: J.A.K., S.C., D.C., S.M.P.
Statistical analysis: S.C.
Administrative, technical, or material support: D.C.
NOTES
SUPPLEMENTARY MATERIALS
Supplementary Table 1
Supplementary Table 2
Supplementary Table 3
- 1. Writing Group Members. Mozaffarian D, Benjamin EJ, Go AS, Arnett DK, Blaha MJ, Cushman M, Das SR, de Ferranti S, Despres JP, Fullerton HJ, Howard VJ, Huffman MD, Isasi CR, Jimenez MC, Judd SE, Kissela BM, Lichtman JH, Lisabeth LD, Liu S, Mackey RH, Magid DJ, McGuire DK, Mohler ER 3rd, Moy CS, Muntner P, Mussolino ME, Nasir K, Neumar RW, Nichol G, Palaniappan L, Pandey DK, Reeves MJ, Rodriguez CJ, Rosamond W, Sorlie PD, Stein J, Towfighi A, Turan TN, Virani SS, Woo D, Yeh RW, Turner MB. American Heart Association Statistics Committee. Stroke Statistics Subcommittee. Heart disease and stroke statistics-2016 update: a report from the American Heart Association. Circulation 2016;133:e38-e360. PubMed
- 2. Jeong JS, Kwon HS. Prevalence and clinical characteristics of dyslipidemia in Koreans. Endocrinol Metab (Seoul) 2017;32:30-35. ArticlePubMedPMCPDF
- 3. Authors/Task Force Members. Catapano AL, Graham I, De Backer G, Wiklund O, Chapman MJ, Drexel H, Hoes AW, Jennings CS, Landmesser U, Pedersen TR, Reiner Z, Riccardi G, Taskinen MR, Tokgozoglu L, Verschuren WM, Vlachopoulos C, Wood DA, Zamorano JL. 2016 ESC/EAS guidelines for the management of dyslipidaemias: the task force for the management of dyslipidaemias of the European Society of Cardiology (ESC) and European Atherosclerosis Society (EAS) developed with the special contribution of the European Assocciation for Cardiovascular Prevention & Rehabilitation (EACPR). Atherosclerosis 2016;253:281-344. ArticlePubMed
- 4. Jellinger PS, Handelsman Y, Rosenblit PD, Bloomgarden ZT, Fonseca VA, Garber AJ, Grunberger G, Guerin CK, Bell DSH, Mechanick JI, Pessah-Pollack R, Wyne K, Smith D, Brinton EA, Fazio S, Davidson M. American Association of Clinical Endocrinologists and American College of Endocrinology guidelines for management of dyslipidemia and prevention of cardiovascular disease. Endocr Pract 2017;23(Suppl 2):1-87.Article
- 5. Van der Kooy K, van Hout H, Marwijk H, Marten H, Stehouwer C, Beekman A. Depression and the risk for cardiovascular diseases: systematic review and meta analysis. Int J Geriatr Psychiatry 2007;22:613-626. ArticlePubMed
- 6. Nicholson A, Kuper H, Hemingway H. Depression as an aetiologic and prognostic factor in coronary heart disease: a meta-analysis of 6362 events among 146 538 participants in 54 observational studies. Eur Heart J 2006;27:2763-2774. ArticlePubMed
- 7. Seoun SC, Kim YY, Khang YH, Park JH, Kang HJ, Lee H, Do CH, Song JS, Bang JH, Ha S, Lee EJ, Shin SA. Data resource profile: the National Health Information Database of the National Health Insurance Service in South Korea. Int J Epidemiol 2017;46:799-800. PubMed
- 8. Seong SC, Kim YY, Park SK, Khang YH, Kim HC, Park JH, Kang HJ, Do CH, Song JS, Lee EJ, Ha S, Shin SA, Jeong SL. Cohort profile: the National Health Insurance Service-National Health Screening Cohort (NHIS-HEALS) in Korea. BMJ Open 2017;7:e016640.ArticlePubMedPMC
- 9. Peterson AM, Nau DP, Cramer JA, Benner J, Gwadry-Sridhar F, Nichol M. A checklist for medication compliance and persistence studies using retrospective databases. Value Health 2007;10:3-12. ArticlePubMed
- 10. Iglay K, Santorelli ML, Hirshfield KM, Williams JM, Rhoads GG, Lin Y, Demissie K. Impact of preexisting mental illness on all-cause and breast cancer-specific mortality in elderly patients with breast cancer. J Clin Oncol 2017;35:4012-4018. ArticlePubMed
- 11. Son JS, Choi S, Kim K, Kim SM, Choi D, Lee G, Jeong SM, Park SY, Kim YY, Yun JM, Park SM. Association of blood pressure classification in Korean young adults according to the 2017 American College of Cardiology/American Heart Association guidelines with subsequent cardiovascular disease events. JAMA 2018;320:1783-1792. ArticlePubMedPMC
- 12. Choi S, Kim K, Kim SM, Lee G, Jeong SM, Park SY, Kim YY, Son JS, Yun JM, Park SM. Association of obesity or weight change with coronary heart disease among young adults in South Korea. JAMA Intern Med 2018;178:1060-1068. ArticlePubMedPMC
- 13. Goodwin RD, Davidson KW, Keyes K. Mental disorders and cardiovascular disease among adults in the United States. J Psychiatr Res 2009;43:239-246. ArticlePubMed
- 14. Schlaich MP, Kaye DM, Lambert E, Sommerville M, Socratous F, Esler MD. Relation between cardiac sympathetic activity and hypertensive left ventricular hypertrophy. Circulation 2003;108:560-565. ArticlePubMed
- 15. Veith RC, Lewis N, Linares OA, Barnes RF, Raskind MA, Villacres EC, Murburg MM, Ashleigh EA, Castillo S, Peskind ER, Pascualy M, Halter JB. Sympathetic nervous system activity in major depression. Basal and desipramine-induced alterations in plasma norepinephrine kinetics. Arch Gen Psychiatry 1994;51:411-422. ArticlePubMed
- 16. Dhar AK, Barton DA. Depression and the link with cardiovascular disease. Front Psychiatry 2016;7:33. ArticlePubMedPMC
- 17. Fiedorowicz JG. Depression and cardiovascular disease: an update on how course of illness may influence risk. Curr Psychiatry Rep 2014;16:492. ArticlePubMedPMCPDF
- 18. Kemp AH, Quintana DS, Gray MA, Felmingham KL, Brown K, Gatt JM. Impact of depression and antidepressant treatment on heart rate variability: a review and meta-analysis. Biol Psychiatry 2010;67:1067-1074. ArticlePubMed
- 19. Ghiadoni L, Donald AE, Cropley M, Mullen MJ, Oakley G, Taylor M, O'Connor G, Betteridge J, Klein N, Steptoe A, Deanfield JE. Mental stress induces transient endothelial dysfunction in humans. Circulation 2000;102:2473-2478. ArticlePubMed
- 20. Howren MB, Lamkin DM, Suls J. Associations of depression with C-reactive protein, IL-1, and IL-6: a meta-analysis. Psychosom Med 2009;71:171-186. ArticlePubMed
- 21. Dowlati Y, Herrmann N, Swardfager W, Liu H, Sham L, Reim EK, Lanctot KL. A meta-analysis of cytokines in major depression. Biol Psychiatry 2010;67:446-457. ArticlePubMed
- 22. van Reedt Dortland AK, Giltay EJ, van Veen T, Zitman FG, Penninx BW. Metabolic syndrome abnormalities are associated with severity of anxiety and depression and with tricyclic antidepressant use. Acta Psychiatr Scand 2010;122:30-39. ArticlePubMed
- 23. van Reedt Dortland AK, Giltay EJ, van Veen T, Zitman FG, Penninx BW. Longitudinal relationship of depressive and anxiety symptoms with dyslipidemia and abdominal obesity. Psychosom Med 2013;75:83-89. ArticlePubMed
- 24. DiMatteo MR, Lepper HS, Croghan TW. Depression is a risk factor for noncompliance with medical treatment: meta-analysis of the effects of anxiety and depression on patient adherence. Arch Intern Med 2000;160:2101-2107. ArticlePubMed
- 25. Gehi A, Haas D, Pipkin S, Whooley MA. Depression and medication adherence in outpatients with coronary heart disease: findings from the Heart and Soul Study. Arch Intern Med 2005;165:2508-2513. ArticlePubMedPMC
- 26. Rosenson RS. Statin non-adherence: clinical consequences and proposed solutions. F1000Res 2016;5:F1000 Faculty Rev-714.ArticlePubMedPMCPDF
- 27. Stapelberg NJ, Neumann DL, Shum DH, McConnell H, Hamilton-Craig I. A topographical map of the causal network of mechanisms underlying the relationship between major depressive disorder and coronary heart disease. Aust N Z J Psychiatry 2011;45:351-369. ArticlePubMedPDF
- 28. Messner B, Bernhard D. Smoking and cardiovascular disease: mechanisms of endothelial dysfunction and early atherogenesis. Arterioscler Thromb Vasc Biol 2014;34:509-515. PubMed
- 29. Oh KH, Choi H, Kim EJ, Kim HJ, Cho SI. Depression and risk of tuberculosis: a nationwide population-based cohort study. Int J Tuberc Lung Dis 2017;21:804-809. ArticlePubMed
- 30. Alexopoulos GS, Meyers BS, Young RC, Campbell S, Silbersweig D, Charlson M. ‘Vascular depression’ hypothesis. Arch Gen Psychiatry 1997;54:915-922. ArticlePubMed
- 31. Hare DL, Toukhsati SR, Johansson P, Jaarsma T. Depression and cardiovascular disease: a clinical review. Eur Heart J 2014;35:1365-1372. ArticlePubMed
REFERENCES
Descriptive characteristics of the study population
Hazard ratios for cardiovascular disease according to depression within 3 years before diagnosis for dyslipidemia
aHR, adjusted hazard ratio; CI, confidence interval.
aHazard ratio calculated by Cox proportional hazards regression analysis after adjustments for age, sex, household income, smoking, physical activity, alcohol consumption, body mass index, systolic blood pressure, total cholesterol, fasting serum glucose, statin compliance, Charlson comorbidity index and index year.
Stratified analysis on the association of depression within 3 years before dyslipidemia diagnosis on cardiovascular disease according to subgroups of statin medication compliance
MPR, medication possession ratio.
aHazard ratio calculated by Cox proportional hazards regression analysis after adjustments for age, sex, household income, smoking, physical activity, alcohol consumption, body mass index, systolic blood pressure, total cholesterol, fasting serum glucose, Charlson comorbidity index, and index year.
Stratified analysis on the association of depression within 3 years before dyslipidemia diagnosis on cardiovascular disease according to subgroups of smoking, physical activity, alcohol consumption, and body mass index
aHazard ratio calculated by Cox proportional hazards regression analysis after adjustments for age, sex, household income, smoking, physical activity, alcohol consumption, body mass index, systolic blood pressure, total cholesterol, fasting serum glucose, statin compliance, Charlson comorbidity index, and index year.
Figure & Data
References
Citations
- Mediating effect of depression on the association between cardiovascular disease and the risk of all‐cause mortality: NHANES in 2005−2018
Xinxin Ma, Huan Zhang, Yuan Tian, Yaping Wang, Ling Liu, Lei Wang
Clinical Cardiology.2023; 46(11): 1380. CrossRef - Associations of sleep duration, daytime napping, and snoring with depression in rural China: a cross-sectional study
Xueyao Zhang, Guangxiao Li, Chuning Shi, Yingxian Sun
BMC Public Health.2023;[Epub] CrossRef - Association between socioeconomic inequality and the global prevalence of anxiety and depressive disorders: an ecological study
Fatemeh Shahbazi, Marjan Shahbazi, Jalal Poorolajal
General Psychiatry.2022; 35(3): e100735. CrossRef - Impact of Alexithymia on the Lipid Profile in Major Depressed Individuals
Camille Point, Benjamin Wacquier, Marjorie Dosogne, Mohammed Al Faker, Hadrien Willame, Gwenolé Loas, Matthieu Hein, Philip W. Wertz
Journal of Lipids.2022; 2022: 1. CrossRef - Association of Depression With Cardiovascular Diseases
Zain I Warriach, Sruti Patel, Fatima Khan, Gerardo F Ferrer
Cureus.2022;[Epub] CrossRef - Fenofibrate add-on to statin treatment is associated with low all-cause death and cardiovascular disease in the general population with high triglyceride levels
Kyung-Soo Kim, Sangmo Hong, Kyungdo Han, Cheol-Young Park
Metabolism.2022; 137: 155327. CrossRef - Dyslipidemia prevalence and trends among adult mental disorder inpatients in Beijing, 2005–2018: A longitudinal observational study
Fude Yang, Qiuyue Ma, Botao Ma, Wenzhan Jing, Jue Liu, Moning Guo, Juan Li, Zhiren Wang, Min Liu
Asian Journal of Psychiatry.2021; 57: 102583. CrossRef - Non-HDL cholesterol level and depression among Canadian elderly—a cross-sectional analysis of the baseline data from the CLSA
Jian Liu, Surim Son, Mike Giancaterino, Chris P. Verschoor, Miya Narushima, David Moher
FACETS.2020; 5(1): 1006. CrossRef
 PubReader
 Cite
Cite


