
- Current
- Browse
- Collections
-
For contributors
- For Authors
- Instructions to authors
- Article processing charge
- e-submission
- For Reviewers
- Instructions for reviewers
- How to become a reviewer
- Best reviewers
- For Readers
- Readership
- Subscription
- Permission guidelines
- About
- Editorial policy
Articles
- Page Path
- HOME > Diabetes Metab J > Volume 44(1); 2020 > Article
-
Original ArticleClinical Complications Incidence and Risk Factors for Dementia in Type 2 Diabetes Mellitus: A Nationwide Population-Based Study in Korea
-
Ji Hee Yu1
 , Kyungdo Han2, Sanghyun Park2, Hanna Cho3, Da Young Lee1, Jin-Wook Kim4, Ji A Seo1, Sin Gon Kim5, Sei Hyun Baik6, Yong Gyu Park2, Kyung Mook Choi6, Seon Mee Kim4, Nan Hee Kim1
 -
Diabetes & Metabolism Journal 2020;44(1):113-124.
DOI: https://doi.org/10.4093/dmj.2018.0216
Published online: November 12, 2019
1Division of Endocrinology and Metabolism, Department of Internal Medicine, Korea University Ansan Hospital, Korea University College of Medicine, Ansan, Korea.
2Department of Biostatistics, College of Medicine, The Catholic University of Korea, Seoul, Korea.
3Department of Neurology, Gangnam Severance Hospital, Yonsei University College of Medicine, Seoul, Korea.
4Department of Family Medicine, Korea University Guro Hospital, Korea University College of Medicine, Seoul, Korea.
5Division of Endocrinology and Metabolism, Department of Internal Medicine, Korea University Anam Hospital, Korea University College of Medicine, Seoul, Korea.
6Division of Endocrinology and Metabolism, Department of Internal Medicine, Korea University Guro Hospital, Korea University College of Medicine, Seoul, Korea.
- Corresponding author: Nan Hee Kim. Division of Endocrinology and Metabolism, Department of Internal Medicine, Korea University Ansan Hospital, Korea University College of Medicine, 123 Jeokgeum-ro, Danwon-gu, Ansan 15355, Korea. nhkendo@gmail.com
- Corresponding author: Seon Mee Kim. Department of Family Medicine, Korea University Guro Hospital, Korea University College of Medicine, 148 Gurodong-ro, Guro-gu, Seoul 08308, Korea. ksmpdh@korea.ac.kr
Copyright © 2020 Korean Diabetes Association
This is an Open Access article distributed under the terms of the Creative Commons Attribution Non-Commercial License (http://creativecommons.org/licenses/by-nc/4.0/) which permits unrestricted non-commercial use, distribution, and reproduction in any medium, provided the original work is properly cited.
ABSTRACT
-
Background
- Diabetes mellitus is associated with an increased risk of dementia. We aimed to comprehensively analyze the incidence and risk factors for dementia and young-onset dementia (YOD) in diabetic patients in Korea using the National Health Insurance Service data.
-
Methods
- Between January 1, 2009 and December 31, 2012, a total of 1,917,702 participants with diabetes were included and followed until the date of dementia diagnosis or until December 31, 2015. We evaluated the incidence and risk factors for all dementia, Alzheimer's disease (AD), and vascular dementia (VaD) by Cox proportional hazards analyses. We also compared the impact of risk factors on the occurrence of YOD and late-onset dementia (LOD).
-
Results
- During an average of 5.1 years of follow-up, the incidence of all types of dementia, AD, or VaD was 9.5, 6.8, and 1.3/1,000 person-years, respectively, in participants with diabetes. YOD comprised 4.8% of all dementia occurrence, and the ratio of AD/VaD was 2.1 for YOD compared with 5.5 for LOD. Current smokers and subjects with lower income, plasma glucose levels, body mass index (BMI), and subjects with hypertension, dyslipidemia, vascular complications, depression, and insulin treatment developed dementia more frequently. Vascular risk factors such as smoking, hypertension, and previous cardiovascular diseases were more strongly associated with the development of VaD than AD. Low BMI and a history of stroke or depression had a stronger influence on the development of YOD than LOD.
-
Conclusion
- The optimal management of modifiable risk factors may be important for preventing dementia in subjects with diabetes mellitus.
- Dementia is a global epidemic; the number of people with dementia worldwide was estimated at 47.47 million in 2015 and expected to reach 135.46 million in 2050 [1]. In several studies and meta-analyses, diabetes was estimated to increase the risk of dementia by approximately 50% [2]. This increased risk in subjects with type 2 diabetes mellitus translates into an average earlier onset of dementia of 2.5 years compared with subjects without diabetes [3].
- Whether diabetes is an actual risk factor for Alzheimer's disease (AD) has been the focus of many studies [4]; however, the risk factors for dementia in patients with diabetes have been evaluated in relatively few studies [56]. Results from previous studies showed that diabetic participants with poor glycemic control [7], long duration of diabetes [5], pre-existing micro- or macrovascular complications [58], and severe hypoglycemia [8] were at increased risk of dementia. However, in those studies, the number of study participants was small [57], the assessment of confounding factors was limited [68], and no differentiation between specific types of dementia was presented [568]. In only one study in Taiwan, the relationship between diabetes and subsequent AD incidence was investigated using nationwide population data [6]. However, the authors did not have access to data such as metabolic risk factors, smoking, alcohol, and socioeconomic class, because the National Health Insurance Claim data were based only on the diagnosis codes.
- Recently, concerns have increased regarding young-onset dementia (YOD), in which symptoms occur before the age of 65 years. YOD has been estimated to comprise approximately 8% of new dementia cases in Australia [9]. Although AD is the most common type of YOD, secondary dementia is more frequent in YOD patients compared with late-onset dementia (LOD) [1011]. Due to its rarity, the diagnosis of YOD is often delayed, but has a significant psychosocial effect because the most productive years of patients' lives are affected [10].
- In the present study, the National Health Insurance Service (NHIS) data were used to estimate the effect of diabetes on the development of dementia in general, and specifically on AD or vascular dementia (VaD). Furthermore, the possible risk factors for dementia in diabetes were comprehensively investigated. Lastly, the incidence rate and specific risk factors for YOD in diabetes were examined.
INTRODUCTION
- Design, study setting, and participants
- The NHIS is a government-operated mandatory social health insurance program that covers almost the entire Korean population (approximately 97%). The NHIS in Korea comprises comprehensive sets of health information for approximately 50 million Koreans [1213]. The NHIS, which contains claims and mortality data can be accessed by all researchers whose protocols are approved by both a NHIS Review Committee and an Institutional Review Board (IRB). This study protocol was approved by the IRB of Korea University Ansan Hospital (IRB number: 2019AS0138). Informed consent was waived by the board.
- From this database, 2,482,918 individuals 40 years of age or older with diabetes who underwent health checkups provided by the NHIS between January 1, 2009 and December 31, 2012 were selected. Then, patients diagnosed with dementia prior to enrollment (n=20,652), and those with any missing data (n=544,564) were excluded. A total of 1,917,702 participants were finally included as the study population and followed up until dementia was diagnosed or until December 31, 2015 (Supplementary Fig. 1).
- Demographic factors
- Body mass index (BMI) was calculated by dividing the weight (kg) by height squared (m2). Based on BMI, participants were classified as underweight (<18.5), normal weight (18.5 to 22.9), overweight (23 to 24.9), obese (25 to 29.9), or severely obese (≥30) [14]. Blood samples were taken after an overnight fast and quality control procedures followed the Korean Association of Laboratory Quality Control guidelines.
- Detailed information regarding smoking status, alcohol consumption, physical activity, and past medical history of study participants was assessed via standardized self-reported questionnaires. Subjects were categorized as non-smokers, ex-smokers, or current smokers. Heavy drinkers were defined as individuals who consumed ≥30 g of alcohol per day [15]. Physical activity was divided into exercising less strenuously versus more than three times a week for at least 20 minutes per day. The baseline comorbidities of participants were identified based on the combination of past medical history and clinical and pharmacy International Classification of Diseases (ICD-10) codes.
- Definitions
- Individuals with diabetes were defined as either patients who were both prescribed anti-diabetic drugs and had the presence of ICD-10 codes (E11–E14), or patients with fasting glucose levels >126 mg/dL derived from the health check-up database [16]. Treatment of diabetes was defined as NHIS medication data for drugs prescribed during the same year as the health examination. Anti-diabetic medications were categorized as oral hypoglycemic agents (OHAs) and insulin. The OHAs dispensed in the pharmacy during the study period consisted of six classes (sulfonylurea, biguanide, alpha-glucosidase inhibitor, thiazolidinedione, dipeptidyl peptidase 4 inhibitor, and meglitinide). Duration of diabetes was calculated from the first diagnosis of diabetes to the baseline examination on study entry. The diagnosis of diabetic retinopathy was defined based on the ICD-10 code H36.0.
- The presence of hypertension was defined as a systolic/diastolic blood pressure ≥140/90 mm Hg or the presence of at least one claim per year for the prescription of antihypertensive agents under ICD-10 codes (I10–I13, I15). The presence of dyslipidemia was defined as total cholesterol ≥6.21 mmol/L or the presence of at least one claim per year for the prescription of antihyperlipidemic agents under ICD-10 codes (E78). Estimated glomerular filtration rate (eGFR) was calculated using the equation from the Modification of Diet in Renal Disease (MDRD) study: eGFR=175×serum creatinine−1.154×age−0.203×0.742 (for women). The eGFR <60 mL/min/1.73 m2 was defined as chronic kidney disease (CKD) [17]. The history of cardiovascular diseases (CVDs), stroke, myocardial infarction, and angina pectoris, was evaluated using standardized questionnaires. Myocardial infarction and angina pectoris were regarded as ischemic heart diseases (IHDs). Depression was defined using ICD-10 codes (F32–34).
- Dementia was determined based on prescribed anti-dementia medications (rivastigmine, galantamine, memantine, or donepezil) along with ICD-10 codes (F00, F01, F02, F03, G30, or G31) for medical expense claims submitted to the NHIS. AD was diagnosed with the F00 and G30 codes and VaD with the F01 code. Other dementias were defined based on the F02, F03, and G31 codes, and when dementia subtyping was ambiguous. Two or more dementia diagnosis codes were sometimes registered together. If primary and secondary diagnoses for dementia existed, the dementia subtype was determined based on the primary diagnosis. If all dementia codes were registered as only secondary diagnoses, the decision was delayed until the next visit. If the dementia codes were clarified as primary and secondary diagnoses at the next visit, the dementia subtype was defined from the primary diagnosis code. If dementia codes were continuously registered as only secondary diagnoses, the case was defined as “other dementia.”
- Statistical analysis
- Data are expressed as mean±standard deviation, geometric mean (95% confidence interval [CI]) or percentage. Differences between groups were identified using the Student's t-test; the chi-square test was used to assess differences in the distribution of categorical variables. The incidence rates were presented as the number of dementia occurrences per 1,000 person-years. Multiple Cox proportional hazards regression analysis was used to evaluate the association between risk factors and development of all types of dementia, AD, or VaD. A competing risk analysis was completed to determine whether accounting for deaths is a competing risk. In addition, the effect of risk factors on outcome based on age <60 years versus ≥60 years was evaluated. Because the usual age cutoff for YOD and LOD is the development of dementia at 65 years of age, the YOD and LOD were defined with a baseline age of 60 years, since average follow-up time was approximately 5 years in this study. To show the association between generalized or central obesity and incident dementia, multivariate adjusted incidence rates and hazard ratios (HRs) for dementia based on BMI and waist circumference (WC) categories were analyzed. All statistical results were analyzed using SAS version 9.4 (SAS Institute Inc., Cary, NC, USA) and a P<0.05 was considered statistically significant.
METHODS
- Development of dementia (all types, AD, VaD)
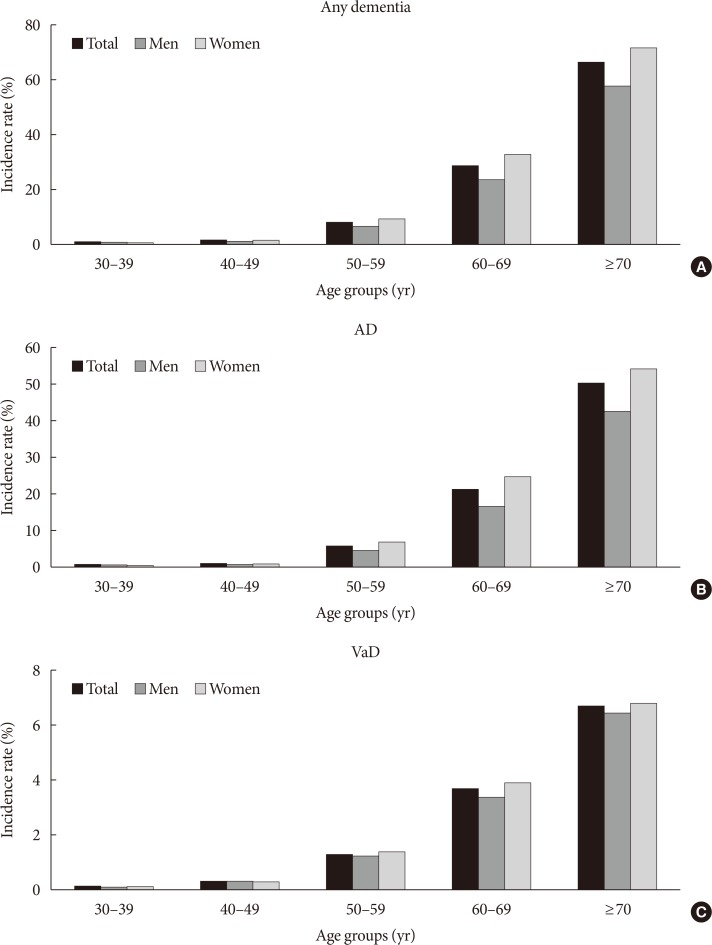
- During an average of 5.1 years of follow-up, 92,758 participants developed dementia; 66,092 developed AD, 12,813 developed VaD, and 13,853 developed other dementia. The incidence rates of all types of dementia, AD, and VaD were 9.5, 6.8, and 1.3/1,000 person-years, respectively, in participants with diabetes. Although the incidence of dementia sharply increased with age, YOD comprised 4.8% of the total dementia occurrence. The incidence rate of YOD was 0.9/1,000 person-years, in contrast to LOD, which was 17.9/1,000 person-years. AD and VaD comprised 55.7% and 26.7% of YOD and 72.0% and 13.2% of LOD, respectively. The incidence rates of total dementia, AD, and VaD per 1,000 person-years based on age groups are shown in Fig. 1.
- Baseline characteristics based on the development of dementia
- Table 1 shows the baseline characteristics of participants grouped based on future development of dementia. Participants who were older, female, non-smokers, consumed less alcohol or were non-drinkers, and did not exercise had more incident dementia. In addition, subjects who had lower income, plasma glucose levels, BMI and WC, and those with hypertension, dyslipidemia, diabetic vascular complications, and depression developed dementia more frequently. Patients who developed dementia had a longer duration of diabetes and were treated with OHAs and insulin more frequently than subjects who did not develop dementia.
- Age- and sex-adjusted risk factor analysis
- The effects of variables on the development of dementia after adjusting for age and sex were examined (Supplementary Table 1) and similar to the results shown in Table 1, except for the effects of smoking; current smoking was a risk factor for dementia in this model. When dementia was specified as AD or VaD, the effects of old age and female sex were stronger for incident AD than VaD; however, current smoking, hypertension, stroke, and CVD had higher HRs for VaD than AD. The other variables had similar effects on both AD and VaD (Supplementary Table 1).
- Multivariate analysis
- Compared with the age- and sex-adjusted model, multiple Cox proportional hazard analysis after adjusting for all variables together did not significantly modify the associations between risk factors and dementia, except for mild alcohol intake, which became a protective factor, and for dyslipidemia, which had a null effect (Table 2). When comparing AD with VaD, female sex was a risk factor only for AD. Current smoking, hypertension, and stroke showed higher HRs for VaD than AD. Fasting plasma glucose (FPG) levels ≥126 mg/dL were a protective factor for AD but were not significant for VaD. BMI had a divergent effect on dementia; low BMI (≤18.5 kg/m2) was a risk factor but high BMI (≥23 kg/m2) was a protective factor for both AD and VaD, with stronger effects on AD than VaD. However, in a competing risk analysis where death was considered a competing risk, female sex was also a risk factor for VaD as well as AD. Low BMI was not a risk factor for VaD but very high BMI (≥30 kg/m2) was a protective factor for VaD.
- Risk factors for YOD and LOD
- When the same analysis was repeated to examine the moderating effect of age (Table 3), most risk factors had a greater influence on YOD than on LOD, especially low BMI, history of stroke, and depression. However, female sex was a stronger risk factor for the development of AD in LOD than in YOD. FPG levels ≥126 mg/dL were a protective factor for AD in YOD but a risk factor for VaD in LOD.
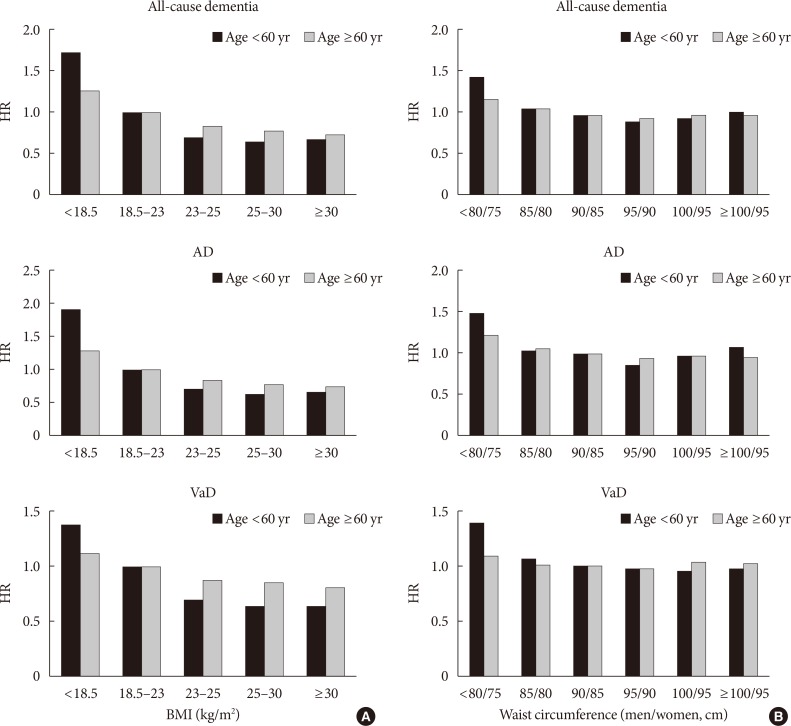
- The effects of BMI or WC on dementia based on age were compared (Fig. 2). After adjusting for several confounding factors, consistent negative associations were observed between BMI and dementia in YOD and LOD patients, with a higher impact of underweight on YOD compared with LOD (P for interaction <0.001) (Fig. 2A). A slight U-shaped association was observed between WC and dementia; lower WC (males ≤85 cm, females ≤80 cm) was associated with a higher risk of dementia. Although the effect was weaker, higher WC (males >100 cm, females >95 cm) also increased the risk of dementia regardless of age (Fig. 2B).
RESULTS
- In the present study, the incidence and risk factors for dementia were observed in participants with diabetes using Korean representative data. The overall incidence of dementia in diabetes was 9.5/1,000 person-years and increased exponentially with age. Participants at higher risk of dementia were females, smokers, had low income, long duration of diabetes, were taking more hypoglycemic agents, and had micro- and macrovascular complications, hypertension, depression, or were underweight. Mild alcohol intake, regular exercise, and being overweight were protective factors for dementia in people with diabetes. The incidence rate of YOD was 0.9/1,000 person-years, and risk factors were similar to LOD; however, the HRs of low BMI, low WC, a history of stroke, and depression were significantly higher for YOD than LOD.
- The difference between the incidence and risk factors for AD and VaD in subjects with diabetes was compared in this study. In developed countries, the ratio of AD/VaD is higher than in developing countries [18]. According to a meta-analysis of epidemiologic studies on dementia in Korea, the AD/VaD ratio increased from 1.96 in the early 1990s to 4.13 in the 2010s [19]. In the present study, the ratio was approximately 5.2 in people with diabetes, and vascular risk factors such as smoking, hypertension, and stroke showed higher HRs for VaD than AD. Because diabetes is a well-known risk factor for VaD [20], the improvement of vascular risk factor management in diabetes may be responsible for this relatively lower incidence of VaD compared with AD. In this study, the ratio of AD/VaD was 2.1 for YOD compared with 5.5 for LOD, indicating the incidence of VaD in YOD is higher than in LOD.
- In several studies, uncontrolled diabetes was shown associated with dementia in diabetic subjects [72122]. Similar to results reported in many previous publications [56], duration of diabetes and insulin treatment were risk factors for dementia in the present study; however, we found high glucose did not lead to dementia. The association of high glucose with dementia remains controversial. Bruce et al. [5] showed that glycosylated hemoglobin and fasting glucose were not associated with an increased risk of dementia, whereas Xu et al. [7] found that uncontrolled diabetes was associated with an increased risk of dementia. Poor glycemic control was associated with greater cognitive decline at 70 to 79 years of age [23], but with less decline over 80 years of age in participants with diabetes [24]. Although severe hypoglycemia is a risk factor for dementia [8], whether the lower fasting glucose levels of participants in this study indicate that more hypoglycemic events were associated with more frequent prescription of OHAs or insulin is unclear.
- In the present study, being underweight was shown a risk factor for dementia. Higher BMI was a protective factor for AD and VaD in both age groups. Controversy exists surrounding the association between obesity and dementia. In a meta-analysis, the harmful effects of higher BMI was evident in long-term follow-up, although a protective effect was evident in short-term follow-up [25], indicating that even if obesity is associated with a high risk of dementia, weight loss during the preclinical period appears a protective factor (a reverse causality). This concept was also confirmed in the Whitehall II study, in which the BMI trajectory was shown in incident dementia for 28 years [26]. The authors explain the inconsistency between studies was due to insufficient follow-up time, which did not take preclinical weight loss into account. Therefore, the 5.1-year follow-up period in the present study is insufficient for accurate differentiation between a real effect of obesity and weight loss before the onset of disease. In addition, using BMI does not distinguish between changes that are due to alterations in lean mass from adipose mass. Body weight tends to decrease as part of normal aging, which might result from a combination of muscle and adipose mass loss in late life [2728]. This age-associated change in body composition and related hormonal change may promote AD and vascular pathology. Although the mechanism related to the development of YOD has yet to be determined, underweight condition due to sarcopenia in midlife might explain the strong association between YOD and low BMI in the present study.
- In several reports the increasing problem of YOD has been demonstrated [102930]; however, the incidence and risk factors have been evaluated in only a few studies. The YOD incidence rate in the present study was 0.9/1,000 person-years, and traditional cardiovascular risk factors such as smoking, hypertension, CKD, stroke, and IHD were associated more strongly with YOD than LOD in patients with diabetes. In addition, a strong association between YOD and vascular disease including stroke, transient ischemic attack, CKD, or hypertension was shown in previous studies [313233]. These results indicate that many cases of YOD in individuals with diabetes are preventable by adequate management of vascular causes.
- A history of depression or stroke had a stronger influence on the development of YOD than LOD in people with diabetes. The frequency of depression was also higher in subjects with YOD than with LOD in the Registry of Dementia of Girona [30]. In several longitudinal studies, depression was a major risk factor for incidence of dementia [34]. Depression was shown to injure neurons by several different mechanisms such as inflammation [35], elevated glucocorticoid production [36], amyloid deposition [37], or dysfunctional immune activity [38], which may lead to cognitive impairment. However, in a recent study, depression was a significant risk factor for YOD only if occuring within 10 years from YOD onset [32], indicating that depression might be a prodromal consequence of YOD rather than an etiological risk factor. Further research is needed to reach a definite conclusion whether the two conditions are linked as risk factors or are part of a continuum. The mechanism by which stroke confers an increased risk of YOD remains unclear. Stroke may trigger a neurodegenerative process by disrupting amyloid clearance [39] or by activating autoimmune responses [40] in the brain. Ongoing exposure to existing vascular risk factors, immune processes, and pathogenic mechanisms may contribute to risk of dementia after stroke in younger people.
- The present study had several limitations. First, since the Korean insurance claim data was used based on diagnosis codes, instances of misdiagnosis or misclassification of diabetes and dementia including its subtypes may have occurred. Second, except for the duration of diabetes and controversial glycemic control, modifiable factors specific to the patients with diabetes compared with known dementia risk factors in the general population were not found. Comparison with people without diabetes may clarify diabetes-specific risk factors for dementia. Nonetheless, to date, this is the largest study in which the incidence and risk factors for dementia and its subtypes were evaluated using a nationally representative cohort study of diabetes.
- In conclusion, the incidence and risk factors associated with dementia in Korean participants with diabetes were presented in this study. Because diabetes is closely associated with dementia and many vascular risk factors for dementia are modifiable, the results may aid in creating effective preventive strategies to decrease the rising dementia epidemic and its related health and socioeconomic burden.
DISCUSSION
-
Acknowledgements
- This research was supported by a National Research Foundation of Korea (NRF) grant funded by the Korean government (MSIP; No. 2015R1A2A2A01003167, 2015R1C1A2A01052010), and by a Korea University Grant (K1421551).
ACKNOWLEDGMENTS
-
CONFLICTS OF INTEREST: No potential conflict of interest relevant to this article was reported.
-
AUTHOR CONTRIBUTIONS:
NOTES
SUPPLEMENTARY MATERIALS
Supplementary Table 1
Supplementary Fig. 1
- 1. Prince M, Guerchet M, Prina M. Alzheimer's Disease International. Global Observatory for Ageing and Dementia Care. Policy brief for heads of government: the global impact of dementia 2013–2050. London: Alzheimer's Disease International; 2013.
- 2. Biessels GJ, Staekenborg S, Brunner E, Brayne C, Scheltens P. Risk of dementia in diabetes mellitus: a systematic review. Lancet Neurol 2006;5:64-74. ArticlePubMed
- 3. Launer LJ, Andersen K, Dewey ME, Letenneur L, Ott A, Amaducci LA, Brayne C, Copeland JR, Dartigues JF, Kragh-Sorensen P, Lobo A, Martinez-Lage JM, Stijnen T, Hofman A. Rates and risk factors for dementia and Alzheimer's disease: results from EURODEM pooled analyses EURODEM Incidence Research Group and Work Groups. European Studies of Dementia. Neurology 1999;52:78-84. ArticlePubMed
- 4. Ninomiya T. Diabetes mellitus and dementia. Curr Diab Rep 2014;14:487ArticlePubMedPDF
- 5. Bruce DG, Davis WA, Casey GP, Starkstein SE, Clarnette RM, Foster JK, Almeida OP, Davis TM. Predictors of cognitive impairment and dementia in older people with diabetes. Diabetologia 2008;51:241-248. ArticlePubMedPDF
- 6. Huang CC, Chung CM, Leu HB, Lin LY, Chiu CC, Hsu CY, Chiang CH, Huang PH, Chen TJ, Lin SJ, Chen JW, Chan WL. Diabetes mellitus and the risk of Alzheimer's disease: a nationwide population-based study. PLoS One 2014;9:e87095. ArticlePubMedPMC
- 7. Xu WL, von Strauss E, Qiu CX, Winblad B, Fratiglioni L. Uncontrolled diabetes increases the risk of Alzheimer's disease: a population-based cohort study. Diabetologia 2009;52:1031-1039. ArticlePubMedPDF
- 8. Haroon NN, Austin PC, Shah BR, Wu J, Gill SS, Booth GL. Risk of dementia in seniors with newly diagnosed diabetes: a population-based study. Diabetes Care 2015;38:1868-1875. ArticlePubMedPDF
- 9. Vanden Heuvel A, Hudson C, Cargill J. Australian Institute of Health and Welfare. Dementia in Australia. Canberra: Australian Institute of Health and Welfare; 2012.
- 10. Draper B, Withall A. Young onset dementia. Intern Med J 2016;46:779-786. ArticlePubMed
- 11. Vieira RT, Caixeta L, Machado S, Silva AC, Nardi AE, Arias-Carrion O, Carta MG. Epidemiology of early-onset dementia: a review of the literature. Clin Pract Epidemiol Ment Health 2013;9:88-95. ArticlePubMedPMC
- 12. Lee J, Lee JS, Park SH, Shin SA, Kim K. Cohort profile: the National Health Insurance Service-National Sample Cohort (NHIS-NSC), South Korea. Int J Epidemiol 2017;46:e15. ArticlePubMed
- 13. Yang HK, Han K, Kwon HS, Park YM, Cho JH, Yoon KH, Kang MI, Cha BY, Lee SH. Obesity, metabolic health, and mortality in adults: a nationwide population-based study in Korea. Sci Rep 2016;6:30329ArticlePubMedPMCPDF
- 14. Bassett J. International Diabetes Institute. World Health Organization Regional Office for the Western Pacific. International Association for the Study of Obesity. International Obesity Task Force. The Asia-Pacific perspective: redefining obesity and its treatment. Sydney: Health Communications Australia; 2000.
- 15. Agarwal DP. Cardioprotective effects of light-moderate consumption of alcohol: a review of putative mechanisms. Alcohol Alcohol 2002;37:409-415. ArticlePubMed
- 16. Lee YH, Han K, Ko SH, Ko KS, Lee KU. Taskforce Team of Diabetes Fact Sheet of the Korean Diabetes Association. Data analytic process of a nationwide population-based study using national health information database established by National Health Insurance Service. Diabetes Metab J 2016;40:79-82. ArticlePubMedPMCPDF
- 17. Levey AS, Coresh J, Balk E, Kausz AT, Levin A, Steffes MW, Hogg RJ, Perrone RD, Lau J, Eknoyan G. National Kidney Foundation. National Kidney Foundation practice guidelines for chronic kidney disease: evaluation, classification, and stratification. Ann Intern Med 2003;139:137-147. ArticlePubMed
- 18. Suh GH, Shah A. A review of the epidemiological transition in dementia: cross-national comparisons of the indices related to Alzheimer's disease and vascular dementia. Acta Psychiatr Scand 2001;104:4-11. ArticlePubMedPDF
- 19. Kim YJ, Han JW, So YS, Seo JY, Kim KY, Kim KW. Prevalence and trends of dementia in Korea: a systematic review and meta-analysis. J Korean Med Sci 2014;29:903-912. ArticlePubMedPMCPDF
- 20. Cheng G, Huang C, Deng H, Wang H. Diabetes as a risk factor for dementia and mild cognitive impairment: a meta-analysis of longitudinal studies. Intern Med J 2012;42:484-491. ArticlePubMed
- 21. Tuligenga RH, Dugravot A, Tabak AG, Elbaz A, Brunner EJ, Kivimaki M, Singh-Manoux A. Midlife type 2 diabetes and poor glycaemic control as risk factors for cognitive decline in early old age: a post-hoc analysis of the Whitehall II cohort study. Lancet Diabetes Endocrinol 2014;2:228-235. ArticlePubMedPMC
- 22. Crane PK, Walker R, Hubbard RA, Li G, Nathan DM, Zheng H, Haneuse S, Craft S, Montine TJ, Kahn SE, McCormick W, McCurry SM, Bowen JD, Larson EB. Glucose levels and risk of dementia. N Engl J Med 2013;369:540-548. ArticlePubMedPMC
- 23. Yaffe K, Falvey C, Hamilton N, Schwartz AV, Simonsick EM, Satterfield S, Cauley JA, Rosano C, Launer LJ, Strotmeyer ES, Harris TB. Diabetes, glucose control, and 9-year cognitive decline among older adults without dementia. Arch Neurol 2012;69:1170-1175. ArticlePubMedPMC
- 24. van den Berg E, de Craen AJ, Biessels GJ, Gussekloo J, Westendorp RG. The impact of diabetes mellitus on cognitive decline in the oldest of the old: a prospective population-based study. Diabetologia 2006;49:2015-2023. ArticlePubMedPDF
- 25. Kivimaki M, Luukkonen R, Batty GD, Ferrie JE, Pentti J, Nyberg ST, Shipley MJ, Alfredsson L, Fransson EI, Goldberg M, Knutsson A, Koskenvuo M, Kuosma E, Nordin M, Suominen SB, Theorell T, Vuoksimaa E, Westerholm P, Westerlund H, Zins M, Kivipelto M, Vahtera J, Kaprio J, Singh-Manoux A, Jokela M. Body mass index and risk of dementia: analysis of individual-level data from 1.3 million individuals. Alzheimers Dement 2018;14:601-609. ArticlePubMedPMCPDF
- 26. Singh-Manoux A, Dugravot A, Shipley M, Brunner EJ, Elbaz A, Sabia S, Kivimaki M. Obesity trajectories and risk of dementia: 28 years of follow-up in the Whitehall II Study. Alzheimers Dement 2018;14:178-186. ArticlePubMedPMCPDF
- 27. Schaap LA, Koster A, Visser M. Adiposity, muscle mass, and muscle strength in relation to functional decline in older persons. Epidemiol Rev 2013;35:51-65. ArticlePubMed
- 28. Mott JW, Wang J, Thornton JC, Allison DB, Heymsfield SB, Pierson RN Jr. Relation between body fat and age in 4 ethnic groups. Am J Clin Nutr 1999;69:1007-1013. ArticlePubMed
- 29. Harvey RJ, Skelton-Robinson M, Rossor MN. The prevalence and causes of dementia in people under the age of 65 years. J Neurol Neurosurg Psychiatry 2003;74:1206-1209. ArticlePubMedPMC
- 30. Garre-Olmo J, Genis Batlle D, del Mar Fernandez M, Marquez Daniel F, de Eugenio Huelamo R, Casadevall T, Turbau Recio J, Turon Estrada A, Lopez-Pousa S. Registry of Dementia of Girona Study Group (ReDeGi Study Group). Incidence and subtypes of early-onset dementia in a geographically defined general population. Neurology 2010;75:1249-1255. ArticlePubMed
- 31. Heath CA, Mercer SW, Guthrie B. Vascular comorbidities in younger people with dementia: a cross-sectional population-based study of 616 245 middle-aged people in Scotland. J Neurol Neurosurg Psychiatry 2015;86:959-964. ArticlePubMed
- 32. Cations M, Draper B, Low LF, Radford K, Trollor J, Brodaty H, Sachdev P, Gonski P, Broe GA, Withall A. Non-genetic risk factors for degenerative and vascular young onset dementia: results from the INSPIRED and KGOW studies. J Alzheimers Dis 2018;62:1747-1758. ArticlePubMed
- 33. Nordstrom P, Nordstrom A, Eriksson M, Wahlund LO, Gustafson Y. Risk factors in late adolescence for young-onset dementia in men: a nationwide cohort study. JAMA Intern Med 2013;173:1612-1618. ArticlePubMed
- 34. Byers AL, Yaffe K. Depression and risk of developing dementia. Nat Rev Neurol 2011;7:323-331. ArticlePubMedPMCPDF
- 35. Leonard BE. Inflammation, depression and dementia: are they connected? Neurochem Res 2007;32:1749-1756. ArticlePubMedPDF
- 36. Kohler S, Thomas AJ, Lloyd A, Barber R, Almeida OP, O'Brien JT. White matter hyperintensities, cortisol levels, brain atrophy and continuing cognitive deficits in late-life depression. Br J Psychiatry 2010;196:143-149. ArticlePubMed
- 37. Rapp MA, Schnaider-Beeri M, Grossman HT, Sano M, Perl DP, Purohit DP, Gorman JM, Haroutunian V. Increased hippocampal plaques and tangles in patients with Alzheimer disease with a lifetime history of major depression. Arch Gen Psychiatry 2006;63:161-167. ArticlePubMed
- 38. Herman FJ, Simkovic S, Pasinetti GM. Neuroimmune nexus of depression and dementia: shared mechanisms and therapeutic targets. Br J Pharmacol 2019;176:3558-3584. ArticlePubMedPMCPDF
- 39. Garcia-Alloza M, Gregory J, Kuchibhotla KV, Fine S, Wei Y, Ayata C, Frosch MP, Greenberg SM, Bacskai BJ. Cerebrovascular lesions induce transient β-amyloid deposition. Brain 2011;134(Pt 12):3697-3707. ArticlePubMed
- 40. Doyle KP, Buckwalter MS. Does B lymphocyte-mediated autoimmunity contribute to post-stroke dementia? Brain Behav Immun 2017;64:1-8. ArticlePubMed
REFERENCES
Incidence rates of (A) all-cause dementia, (B) Alzheimer's disease (AD), and (C) vascular dementia (VaD) based on age group.
Hazard ratios (HRs) for all-cause dementia, Alzheimer's disease (AD), and vascular dementia (VaD) based on (A) body mass index (BMI) or (B) waist circumference. Analyses were adjusted for age, sex, smoking, alcohol intake, exercise, income, plasma glucose concentration, duration of diabetes, dyslipidemia, hypertension, diabetic retinopathy, chronic kidney disease, stroke, ischemic heart disease, depression, number of oral hypoglycemic agents, and treatment with insulin.

Baseline characteristics of participants grouped based on the development of dementia
Multivariate Cox proportional analysis for development of any type of dementia, Alzheimer's disease, or vascular dementia
Values are presented as hazard ratio (95% confidence interval). Analyses adjusted for age, sex, smoking, alcohol intake, exercise, income, plasma glucose concentration, duration of diabetes, BMI, dyslipidemia, hypertension, diabetic retinopathy, CKD, stroke, IHD, depression, number of OHAs, and treatment with insulin.
AD, Alzheimer's disease; VaD, vascular dementia; ANY, all-cause dementia; FPG, fasting plasma glucose; DM, diabetes mellitus; BMI, body mass index; CKD, chronic kidney disease; IHD, ischemic heart disease; OHA, oral hypoglycemic agent.
Multivariate Cox proportional analysis for development of any type of dementia, Alzheimer's disease, or vascular dementia based on 60 years of age
Values are presented as hazard ratios (95% confidence interval). Analyses adjusted for age, sex, smoking, alcohol intake, exercise, income, plasma glucose concentration, duration of diabetes, BMI, dyslipidemia, hypertension, diabetic retinopathy, CKD, stroke, IHD, depression, number of OHAs, and treatment with insulin.
AD, Alzheimer's disease; VaD, vascular dementia; ANY, all-cause dementia; FPG, fasting plasma glucose; DM, diabetes mellitus; BMI, body mass index; CKD, chronic kidney disease; IHD, ischemic heart disease; OHA, oral hypoglycemic agent.
aIncome level was dichotomized at the lower 20%.
Figure & Data
References
Citations
- Unlocking the Protective Potential of Upper Respiratory Infection Treatment Histories against Alzheimer’s Disease: A Korean Adult Population Study
Ho Suk Kang, Ji Hee Kim, Joo-Hee Kim, Woo Jin Bang, Hyo Geun Choi, Nan Young Kim, Ha Young Park, Mi Jung Kwon
Journal of Clinical Medicine.2024; 13(1): 260. CrossRef - Hepatopancreatic metabolic disorders and their implications in the development of Alzheimer's disease and vascular dementia
Francisco I. Pinheiro, Irami Araújo-Filho, Amália C.M. do Rego, Eduardo P. de Azevedo, Ricardo N. Cobucci, Fausto P. Guzen
Ageing Research Reviews.2024; 96: 102250. CrossRef - Amygdala activity and amygdala-hippocampus connectivity: Metabolic diseases, dementia, and neuropsychiatric issues
Juhyun Song
Biomedicine & Pharmacotherapy.2023; 162: 114647. CrossRef - The effects of long-term cumulative HbA1c exposure on the development and onset time of dementia in the patients with type 2 diabetes mellitus: Hospital based retrospective study (2005–2021)
Sunyoung Cho, Choon Ok Kim, Bong-soo Cha, Eosu Kim, Chung Mo Nam, Min-Gul Kim, Min Soo Park
Diabetes Research and Clinical Practice.2023; 201: 110721. CrossRef - Association of triglyceride/high-density lipoprotein cholesterol ratio with severe complications of COVID-19
Yoonkyung Chang, Jimin Jeon, Tae-Jin Song, Jinkwon Kim
Heliyon.2023; 9(6): e17428. CrossRef - Akkermansia muciniphila in neuropsychiatric disorders: friend or foe?
Wenhui Lei, Yiwen Cheng, Jie Gao, Xia Liu, Li Shao, Qingming Kong, Nengneng Zheng, Zongxin Ling, Weiming Hu
Frontiers in Cellular and Infection Microbiology.2023;[Epub] CrossRef - The Association Between Eye Disease and Incidence of Dementia: Systematic Review and Meta-Analysis
Jiayi Feng, Cuihong Huang, Lei Liang, Chuang Li, Xiaojie Wang, Jianping Ma, Xinhui Guan, Bin Jiang, Shaofen Huang, Pei Qin
Journal of the American Medical Directors Association.2023; 24(9): 1363. CrossRef - Risk of Neurodegenerative Diseases in Elderly Koreans with an Initial Diagnosis of Type 2 Diabetes: A Nationwide Retrospective Cohort Study
Hee-Cheol Kim, Ho-Jun Lee, Yang-Tae Kim, Byeong-Churl Jang, Asirvatham Alwin Robert
Journal of Diabetes Research.2023; 2023: 1. CrossRef - Type-2 Diabetes Alters Hippocampal Neural Oscillations and Disrupts Synchrony between the Hippocampus and Cortex
Gratianne Rabiller, Zachary Ip, Shahram Zarrabian, Hongxia Zhang, Yoshimichi Sato, Azadeh Yazdan-Shahmorad, Jialing Liu
Aging and disease.2023;[Epub] CrossRef - Sarcopenia and diabetes-induced dementia risk
Mingyang Sun, Zhongyuan Lu, Wan-Ming Chen, Szu-Yuan Wu, Jiaqiang Zhang
Brain Communications.2023;[Epub] CrossRef - Association of periodontitis with microvascular complications of diabetes mellitus: A nationwide cohort study
Moo-Seok Park, Jimin Jeon, Tae-Jin Song, Jinkwon Kim
Journal of Diabetes and its Complications.2022; 36(2): 108107. CrossRef - Association between oral health and cardiovascular outcomes in patients with hypertension: a nationwide cohort study
Jinkwon Kim, Hyung Jun Kim, Jimin Jeon, Tae-Jin Song
Journal of Hypertension.2022; 40(2): 374. CrossRef - Diabetic retinopathy and cognitive dysfunction: a systematic review and meta-analysis
Mei Wu, Fan Mei, Kaiyan Hu, Liyuan Feng, Zhe Wang, Qianqian Gao, Fei Chen, Li Zhao, Xiaohui Li, Bin Ma
Acta Diabetologica.2022; 59(4): 443. CrossRef - Associations between depression and cognition, mild cognitive impairment and dementia in persons with diabetes mellitus: A systematic review and meta-analysis
Yeng Yan Chow, Milou Verdonschot, Claire T. McEvoy, Geeske Peeters
Diabetes Research and Clinical Practice.2022; 185: 109227. CrossRef - Diabetes Mellitus: A Path to Amnesia, Personality, and Behavior Change
Rahnuma Ahmad, Kona Chowdhury, Santosh Kumar, Mohammed Irfan, Govindool Reddy, Farhana Akter, Dilshad Jahan, Mainul Haque
Biology.2022; 11(3): 382. CrossRef - Hypothyroidism and Diabetes-Related Dementia: Focused on Neuronal Dysfunction, Insulin Resistance, and Dyslipidemia
Hee Kyung Kim, Juhyun Song
International Journal of Molecular Sciences.2022; 23(6): 2982. CrossRef - Type 2 Diabetes Mellitus as a Risk Factor for Alzheimer’s Disease: Review and Meta-Analysis
Athanasia Athanasaki, Konstantinos Melanis, Ioanna Tsantzali, Maria Ioanna Stefanou, Sofia Ntymenou, Sotirios G. Paraskevas, Theodosis Kalamatianos, Eleni Boutati, Vaia Lambadiari, Konstantinos I. Voumvourakis, George Stranjalis, Sotirios Giannopoulos, Ge
Biomedicines.2022; 10(4): 778. CrossRef - Cardiometabolic measures and cognition in early menopause - Analysis of baseline data from a randomized controlled trial
Lubna Pal, Kelly Morgan, Nanette F. Santoro, JoAnn E. Manson, Hugh S. Taylor, Virginia M. Miller, Eliot A. Brinton, Rogerio Lobo, Genevieve Neal-Perry, Marcelle I. Cedars, S. Mitchell Harman, Taryn T. James, Carey E. Gleason
Maturitas.2022; 162: 58. CrossRef - Dysfunctional Glucose Metabolism in Alzheimer’s Disease Onset and Potential Pharmacological Interventions
Vijay Kumar, So-Hyeon Kim, Kausik Bishayee
International Journal of Molecular Sciences.2022; 23(17): 9540. CrossRef - Metabolically healthy obesity: it is time to consider its dynamic changes
Yun Kyung Cho, Chang Hee Jung
Cardiovascular Prevention and Pharmacotherapy.2022; 4(4): 123. CrossRef - Association between cholesterol levels and dementia risk according to the presence of diabetes and statin use: a nationwide cohort study
You-Bin Lee, Min Young Kim, Kyungdo Han, Bongsung Kim, Jiyun Park, Gyuri Kim, Kyu Yeon Hur, Jae Hyeon Kim, Sang-Man Jin
Scientific Reports.2022;[Epub] CrossRef - The insulin resistance by triglyceride glucose index and risk for dementia: population-based study
Sangmo Hong, Kyungdo Han, Cheol-Young Park
Alzheimer's Research & Therapy.2021;[Epub] CrossRef - The identification of established modifiable mid-life risk factors for cardiovascular disease which contribute to cognitive decline: Korean Longitudinal Study of Aging (KLoSA)
Yebeen Ysabelle Boo, Otto-Emil Jutila, Meghan A. Cupp, Logan Manikam, Sung-Il Cho
Aging Clinical and Experimental Research.2021; 33(9): 2573. CrossRef - Examining the effects of multiple chronic conditions on cognitive decline and potential moderators among older Koreans: Findings from the Korean Longitudinal Study of Ageing 2006–2016
Yura Lee, Chi C. Cho
Archives of Gerontology and Geriatrics.2021; 95: 104424. CrossRef - Cumulative Exposure to Metabolic Syndrome Components and the Risk of Dementia: A Nationwide Population-Based Study
Yunjung Cho, Kyungdo Han, Da Hye Kim, Yong-Moon Park, Kun-Ho Yoon, Mee Kyoung Kim, Seung-Hwan Lee
Endocrinology and Metabolism.2021; 36(2): 424. CrossRef - Cardiovascular risks of periodontitis and oral hygiene indicators in patients with diabetes mellitus
Tae-Jin Song, Jimin Jeon, Jinkwon Kim
Diabetes & Metabolism.2021; 47(6): 101252. CrossRef - Association Between Diabetic Retinopathy and Cognitive Impairment: A Systematic Review and Meta-Analysis
Dihe Cheng, Xue Zhao, Shuo Yang, Guixia Wang, Guang Ning
Frontiers in Aging Neuroscience.2021;[Epub] CrossRef - Improving Cognition with Nutraceuticals Targeting TGF-β1 Signaling
Margherita Grasso, Giuseppe Caruso, Justyna Godos, Angela Bonaccorso, Claudia Carbone, Sabrina Castellano, Walter Currenti, Giuseppe Grosso, Teresa Musumeci, Filippo Caraci
Antioxidants.2021; 10(7): 1075. CrossRef - The risk of Alzheimer’s disease according to dynamic changes in metabolic health and obesity: a nationwide population-based cohort study
Yun Kyung Cho, Jiwoo Lee, Hwi Seung Kim, Joong-Yeol Park, Woo Je Lee, Ye-Jee Kim, Chang Hee Jung
Aging.2021; 13(13): 16974. CrossRef - Letter: Hypoglycemia and Dementia Risk in Older Patients with Type 2 Diabetes Mellitus: A Propensity-Score Matched Analysis of a Population-Based Cohort Study (Diabetes Metab J 2020;44:125–33)
Jin Hwa Kim
Diabetes & Metabolism Journal.2020; 44(2): 356. CrossRef - The Interplay between Diabetes and Alzheimer’s Disease—In the Hunt for Biomarkers
Adriana Kubis-Kubiak, Aleksandra Dyba, Agnieszka Piwowar
International Journal of Molecular Sciences.2020; 21(8): 2744. CrossRef - Association between cytomegalovirus end-organ diseases and moderate-to-severe dementia: a population-based cohort study
Kyoung Hwa Lee, Da Eun Kwon, Kyung Do Han, Yeonju La, Sang Hoon Han
BMC Neurology.2020;[Epub] CrossRef
 PubReader
 Cite
Cite- Figure
-

- Related articles
-
- Risk of Depression according to Cumulative Exposure to a Low-Household Income Status in Individuals with Type 2 Diabetes Mellitus: A Nationwide Population- Based Study
- The Risk of Shoulder Adhesive Capsulitis in Individuals with Prediabetes and Type 2 Diabetes Mellitus: A Longitudinal Nationwide Population-Based Study
- Clinical Effects of a Home Care Pilot Program for Patients with Type 1 Diabetes Mellitus: A Retrospective Cohort Study
- Low Household Income Status and Death from Pneumonia in People with Type 2 Diabetes Mellitus: A Nationwide Study
- Change Profiles and Functional Targets of MicroRNAs in Type 2 Diabetes Mellitus Patients with Obesity


