- Current
- Browse
- Collections
-
For contributors
- For Authors
- Instructions to authors
- Article processing charge
- e-submission
- For Reviewers
- Instructions for reviewers
- How to become a reviewer
- Best reviewers
- For Readers
- Readership
- Subscription
- Permission guidelines
- About
- Editorial policy
Articles
- Page Path
- HOME > Diabetes Metab J > Volume 43(5); 2019 > Article
-
Original ArticleEpidemiology Association between Change in Alcohol Consumption and Metabolic Syndrome: Analysis from the Health Examinees Study
-
Seulggie Choi1
 , Kyuwoong Kim1, Jong-Koo Lee2,3, Ji-Yeob Choi4, Aesun Shin4, Sue Kyung Park1,4, Daehee Kang1,4,5, Sang Min Park1,2
 -
Diabetes & Metabolism Journal 2019;43(5):615-626.
DOI: https://doi.org/10.4093/dmj.2018.0128
Published online: April 23, 2019
1Department of Biomedical Sciences, Seoul National University Graduate School, Seoul, Korea.
2Department of Family Medicine, Seoul National University Hospital, Seoul National University College of Medicine, Seoul, Korea.
3JW Lee Center for Global Medicine, Seoul, Korea.
4Department of Preventive Medicine, Seoul National University College of Medicine, Seoul, Korea.
5Department of Environmental Medicine, Seoul National University Medical Research Center, Seoul, Korea.
- Corresponding author: Sang Min Park. Department of Biomedical Sciences and Family Medicine, Seoul National University College of Medicine, 101 Daehak-ro, Jongno-gu, Seoul 03080, Korea. fmpark1@snu.ac.kr
Copyright © 2019 Korean Diabetes Association
This is an Open Access article distributed under the terms of the Creative Commons Attribution Non-Commercial License (http://creativecommons.org/licenses/by-nc/4.0/) which permits unrestricted non-commercial use, distribution, and reproduction in any medium, provided the original work is properly cited.
ABSTRACT
-
Background
- The association between change in alcohol intake and metabolic syndrome is unclear.
-
Methods
- This retrospective cohort consisted of 41,368 males and females from the Health Examinees-GEM study. Participants were divided into non-drinkers (0.0 g/day), light drinkers (male: 0.1 to 19.9 g/day; female: 0.1 to 9.9 g/day), moderate drinkers (male: 20.0 to 39.9 g/day; female: 10.0 to 19.9 g/day), and heavy drinkers (male: ≥40.0 g/day; female: ≥20.0 g/day) for each of the initial and follow-up health examinations. Logistic regression analysis was used to determine the adjusted odds ratios (aORs) and 95% confidence intervals (CIs) for developing metabolic syndrome according to the change in alcohol consumption between the initial and follow-up health examinations. Adjusted mean values for the change in waist circumference, fasting serum glucose (FSG), blood pressure, triglycerides, and high density lipoprotein cholesterol (HDL-C) levels were determined according to the change in alcohol consumption by linear regression analysis.
-
Results
- Compared to persistent light drinkers, those who increased alcohol intake to heavy levels had elevated risk of metabolic syndrome (aOR, 1.45; 95% CI, 1.09 to 1.92). In contrast, heavy drinkers who became light drinkers had reduced risk of metabolic syndrome (aOR, 0.61; 95% CI, 0.44 to 0.84) compared to persistent heavy drinkers. Increased alcohol consumption was associated with elevated adjusted mean values for waist circumference, FSG, blood pressure, triglycerides, and HDL-C levels (all P<0.05). Reduction in alcohol intake was associated with decreased waist circumference, FSG, blood pressure, triglycerides, and HDL-C levels among initial heavy drinkers (all P<0.05).
-
Conclusion
- Heavy drinkers who reduce alcohol consumption could benefit from reduced risk of metabolic syndrome.
- Metabolic syndrome is a constellation of clinical features linked with metabolic abnormalities, which consist of abdominal obesity, impaired fasting glucose, hypertension, and dyslipidemia. Metabolic syndrome has become a major problem in public health, with a prevalence rate of 20% to 25% among adults worldwide [1]. As metabolic syndrome is associated with elevated risk of developing type 2 diabetes mellitus, cardiovascular disease, and all-cause mortality, modifiable risk factors for metabolic syndrome must be determined and managed [2]. Particularly, as lifestyle modification is the primary method of management for metabolic syndrome [3], identifying health behaviors that may influence the risk of metabolic syndrome is imperative.
- Alcohol consumption, one of the most common health-related behaviors, has previously been shown to be associated with metabolic syndrome. While some studies have shown that alcohol consumption is associated with reduced risk of metabolic syndrome [45], a recent meta-analysis consisting of six prospective studies has shown that moderate to heavy levels of alcohol intake is associated with elevated risk of metabolic syndrome [6]. Previous studies, however, measured alcohol intake only once and assumed that alcohol consumption did not change over time. Therefore, it is yet unclear whether lowering alcohol intake leads to reduced risk of metabolic syndrome, or that increases in alcohol consumption is associated with elevated metabolic syndrome risk.
- In this study, we investigated the association between change in alcohol consumption and metabolic syndrome among a large population using the Health Examinees-GEM (HEXA-G) study. Furthermore, the impact of change in alcohol intake on individual components of metabolic syndrome were determined.
INTRODUCTION
- Participants
- The study population is derived from the HEXA-G study conducted in Korea. The HEXA-G database is a community-based multicenter study consisting of males and females aged 40 to 69 years who underwent health examinations between 2004 and 2013. Multiple epidemiological studies have used HEXA-G previously [78910] and its validity has been demonstrated in detail elsewhere [1011]. Among 65,642 participants who underwent health examinations twice, 319, 14, 5, 99, and 1,680 participants without information on waist circumference, triglyceride, high density lipoprotein cholesterol (HDL-C), blood pressure, and fasting serum glucose (FSG) were excluded, respectively. An additional 1,274 participants who did not respond to questions on alcohol consumption were further excluded. Finally, 14,813 and 6,070 participants who were diagnosed with metabolic syndrome during the first health examination and with missing values on covariates were excluded, respectively. The final study population consisted of 41,368 participants. This study is not a clinical trial and does not need to be registered.
- Ethics
- This study was approved by the Institutional Review Board of Seoul National University Hospital (IRB number: 1503-103-657). During recruitment, all participants signed a voluntary consent form before study entry. The HEXA-G study complies with the principles of the Declaration of Helsinki.
- Key variables
- Alcohol consumption was determined based on a self-reported questionnaire the participants answered during each health examination. The participants responded to questions on the frequency (sittings per week) and amount (drinks per sitting) of alcohol consumed for soju (a popular Korean alcoholic beverage), beer, rice wine, wine, fruit wine, and hard liquor. The amount of alcohol consumed in grams per day for each alcoholic beverage type were calculated, after which the total amount of alcohol consumed was determined for each participant [12]. From this, the participants were divided into non-drinkers (0.0 g/day), light drinkers (0.1 to 19.9 g/day for males, 0.1 to 9.9 g/day for females), moderate drinkers (20.0 to 39.9 g/day for males, 10 to 19.9 g/day for females), and heavy drinkers (≥40.0 g/day for males, ≥20.0 g/day for females) for each of the initial and follow-up health examinations (Supplementary Fig. 1) [13].
- The primary endpoint was metabolic syndrome, which did not change during the course of the research. Metabolic syndrome was determined based on the National Cholesterol Education Program Adult Treatment Panel III (NCEP-ATP III) criteria modified for Asian populations [14]. Participants were diagnosed with metabolic syndrome if they met three of the following five conditions: waist circumference of ≥90 cm for males and ≥80 cm for females, triglyceride levels of ≥150 mg/dL or taking lipid-lowering drugs, HDL-C levels of <40 mg/dL for males and <50 mg/dL for females, blood pressure of ≥130/85 mm Hg or taking anti-hypertensive drugs, and FSG levels of ≥100 mg/dL or taking anti-diabetic drugs. The presence of metabolic syndrome was determined for each participant during the initial and follow-up health examinations.
- Statistical analysis
- Chi-square test for categorical variables and analysis of variance for continuous variables were used to determine the difference in descriptive characteristics according to secondary alcohol consumption. We conducted logistic regression analysis to determine the adjusted odds ratios (aORs) and 95% confidence intervals (CIs) of developing metabolic syndrome during the follow-up examination according to the change in alcohol consumption between the initial and follow-up health examinations. Furthermore, we also determined adjusted mean values of the change in waist circumference, FSG, blood pressure, triglycerides, and HDL-C levels according to the change in alcohol consumption by linear regression analysis.
- The differences in the descriptive characteristics according to initial alcohol consumption were determined by the chi-square test for categorical variables and analysis of variance for continuous variables. For all analyses, participants without changes in alcohol consumption (e.g., initial non-drinkers to follow-up non-drinkers) were the reference group. For both logistic and linear regression analyses, the aORs and adjusted mean values were determined after adjustments for covariates. The covariates considered were age (continuous, years), sex (categorical, male and female), household income (categorical, first, second, third, and fourth quartiles), education (categorical, elementary school or below, middle school, high school, and college or higher), physical activity (categorical, yes and no), smoking (categorical, never smoker, quitter, and continual smoker), total energy intake (continuous, kcal per day), body mass index (continuous, kg/m2), past history of cardiovascular disease (categorical, no and yes), family history of hypertension, diabetes, and dyslipidemia (categorical, no and yes), follow-up duration (continuous, years), and baseline metabolism risk score (categorical, 0, 1, and 2). Body mass index was calculated by dividing the weight in kilograms by the height in meters squared and was not adjusted for when determining the association of change in waist circumference according to alcohol consumption change.
- Statistical significance was defined as a P<0.05 in a two-sided manner. All data collection and analysis were conducted using SAS version 9.4 (SAS Institute Inc., Cary, NC, USA) and STATA version 13.0 (StataCorp LP, College Station, TX, USA).
METHODS
- Table 1 depicts the descriptive characteristics of the study population during the initial health examination. The number of initial non-drinkers, light drinkers, moderate drinkers, and heavy drinkers are 22,906, 14,495, 2,413, and 1,554, respectively. The mean±standard deviation values of age for non-drinkers, light drinkers, moderate drinkers, and heavy drinkers are 53.5±7.8, 52.0±8.1, 51.9±8.1, and 52.1±7.9 years, respectively. Compared to initial non-drinkers, heavy drinkers tended to have a higher proportion of males, be heavy drinkers during the follow-up examination, have higher levels of education, be continual smokers, have higher total energy intake, have greater body mass index, and not have a past history of cardiovascular disease or a family history of hypertension (all P<0.001).
- The association between change in alcohol consumption and metabolic syndrome according to baseline alcohol consumption is shown in Table 2. Light drinkers who increased alcohol consumption to moderate and heavy levels had elevated risk of metabolic syndrome ([aOR, 1.28; 95% CI, 1.06 to 1.53] and [aOR, 1.45; 95% CI, 1.09 to 1.92], respectively) compared to persistent light drinkers. Among initial light drinkers, increases in alcohol consumption were associated with elevated risk for metabolic syndrome (P for trend 0.042). Compared to persistent heavy drinkers, those who reduced the amount of alcohol to light levels had decreased risk of metabolic syndrome (aOR, 0.61; 95% CI, 0.44 to 0.84). Among initial heavy drinkers, alcohol intake reduction was associated with decreased risk for metabolic syndrome (P for trend 0.011).
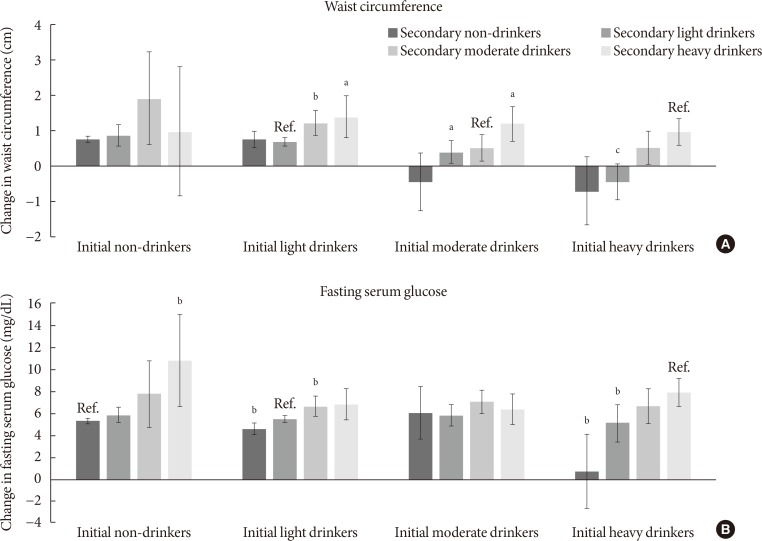
- Fig. 1 shows the association between change in alcohol consumption and change in waist circumference or FSG. Compared to persistent light drinkers, those who increased alcohol consumption to moderate and heavy levels had elevated waist circumference (P=0.003 and P=0.017, respectively). Moderate drinkers who became non-drinkers had reduced waist circumference (P=0.032), while those who became heavy drinkers had elevated waist circumference (P=0.023). Compared to persistent heavy drinkers, those who reduced the amount of alcohol consumption to light levels had reduced waist circumference (P<0.001). Similarly, heavy drinkers who became non-drinkers had reduced waist circumference compared to persistent heavy drinkers (P=0.001). Non-drinkers who became heavy drinkers had elevated FSG levels (P=0.009) compared to persistent non-drinkers. Light drinkers who became non-drinkers had reduced FSG levels (P=0.003) while those who became moderate drinkers had elevated FSG levels (P=0.007). Finally, compared to persistent heavy drinkers, those who became light and non-drinkers had decreased FSG levels (P=0.009 and P<0.001, respectively).
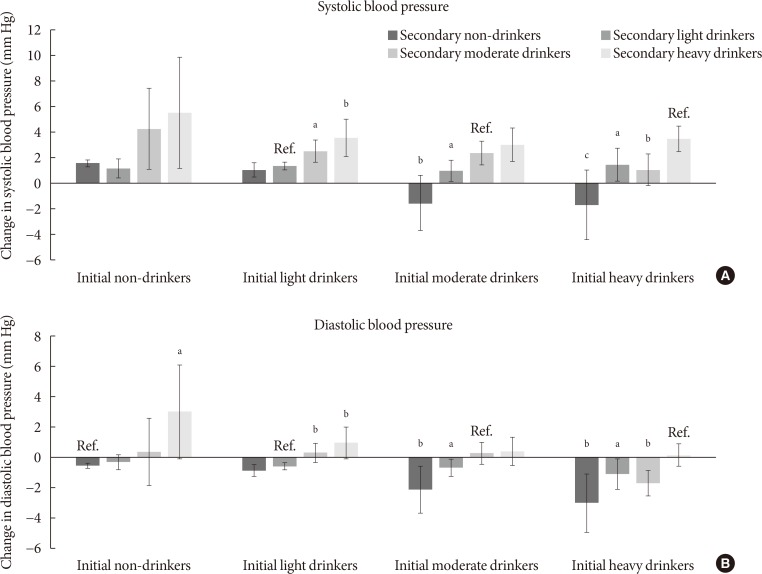
- The associations between change in alcohol consumption and change in systolic or diastolic blood pressure are shown in Fig. 2. Light drinkers who increased alcohol consumption to moderate and heavy amounts had elevated systolic blood pressure (P=0.010 and P=0.003, respectively) compared to persistent light drinkers. Compared to persistent moderate drinkers, those who became light and non-drinkers had reduced systolic blood pressure (P=0.035 and P=0.001, respectively). Heavy drinkers who became moderate, light and non-drinkers had reduced systolic blood pressure (P=0.002, P=0.015, and P<0.001, respectively). Non-drinkers who elevated the amount of alcohol to heavy levels had increased diastolic blood pressure (P=0.023). Similarly, light drinkers who increased alcohol consumption to moderate and heavy amounts had elevated diastolic blood pressure (P=0.005 and P=0.003, respectively). Compared to persistent moderate drinkers, those who became light and non-drinkers had reduced diastolic blood pressure (P=0.045 and P=0.006, respectively). Finally, heavy drinkers who became moderate, light, and non-drinkers had decreased diastolic blood pressure (P=0.020, P=0.049, and P=0.003, respectively).
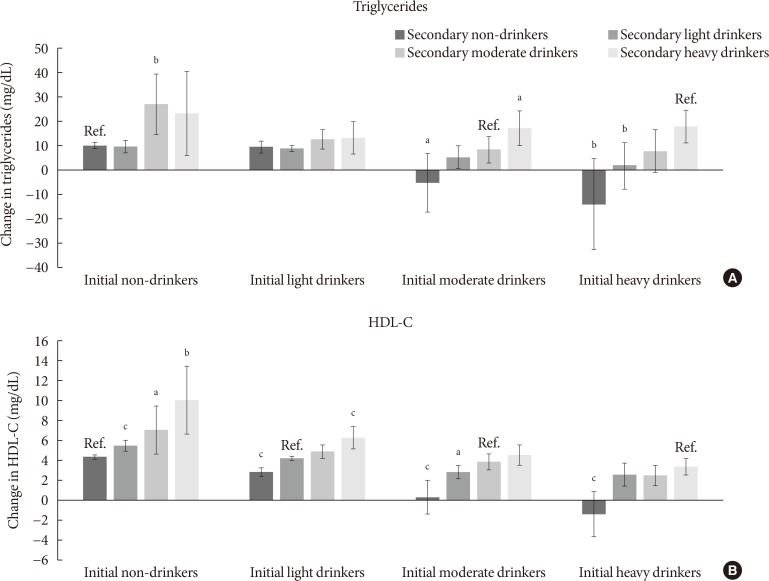
- Fig. 3 shows the associations between change in alcohol consumption and change in triglyceride or HDL-C levels. Non-drinkers who increased alcohol consumption to moderate levels had elevated triglyceride levels (P=0.007). On the other hand, compared to persistent moderate drinkers, those who became non-drinkers had reduced triglyceride levels (P=0.041), while those who increased the amount of alcohol consumed to heavy levels had higher triglyceride levels (P=0.041). Non-drinkers who became light, moderate, and heavy drinkers had elevated HDL-C levels (P<0.001, P=0.033, and P=0.001, respectively) compared to persistent non-drinkers. Finally, compared to persistent heavy drinkers, heavy drinkers who became non-drinkers had reduced HDL-C levels (P<0.001).
RESULTS
- In this large-scale longitudinal study, we have shown that increased alcohol consumption was associated with elevated risk of metabolic syndrome, while alcohol intake reduction was associated with decreased risk of metabolic syndrome. Furthermore, increased alcohol consumption was associated with elevated waist circumference, FSG, blood pressure, triglyceride, and HDL-C levels while reduced consumption of alcohol was associated with decreased levels of each component of metabolic syndrome. Past studies were limited to measuring alcohol consumption at one point in time, while our study extended from previous investigations by determining the risk of metabolic syndrome according to the changes in alcohol consumption.
- Previous studies investigating the association between alcohol consumption at one point in time and metabolic syndrome or its individual components support the findings of this study. In a recent meta-analysis consisting six prospective studies with 28,862 participants, Sun and colleagues showed that heavy levels (>35 g/day) of alcohol consumption was associated with elevated risk of metabolic syndrome (relative risk, 1.84; 95% CI, 1.34 to 2.52) compared to non-drinkers [6]. In another cohort study, Kim and colleagues showed that increased alcohol consumption was associated with not only elevated risk of metabolic syndrome, but also abdominal obesity, impaired fasting glucose, and hypertriglyceridemia [15]. Similarly, another prospective study demonstrated that heavy levels of alcohol consumption is associated with elevated risk of metabolic syndrome, abdominal obesity, impaired FSG, hypertension, and hypertriglyceridemia [16].
- Alcohol consumption may lead to elevated risk of metabolic syndrome by increasing waist circumference, FSG, blood pressure, and triglyceride levels. It has been suggested that alcohol may inhibit fat oxidation, which would lead to fat sparing upon heavy alcohol consumption, resulting in increased adiposity [17]. Furthermore, alcohol has been previously associated with β-cell dysfunction and alcoholic steatohepatitis, which could lead to deteriorating glycemic control and elevated FSG levels [18]. In terms of hypertension, alcohol has been shown to be associated with increased corticotropin-releasing hormone [19] and cortisol [20], elevated sympathetic nervous system activity [21], and vasoconstriction due to elevated intracellular calcium [2223], all precursors of elevated blood pressure. Finally, alcohol has been shown to stimulate hepatic secretion of very low density lipoproteins [24] and lipolysis by lipoprotein lipase [25], which could then lead to hypertriglyceridemia [26].
- In contrast to other components of metabolic syndrome, the risk of low HDL-C decreased upon increased alcohol intake. Furthermore, heavy drinkers who reduced alcohol consumption had increased risk of low HDL-C. This finding is supported in multiple previous studies investigating the effect of alcohol intake on HDL-C levels, which reveal that greater alcohol intake was associated with higher HDL-C levels [2728293031]. One possible mechanism for the apparent benefit of alcohol on HDL-C is the increased transport rate of apolipoproteins A-I and A-II, major apolipoproteins of HDL, upon alcohol consumption [32]. This benefit of elevated HDL-C levels upon increasing alcohol consumption may have contributed to the lack of increased risk of metabolic syndrome upon elevating alcohol intake to light levels among non-drinkers, as well as the lack of benefit when light drinkers became non-drinkers.
- Interestingly, two longitudinal studies have shown that moderate to heavy levels of alcohol intake is associated with reduced risk of metabolic syndrome [45]. However, both studies were conducted among Western populations. Therefore, the discrepancy in the relationship between alcohol consumption and metabolic syndrome compared to our results may be due to the ethnic differences in alcohol metabolism or drinking patterns [33]. Indeed, two previous studies investigating the association between alcohol consumption and metabolic syndrome among Korean populations have shown that greater alcohol intake is associated with increased risk of metabolic syndrome [1516]. Nonetheless, the exact reasons for the differences in the association between alcohol consumption and metabolic syndrome among Western and Asian populations are unclear and merit further investigation.
- Previously, there have been limited studies that investigated the association between change in alcohol intake and metabolic syndrome. Furthermore, the relatively large study population and extensive adjustment of covariates enhance the reliability of our findings. We also attempted to take into account a potentially important confounder, sex. Although the significance was decreased likely due to the reduction in statistical power, our results suggest that the risk-elevating effect upon increased alcohol intake tended to be preserved among both males and females.
- Nonetheless, several limitations must be considered upon interpreting the results from our study. First, as alcohol intake was determined using a self-reported questionnaire, the reported amount of alcohol intake may differ from the actual amount of alcohol consumption. However, previous studies have shown that alcohol consumption reported by a questionnaire correlates well with the actual amount of alcohol intake [3435]. Second, as the participants in HEXA-G underwent only two health examinations, we could not determine whether changes in alcohol intake occurred after the second period. Future studies with multiple repeated measurements of alcohol intake are needed to validate our findings. Third, although we were able to show that each of the five components of metabolic syndrome were affected by alcohol intake change, we could not demonstrate which of the five components was most influenced by alcohol consumption. Therefore, future studies investigating which of the five components of metabolic syndrome are most influenced by alcohol consumption change are needed. Fourth, as metabolic syndrome and secondary alcohol consumption were both determined during the follow-up health examination, the sequence of causality cannot be established with certainty. However, previous studies showing differing susceptibilities to elevated HDL-C [36] and increased risk of type 2 diabetes mellitus [37] according to the variation in the alcohol dehydrogenase genotype suggest that alcohol and its metabolites appear to alter the risk of developing metabolic syndrome. Fifth, the fact that the study population consisted of Korean participants who underwent health examinations, who may have certain sociodemographic tendencies, may limit the generalizability of our results. This may be particularly true in terms of alcohol consumption category, which was based on a similar previous study with an Asian population [13]. Since the alcohol consumption category may differ for Western populations, future studies conducted among study participants of other ethnicities are needed to validate our findings.
- In conclusion, increases in alcohol consumption may lead to elevated risk of developing metabolic syndrome, while reducing alcohol consumption may lead to decreased risk of metabolic syndrome. Heavy drinkers who reduce alcohol intake may benefit from reduced risk of metabolic syndrome. Since metabolic syndrome is associated with higher risk of cardiovascular disease and all-cause mortality, the fact that increases in alcohol intake is associated with higher metabolic syndrome risk of both public health and clinical importance. However, as metabolic syndrome is a constellation of five features related to metabolic abnormalities, metabolic syndrome does not necessarily translate directly into a particular disease. Therefore, future studies that directly investigate the association of alcohol intake change with other health outcomes such as cardiovascular disease are needed.
DISCUSSION
-
Acknowledgements
- This study was supported by the Research Program funded by the Korea Centers for Disease Control and Prevention (2004-E71004-00, 2005-E71011-00, 2005-E71009-00, 2006-E71001-00, 2006-E71004-00, 2006-E71010-00, 2006-E71003-00, 2007-E71004-00, 2007-E71006-00, 2008-E71006-00, 2008-E71008-00, 2009-E71009-00, 2010-E71006-00, 2011-E71006-00, 2012-E71001-00, and 2013-E71009-00).
ACKNOWLEDGMENTS
-
CONFLICTS OF INTEREST: No potential conflict of interest relevant to this article was reported.
-
AUTHOR CONTRIBUTIONS:
Conceived of the study: J.K.L., D.K., S.M.P.
Acquisition, analysis, or interpretation of data: S.C., K.K., J.K.L., J.Y.C., A.S., S.K.P., D.K., S.M.P.
Drafting the work or revising: S.C., K.K., J.K.L., J.Y.C., A.S., S.K.P., D.K., S.M.P
Final approval of the manuscript: S.C., K.K., J.K.L., J.Y.C., A.S., S.K.P., D.K., S.M.P.
NOTES
SUPPLEMENTARY MATERIALS
- 1. Eckel RH, Alberti KG, Grundy SM, Zimmet PZ. The metabolic syndrome. Lancet 2010;375:181-183. ArticlePubMed
- 2. Gami AS, Witt BJ, Howard DE, Erwin PJ, Gami LA, Somers VK, Montori VM. Metabolic syndrome and risk of incident cardiovascular events and death: a systematic review and meta-analysis of longitudinal studies. J Am Coll Cardiol 2007;49:403-414. PubMed
- 3. Cornier MA, Dabelea D, Hernandez TL, Lindstrom RC, Steig AJ, Stob NR, Van Pelt RE, Wang H, Eckel RH. The metabolic syndrome. Endocr Rev 2008;29:777-822. ArticlePubMedPMC
- 4. Stoutenberg M, Lee DC, Sui X, Hooker S, Horigian V, Perrino T, Blair S. Prospective study of alcohol consumption and the incidence of the metabolic syndrome in US men. Br J Nutr 2013;110:901-910. ArticlePubMed
- 5. Gigleux I, Gagnon J, St-Pierre A, Cantin B, Dagenais GR, Meyer F, Despres JP, Lamarche B. Moderate alcohol consumption is more cardioprotective in men with the metabolic syndrome. J Nutr 2006;136:3027-3032. ArticlePubMed
- 6. Sun K, Ren M, Liu D, Wang C, Yang C, Yan L. Alcohol consumption and risk of metabolic syndrome: a meta-analysis of prospective studies. Clin Nutr 2014;33:596-602. ArticlePubMed
- 7. Shin S, Lee HW, Kim CE, Lim J, Lee JK, Lee SA, Kang D. Egg consumption and risk of metabolic syndrome in Korean adults: results from the health examinees study. Nutrients 2017;9:E687. Article
- 8. Ahn Y, Kwon E, Shim JE, Park MK, Joo Y, Kimm K, Park C, Kim DH. Validation and reproducibility of food frequency questionnaire for Korean genome epidemiologic study. Eur J Clin Nutr 2007;61:1435-1441. ArticlePubMedPDF
- 9. Yang JJ, Song M, Yoon HS, Lee HW, Lee Y, Lee SA, Choi JY, Lee JK, Kang D. What are the major determinants in the success of smoking cessation: results from the health examinees study. PLoS One 2015;10:e0143303. ArticlePubMedPMC
- 10. Jung SJ, Park SK, Shin A, Lee SA, Choi JY, Hong YC, Yoo KY, Lee JK, Kang D. Body mass index at age 18-20 and later risk of spontaneous abortion in the Health Examinees Study (HEXA). BMC Pregnancy Childbirth 2015;15:228ArticlePubMedPMCPDF
- 11. Health Examinees Study Group. The Health Examinees (HEXA) study: rationale, study design and baseline characteristics. Asian Pac J Cancer Prev 2015;16:1591-1597. ArticlePubMed
- 12. Choi J, Choi JY, Shin A, Lee SA, Lee KM, Oh J, Park JY, Lee JK, Kang D. Trends and correlates of high-risk alcohol consumption and types of alcoholic beverages in middle-aged Korean adults: results from the HEXA-G study. J Epidemiol 2019;29:125-132. ArticlePubMedPMC
- 13. Cho Y, Choi S, Kim K, Lee G, Park SM. Association between alcohol consumption and bone mineral density in elderly Korean men and women. Arch Osteoporos 2018;13:46ArticlePubMedPDF
- 14. National Cholesterol Education Program (NCEP) Expert Panel on Detection, Evaluation, and Treatment of High Blood Cholesterol in Adults (Adult Treatment Panel III). NCEP) Expert Panel on Detection, Evaluation, and Treatment of High Blood Cholesterol in Adults (Adult Treatment Panel III). Third report of the National Cholesterol Education Program (NCEP) Expert Panel on Detection, Evaluation, and Treatment of High Blood Cholesterol in Adults (Adult Treatment Panel III) final report. Circulation 2002;106:3143-3421. ArticlePubMed
- 15. Kim BJ, Kim BS, Kang JH. Alcohol consumption and incidence of metabolic syndrome in Korean men. A 3-year follow-up study. Circ J 2012;76:2363-2371. ArticlePubMed
- 16. Baik I, Shin C. Prospective study of alcohol consumption and metabolic syndrome. Am J Clin Nutr 2008;87:1455-1463. ArticlePubMed
- 17. Yeomans MR, Caton S, Hetherington MM. Alcohol and food intake. Curr Opin Clin Nutr Metab Care 2003;6:639-644. ArticlePubMed
- 18. Kim JY, Lee DY, Lee YJ, Park KJ, Kim KH, Kim JW, Kim WH. Chronic alcohol consumption potentiates the development of diabetes through pancreatic β-cell dysfunction. World J Biol Chem 2015;6:1-15. ArticlePubMedPMC
- 19. Rupp H, Brilla CG, Maisch B. Hypertension and alcohol: central and peripheral mechanisms. Herz 1996;21:258-264. PubMed
- 20. Potter JF, Watson RD, Skan W, Beevers DG. The pressor and metabolic effects of alcohol in normotensive subjects. Hypertension 1986;8:625-631. ArticlePubMed
- 21. Arkwright PD, Beilin LJ, Vandongen R, Rouse IA, Lalor C. The pressor effect of moderate alcohol consumption in man: a search for mechanisms. Circulation 1982;66:515-519. ArticlePubMed
- 22. Altura BM, Altura BT. Microvascular and vascular smooth muscle actions of ethanol, acetaldehyde, and acetate. Fed Proc 1982;41:2447-2451. PubMed
- 23. Husain K, Ansari RA, Ferder L. Alcohol-induced hypertension: mechanism and prevention. World J Cardiol 2014;6:245-252. ArticlePubMedPMC
- 24. Mudrakova E, Poledne R, Kovar J. Postprandial triglyceridemia after single dose of alcohol in healthy young men. Nutr Metab Cardiovasc Dis 2013;23:183-188. ArticlePubMed
- 25. Schneider J, Liesenfeld A, Mordasini R, Schubotz R, Zofel P, Kubel F, Vandre-Plozzitzka C, Kaffarnik H. Lipoprotein fractions, lipoprotein lipase and hepatic triglyceride lipase during short-term and long-term uptake of ethanol in healthy subjects. Atherosclerosis 1985;57:281-291. ArticlePubMed
- 26. Klop B, do Rego AT, Cabezas MC. Alcohol and plasma triglycerides. Curr Opin Lipidol 2013;24:321-326. ArticlePubMed
- 27. Fraser GE, Anderson JT, Foster N, Goldberg R, Jacobs D, Blackburn H. The effect of alcohol on serum high density lipoprotein (HDL). A controlled experiment. Atherosclerosis 1983;46:275-286. ArticlePubMed
- 28. Haskell WL, Camargo C Jr, Williams PT, Vranizan KM, Krauss RM, Lindgren FT, Wood PD. The effect of cessation and resumption of moderate alcohol intake on serum high-density-lipoprotein subfractions. A controlled study. N Engl J Med 1984;310:805-810. ArticlePubMed
- 29. Crouse JR, Grundy SM. Effects of alcohol on plasma lipoproteins and cholesterol and triglyceride metabolism in man. J Lipid Res 1984;25:486-496. ArticlePubMed
- 30. Taskinen MR, Nikkila EA, Valimaki M, Sane T, Kuusi T, Kesaniemi A, Ylikahri R. Alcohol-induced changes in serum lipoproteins and in their metabolism. Am Heart J 1987;113:458-464. ArticlePubMed
- 31. Clevidence BA, Reichman ME, Judd JT, Muesing RA, Schatzkin A, Schaefer EJ, Li Z, Jenner J, Brown CC, Sunkin M, Campbell WS, Taylor PR. Effects of alcohol consumption on lipoproteins of premenopausal women. A controlled diet study. Arterioscler Thromb Vasc Biol 1995;15:179-184. PubMed
- 32. De Oliveira E Silva ER, Foster D, McGee Harper M, Seidman CE, Smith JD, Breslow JL, Brinton EA. Alcohol consumption raises HDL cholesterol levels by increasing the transport rate of apolipoproteins A-I and A-II. Circulation 2000;102:2347-2352. ArticlePubMed
- 33. Chartier K, Caetano R. Ethnicity and health disparities in alcohol research. Alcohol Res Health 2010;33:152-160. PubMedPMC
- 34. Williams GD, Aitken SS, Malin H. Reliability of self-reported alcohol consumption in a general population survey. J Stud Alcohol 1985;46:223-227. ArticlePubMed
- 35. Giovannucci E, Colditz G, Stampfer MJ, Rimm EB, Litin L, Sampson L, Willett WC. The assessment of alcohol consumption by a simple self-administered questionnaire. Am J Epidemiol 1991;133:810-817. ArticlePubMed
- 36. Hines LM, Stampfer MJ, Ma J, Gaziano JM, Ridker PM, Hankinson SE, Sacks F, Rimm EB, Hunter DJ. Genetic variation in alcohol dehydrogenase and the beneficial effect of moderate alcohol consumption on myocardial infarction. N Engl J Med 2001;344:549-555. ArticlePubMed
- 37. Beulens JW, Rimm EB, Hendriks HF, Hu FB, Manson JE, Hunter DJ, Mukamal KJ. Alcohol consumption and type 2 diabetes: influence of genetic variation in alcohol dehydrogenase. Diabetes 2007;56:2388-2394. PubMed
REFERENCES
Association between change in alcohol consumption and change in waist circumference or fasting serum glucose. Adjusted mean values of change in (A) waist circumference or (B) fasting serum glucose were calculated for initial non-drinkers, light drinkers, moderate drinkers, and heavy drinkers according to follow-up alcohol consumption: non-drinkers (0.0 g/day), light drinkers (0.1 to 19.9 g/day for males, 0.1 to 9.9 g/day for females), moderate drinkers (20.0 to 39.9 g/day for males, 10.0 to 19.9 g/day for females), heavy drinkers (≥40.0 g/day for males, ≥20.0 g/day for females). Adjusted mean values determined by linear regression analysis after adjustments for age, sex, household income, education level, physical activity, smoking, total energy intake, body mass index (excluded for analyses on change in waist circumference), past history of cardiovascular disease, family history of hypertension, diabetes, and dyslipidemia, and follow-up duration. Groups without change in alcohol consumption were considered reference groups (e.g., initial non-drinkers to follow-up non-drinkers). P values for statistical significance: aP<0.05, bP<0.01, cP<0.001.
Association between change in alcohol consumption and change systolic or diastolic blood pressure. Adjusted mean values of change in (A) systolic or (B) diastolic blood pressure were calculated for initial non-drinkers, light drinkers, moderate drinkers, and heavy drinkers according to follow-up alcohol consumption: non-drinkers (0.0 g/day), light drinkers (0.1 to 19.9 g/day for males, 0.1 to 9.9 g/day for females), moderate drinkers (20.0 to 39.9 g/day for males, 10.0 to 19.9 g/day for females), heavy drinkers (≥40.0 g/day for males, ≥20.0 g/day for females). Adjusted mean values determined by linear regression analysis after adjustments for age, sex, household income, education level, physical activity, smoking, total energy intake, body mass index, past history of cardiovascular disease, family history of hypertension, diabetes, and dyslipidemia, and follow-up duration. Groups without change in alcohol consumption were considered reference groups (e.g., initial non-drinkers to follow-up non-drinkers). P values for statistical significance: aP<0.05, bP<0.01, cP<0.001.
Association between change in alcohol consumption and change triglycerides or high density lipoprotein cholesterol (HDL-C). Adjusted mean values of change in (A) triglycerides or (B) HDL-C were calculated for initial non-drinkers, light drinkers, moderate drinkers, and heavy drinkers according to follow-up alcohol consumption: non-drinkers (0.0 g/day), light drinkers (0.1 to 19.9 g/day for males, 0.1 to 9.9 g/day for females), moderate drinkers (20.0 to 39.9 g/day for males, 10.0–19.9 g/day for females), heavy drinkers (≥40.0 g/day for males, ≥20.0 g/day for females). Adjusted mean values determined by linear regression analysis after adjustments for age, sex, household income, education level, physical activity, smoking, total energy intake, body mass index, past history of cardiovascular disease, family history of hypertension, diabetes, and dyslipidemia, and follow-up duration. Groups without change in alcohol consumption were considered reference groups (e.g., initial non-drinkers to follow-up non-drinkers). P values for statistical significance: aP<0.05, bP<0.01, cP<0.001.

Descriptive characteristics of the study population
Values are presented as mean±standard deviation or number (%). Non-drinkers (0.0 g/day), light drinkers (0.1–19.9 g/day for males, 0.1–9.9 g/day for females), moderate drinkers (20.0–39.9 g/day for males, 10.0–19.9 g/day for females), heavy drinkers (≥40.0 g/day for males, ≥20.0 g/day for females). P values calculated by the chi-square test for categorical variables and analysis of variance for continuous variables.
Association between change in alcohol consumption and metabolic syndrome
Values are presented as number (%). Non-drinkers (0.0 g/day), light drinkers (0.1–19.9 g/day for males, 0.1–9.9 g/day for females), moderate drinkers (20.0–39.9 g/day for males, 10.0–19.9 g/day for females), heavy drinkers (≥40.0 g/day for males, ≥20.0 g/day for females). Odds ratio calculated by logistic regression analysis after adjustments for age, sex, household income, education level, physical activity, smoking, total energy intake, body mass index, past history of cardiovascular disease, family history of hypertension, diabetes, or dyslipidemia, follow-up duration, and baseline metabolism risk score.
aOR, adjusted odds ratio; CI, confidence interval.
Figure & Data
References
Citations
- Inverse association between type 2 diabetes and hepatocellular carcinoma in East Asian populations
Jinlong Huo, Yaxuan Xu, Xingqi Chen, Jie Yu, Lijin Zhao
Frontiers in Endocrinology.2024;[Epub] CrossRef - Regulation Mechanism and Potential Value of Active Substances in Spices in Alcohol–Liver–Intestine Axis Health
Jianyu Huang, Tao Huang, Jinjun Li
International Journal of Molecular Sciences.2024; 25(7): 3728. CrossRef - Impact of green space and built environment on metabolic syndrome: A systematic review with meta-analysis
Muhammad Mainuddin Patwary, Mohammad Javad Zare Sakhvidi, Sadia Ashraf, Payam Dadvand, Matthew H.E.M. Browning, Md Ashraful Alam, Michelle L. Bell, Peter James, Thomas Astell-Burt
Science of The Total Environment.2024; 923: 170977. CrossRef - Causal effects of sleep traits on metabolic syndrome and its components: a Mendelian randomization study
Yongli Yang, Long Wen, Xuezhong Shi, Chaojun Yang, Jingwen Fan, Yi Zhang, Guibin Shen, Huiping Zhou, Xiaocan Jia
Sleep and Breathing.2024;[Epub] CrossRef - Use of biochemical markers for diabetes prevention in the new decade
Marie Chan Sun, Marie A. S. Landinaff, Ruben Thoplan
Physical Sciences Reviews.2023; 8(11): 3767. CrossRef - Alcohol consumption and metabolic syndrome: Clinical and epidemiological impact on liver disease
Fredrik Åberg, Christopher D. Byrne, Carlos J. Pirola, Ville Männistö, Silvia Sookoian
Journal of Hepatology.2023; 78(1): 191. CrossRef - Serum Nutritional Biomarkers and All-Cause and Cause-Specific Mortality in U.S. Adults with Metabolic Syndrome: The Results from National Health and Nutrition Examination Survey 2001–2006
Xinwei Peng, Jingjing Zhu, Henry S. Lynn, Xi Zhang
Nutrients.2023; 15(3): 553. CrossRef - Evaluation and Treatment of Obesity and Its Comorbidities: 2022 Update of Clinical Practice Guidelines for Obesity by the Korean Society for the Study of Obesity
Kyoung-Kon Kim, Ji-Hee Haam, Bom Taeck Kim, Eun Mi Kim, Jung Hwan Park, Sang Youl Rhee, Eonju Jeon, Eungu Kang, Ga Eun Nam, Hye Yeon Koo, Jeong-Hyun Lim, Jo-Eun Jeong, Jong-Hee Kim, Jong Won Kim, Jung Ha Park, Jun Hwa Hong, Sang Eok Lee, Se Hee Min, Seung
Journal of Obesity & Metabolic Syndrome.2023; 32(1): 1. CrossRef - Association between alcohol consumption and risk of hyperuricaemia among adults: a large cross-sectional study in Chongqing, China
Siyu Chen, Rui Ding, Xiaojun Tang, Liling Chen, Qinwen Luo, Meng Xiao, Xianbin Ding, Bin Peng
BMJ Open.2023; 13(12): e074697. CrossRef - Lifestyle Factors Associated with Metabolic Syndrome in Urban Cambodia
Miharu Tamaoki, Ikumi Honda, Keisuke Nakanishi, Maki Nakajima, Sophathya Cheam, Manabu Okawada, Hisataka Sakakibara
International Journal of Environmental Research and Public Health.2022; 19(17): 10481. CrossRef - Gender Differences of Health Behaviors in the Risk of Metabolic Syndrome for Middle-Aged Adults: A National Cross-Sectional Study in South Korea
Jaehee Yoon, Jeewuan Kim, Heesook Son
International Journal of Environmental Research and Public Health.2021; 18(7): 3699. CrossRef - Association between alcohol consumption and metabolic syndrome among Chinese adults
Yi Lin, Yan-Yan Ying, Si-Xuan Li, Si-Jia Wang, Qing-Hai Gong, Hui Li
Public Health Nutrition.2021; 24(14): 4582. CrossRef - Triglyceride-rich lipoprotein and LDL particle subfractions and their association with incident type 2 diabetes: the PREVEND study
Sara Sokooti, Jose L. Flores-Guerrero, Hiddo J. L. Heerspink, Margery A. Connelly, Stephan J. L. Bakker, Robin P. F. Dullaart
Cardiovascular Diabetology.2021;[Epub] CrossRef
 PubReader
 Cite
Cite