- Current
- Browse
- Collections
-
For contributors
- For Authors
- Instructions to authors
- Article processing charge
- e-submission
- For Reviewers
- Instructions for reviewers
- How to become a reviewer
- Best reviewers
- For Readers
- Readership
- Subscription
- Permission guidelines
- About
- Editorial policy
Articles
- Page Path
- HOME > Diabetes Metab J > Ahead-of print > Article
-
Original ArticleType 1 Diabetes A New Tool to Identify Pediatric Patients with Atypical Diabetes Associated with Gene Polymorphisms
-
Sophie Welsch1
 , Antoine Harvengt1, Paola Gallo2, Manon Martin3, Dominique Beckers4, Thierry Mouraux4, Nicole Seret5, Marie-Christine Lebrethon6, Raphaël Helaers7, Pascal Brouillard7, Miikka Vikkula7, Philippe A. Lysy1,2
 -
DOI: https://doi.org/10.4093/dmj.2023.0166
Published online: March 22, 2024
- 828 Views
- 53 Download
1Pediatrics Unit, Institute for Experimental and Clinical Research, UCLouvain, Brussels, Belgium
2Pediatric Endocrinology Unit, Saint-Luc University Clinics, Brussels, Belgium
3Louvain Institute of Biomolecular Science and Technology (IBST) Unit, UCLouvain, Brussels, Belgium
4Pediatric Endocrinology and Diabetology Unit, CHU-UCL Namur sites Saint-Elisabeth and Mont-Godinne, Namur, Belgium
5Pediatric Endocrinology and Diabetology Unit, Clinique CHC MontLégia (CHC MontLégia Clinic), Liège, Belgium
6Pediatric Endocrinology Unit, CHU of Liège site ND-des Bruyères, Liège, Belgium
7Human Molecular Genetics, de Duve Institute, UCLouvain, Brussels, Belgium
- Corresponding author: Philippe A. Lysy Pediatric Endocrinology Unit, Cliniques Universitaires Saint-Luc, Avenue Hippocrate 10/B2, BE-1200 Woluwe-Saint-Lambert, Brussels, Belgium E-mail: philippe.lysy@saintluc.uclouvain.be
Copyright © 2024 Korean Diabetes Association
This is an Open Access article distributed under the terms of the Creative Commons Attribution Non-Commercial License (http://creativecommons.org/licenses/by-nc/4.0/) which permits unrestricted non-commercial use, distribution, and reproduction in any medium, provided the original work is properly cited.
ABSTRACT
-
Background
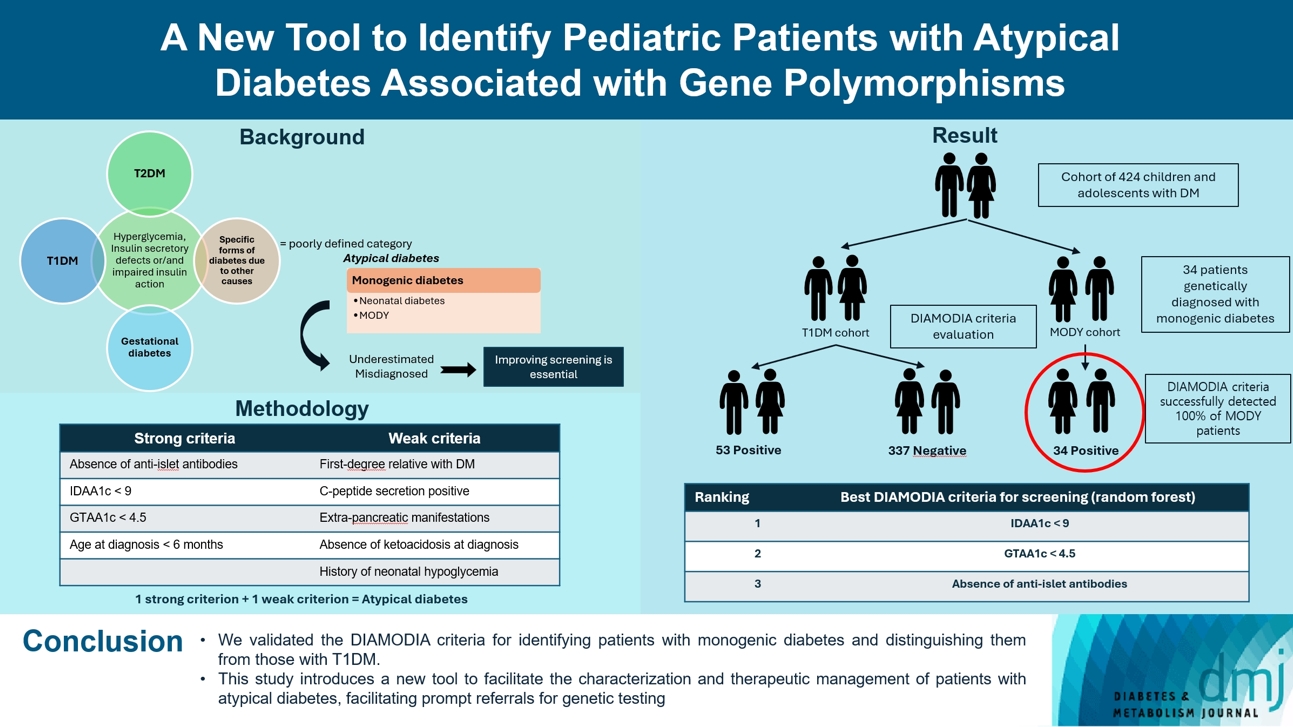
- Recent diabetes subclassifications have improved the differentiation between patients with type 1 diabetes mellitus (T1DM) and type 2 diabetes mellitus despite several overlapping features, yet without considering genetic forms of diabetes. We sought to facilitate the identification of monogenic diabetes by creating a new tool that we validated in a pediatric maturity-onset diabetes of the young (MODY) cohort.
-
Methods
- We first created the DIAgnose MOnogenic DIAbetes (DIAMODIA) criteria based on the pre-existing, but incomplete, MODY calculator. This new score is composed of four strong and five weak criteria, with patients having to display at least one weak and one strong criterion.
-
Results
- The effectiveness of the DIAMODIA criteria was evaluated in two patient cohorts, the first consisting of patients with confirmed MODY diabetes (n=34) and the second of patients with T1DM (n=390). These DIAMODIA criteria successfully detected 100% of MODY patients. Multiple correspondence analysis performed on the MODY and T1DM cohorts enabled us to differentiate MODY patients from T1DM. The three most relevant variables to distinguish a MODY from T1DM profile were: lower insulin-dose adjusted A1c score ≤9, glycemic target-adjusted A1c score ≤4.5, and absence of three anti-islet cell autoantibodies.
-
Conclusion
- We validated the DIAMODIA criteria, as it effectively identified all monogenic diabetes patients (MODY cohort) and succeeded to differentiate T1DM from MODY patients. The creation of this new and effective tool is likely to facilitate the characterization and therapeutic management of patients with atypical diabetes, and promptly referring them for genetic testing which would markedly improve clinical care and counseling, as well.
- • The new tool DIAMODIA effectively detects monogenic diabetes.
- • DIAMODIA criteria consist of four strong and five weak indicators.
- • Validation of DIAMODIA ensures complete MODY detection and distinguishes it from T1D.
- • Discriminating factors include IDAA1c ≤ 9, GTAA1c ≤ 4.5, and absence of autoantibodies.
- • Clinically, this implies a more accurate diagnosis leading to enhanced care.
Highlights
- Diabetes mellitus is characterized by a state of chronic hyperglycemia and refers to a heterogeneous disease group in terms of etiologies and therapeutic options [1]. Although type 1 diabetes mellitus (T1DM) diagnosis is confirmed by the detection of specific antibodies [2], T1DM and type 2 diabetes mellitus (T2DM) are clinically characterized by their phenotype and evolution, without precise etiological or pathognomonic criteria. Several overlapping features and the overarching term diabetes mellitus have led to the introduction of novel clustering approaches helping the clinicians choose the best therapeutic interventions. A diabetes subclassification (ANDIS; the Ahlqvist classification) was recently established [3]. Although it has improved the differentiation between T1DM and T2DM, its deconstruction of the disease heterogeneity was based on phenotypic criteria without considering genetic diabetes forms.
- Monogenic diabetes result from genetic mutations altering either insulin production or insulin action. Less common (<5% of cases) and often confused with T1DM [4,5] or T2DM [6,7], these forms can be divided into two groups: maturity-onset diabetes of the young (MODY) and permanent or transient neonatal diabetes. Despite the relevance of appropriate etiology-based diagnosis, monogenic diabetes forms remain largely underdiagnosed [8,9], given that 2% to 3% of diabetic patients suffer from undetected genetic forms [10]. Diabetes of genetic origin has multiple consequences, for instance, at the therapeutic levels, some forms do not require treatment (i.e., glucokinase [GCK]-MODY diabetes), while others respond to oral agents (i.e., HNF1 homeobox A [HNF1A]-MODY diabetes) or require specific medical follow-up due to extra-pancreatic manifestations (i.e., HNF1 homeobox B [HNF1B] diabetes). Furthermore, a dominant or recessive mutation may imply disease transmission to the offspring and presence of the gene mutation in family relatives [11].
- To our knowledge, there is no clear criterion or algorithm diagnosing monogenic diabetes in pediatrics. The only available tool, the MODY calculator [12], provides the probability for a given patient to present monogenic diabetes based on clinical variables, without taking into consideration different critical parameters, including anti-islet cell autoantibodies, C-peptide secretion, or glycemic variability indices. Therefore, multicenter screening study of GENEtic forms of PEDiatric DIABetes (GENEPEDIAB) study, sought to create and validate the DIAgnose MOnogenic DIAbetes (DIAMODIA) criteria, as an effective screening tool for monogenic diabetes.
INTRODUCTION
- Study context
- The GENEPEDIAB study is a multicenter, retro- and prospective, interventional, and diagnostic study aiming to screen for monogenic diabetes patients and propose a new atypical diabetes detection approach based on the creation of a new tool. For this study, Cliniques Universitaires Saint-Luc (CUSL) collaborated with four Belgian hospitals: University Hospital UCL Namur, Godinne site (Yvoir) and Saint Elisabeth site (Namur); CHU Liège and ND-des Bruyères site (Liège); Cliniques CHC Mont-Légia (Liège). The GENEPEDIAB study is a sub-part of the DiaType project (multidisciplinary consortium of three Belgian universities [UCLouvain, Université Libre de Bruxelles, and Vrije Universiteit Brussel]). The protocol was approved by the CUSL central ethics committee and different local ethics committees (EC study number: 2018/23JAN/023). The study was performed in accordance with the Declaration of Helsinki. All children and their parents signed an assent or informed consent form.
- Patient selection
- Patients eligible to participate in the GENEPEDIAB study were between 6 months and 18 years of age and diagnosed with diabetes according to American Diabetes Association (ADA) criteria [1]: fasting blood glucose ≥126 mg/dL, blood glucose ≥200 mg/dL at the 120th minute of oral glucose tolerance test, glycosylated hemoglobin (HbA1c) ≥6.5%, or symptoms of hyperglycemia/hyperglycemic crisis with random glucose ≥200 mg/dL. Participating patients had been treated for T1DM or monogenic diabetes for at least 18 months before the start of the study. All monogenic diabetes were confirmed by next-generation sequencing on an Illumina MiSeq sequencer after multiplex polymerase chain reaction enrichment with the MODY MASTR kit (Multiplicom N.V., Niel, Belgium). Patients with T1DM were diagnosed on the basis of their initial clinical presentation.
- Creation of the DIAMODIA criteria
- To screen patients with monogenic diabetes, the most representative clinical features of monogenic diabetes were compiled into a new diagnostic tool, the DIAMODIA criteria. The criteria were chosen arbitrarily on basis of our clinical experience, data from the scientific literature and parameters of the MODY calculator. The MODY calculator is a well-known online resource (available on www.diabetesgenes.org) that uses clinical information to estimate the probability of occurring MODY diabetes. Criteria were classified as follows: (1) strong criteria: absence of anti-islet antibodies (anti-glutamate decarboxylase 65 [GAD65], islet cell antigen 2 [IA2], insulin), lower insulin-dose adjusted A1c (IDAA1c) ≤9 (18 months after diagnosis), glycemic target-adjusted A1c (GTAA1c) ≤4.5 (18 months after diagnosis), and age at diagnosis ≤6 months; (2) weak criteria: first-degree relative with diabetes, C-peptide positivity, extra-pancreatic manifestations, absence of diabetic ketoacidosis at diagnosis, and history of neonatal hypoglycemia. Patients presenting at least one strong and one weak criterion were considered to have atypical diabetes. DIAMODIA criteria are available online.
- Study design
- Patient data were collected and managed using Research Electronic Data Capture (REDCap) tools [13,14] provided by the Vanderbilt University (Nashville, TN, USA) and hosted at CUSL: (1) patient information: gender, date of birth, country of origin; (2) patient history: birth height, weight, history of gestational diabetes, neonatal hypoglycemia history, autoimmune disease, diabetes family history; (3) anthropometric data at diabetes diagnosis: diagnosis date, age, weight, height, body mass index (BMI), Tanner stage; (4) diabetes diagnosis testing: glycemia, HbA1c, islet autoantibodies (anti-GAD65, IA2, insulin percentage, and zinc transporter 8 [ZnT8]), human leukocyte antigen (HLA) genotype, basal C-peptide levels, residual insulin secretion, ketoacidosis defined by a venous pH <7.35 or bicarbonate <22 mmol/L [15]; (5) diabetes management: treatment start date, treatment types; and (6) glycemic variability represented by three measures of IDAA1c and GTAA1c. Z-scores for height, weight, and BMI were adjusted for age and gender according to Belgian reference standards [16]. BMI score evaluation was based on the international BMI cut‐offs (International Obesity Task Force) for thinness, overweight, and obesity in children and adolescents [17]. The IDAA1c score has been commonly used, in conjunction with the GTAA1c score to determine glycemic variability in terms of “daily insulin requirements” and “time in normoglycemic range” for adjusting standard HbA1c levels as described by Mortensen et al. [18] and Nielens et al. [19], as follows: IDAA1c=HbA1c (%)+[4×insulin-dose (IU/kg body weight/day)]; GTAA1c= HbA1c (%)–[3×% of normoglycemic values (70–180 mg/dL)]. For each patient, we selected three consultation dates, at least 18 months after diabetes diagnosis to avoid the influence of partial remission; we collected information about HbA1c, daily insulin requirement (dose in IU/kg body weight/day), and normoglycemia percentage (blood glycemic value ranging from 70 to 180 mg/dL). We calculated three different values of IDAA1c and GTAA1c to obtain a mean score.
- Statistical analyses
- All statistical analyses were performed using R version 4.2.2 (R Foundation for Statistical Computing, Vienna, Austria) [20]. A P<0.05 was considered statistically significant, all P values being two-tailed. Categorial variables were expressed as numbers and percentages, and continuous variables as means and standard deviation. The Wilcoxon rank sum test was used to compare continuous variables between T1DM and MODY groups, and Pearson’s chi-square test and Fisher’s exact test to compare categorical variables between T1DM and MODY groups. An exploratory multivariate analysis (multiple correspondence analysis [MCA]) was performed with DIAMODIA criteria (categorial data) of T1DM and MODY cohorts using the FactoMineR package [21]. Univariate logistic regressions were performed to compare T1DM and MODY patients based on each DIAMODIA criterion, with all resulting P values adjusted by false discovery rate for multiple comparisons. With a similar purpose, a randomForest (R package randomForest [22]) was employed to rank the DIAMODIA criteria based on the classification of T1DM versus MODY patients. Finally, a multinominal lasso regression analysis was conducted using the glmnet package [23] to explain the class of patients (T1DM and MODY) based on the DIAMODIA criteria. Prior to this multinominal lasso regression, some patients were filtered out to avoid too many missing values, the few remaining missing values being imputed by a K-nearest neighbors’ algorithm with the VIM package [24].
METHODS
- Overall, 424 children and adolescents treated for diabetes were included and classified as follows: 34 patients with confirmed monogenic diabetes (MODY cohort) and 390 patients with T1DM (baseline T1DM cohort). To assess the effectiveness of the DIAMODIA criteria, we applied them first to the MODY cohort and then to the baseline T1DM cohort. Finally, we compared the data collected to assess the importance of each of the criteria used.
- Characterization of MODY patients
- Of the 34 MODY patients, all were under the age of 18 years at diabetes diagnosis (mean age, 6.98±4.9 years) and 58.8% were male. Furthermore, only one patient (HNF1A) was of North African origin (Morocco), the other patients being of European origin (27/34, Central Europe; 5/34, Eastern Europe; 1/34, Iberian Region; and 1/34, British Isles). Most MODY patients presented a mutation in HNF1A (10/34) and GCK (13/34). Most MODY patients presented a mutation in hepatocyte nuclear factor 4 alpha (HNF4A; MODY1, 4/34), ATP binding cassette subfamily C member 8 (ABCC8; neonatal diabetes mellitus, rectifying channel subfamily J member 11 (KCNJ11; neonatal diabetes mellitus, 2/34). One patient presented a SLC19A2 gene mutation that was not listed in the MODY gene panel; none presented positive anti-islet cell autoantibodies. Almost half of MODY patients required treatment for diabetes (15/34), of whom six used antidiabetic drugs (biguanides, n=3; sulfonylureas, n=2; glinides, n=1). The other nine patients, bearing mostly the mutated HNF1A (4/9), were treated with insulin. Some MODY patients presented extra-pancreatic manifestations (13/34), mainly affecting the kidneys (n=4), and liver (n=2) (Table 1).). The MODY cohort is described according to genetic mutation in Supplementary Table 1.
- Evaluation of DIAMODIA criteria in the MODY cohort
- All MODY patients who were subjected to the DIAMODIA criteria met at least one weak and one strong criterion of atypical diabetes and 28 out of these 34 patients met five criteria regardless the mutation. MODY patients did not present any anti-islet cell autoantibodies, with 82% of the MODY cohort presenting values <9 for IDAA1c and <4.5 for GTAA1c scores. Three MODY patients were younger than 6 months at diabetes onset, carrying the mutated genes ABCC8, HNF1B, and KCNJ11. More than 85% of our MODY cohort displayed residual C-peptide secretion (29/32) and had a family member with diabetes (29/34), mainly the mother (19/29). Two of the three patients without residual C-peptide secretion carried mutated KCNJ11, and the third one mutated HNF1A. Four patients (12.1%) with mutated KCNJ11 (n=2), HNF1A (n=1), and GCK (n=1) displayed ketoacidosis at diagnosis. Approximatively 40% exhibited an extra-pancreatic manifestation (12/31), mainly affecting the kidneys (n=4) and liver (n=2), whilst 20% (7/33) displayed neonatal hypoglycemia (Tables 2 and 3). In contrast, the MODY calculator positively identified 27 of the 34 genetically confirmed monogenic patients. For the remaining seven patients, this score recommended a more extensive biological evaluation (autoantibodies/residual C-peptide secretion) before carrying out the various genetic tests, depending on the biological results. As a result, the DIAMODIA criteria were statistically superior to the MODY calculator (34/34 vs. 27/34, P<0.001).
- Characterization of baseline T1DM cohort
- The baseline T1DM cohort comprised as many boys than girls (50% vs. 50%) and all the cohort patients were under 18 years of age at diabetes diagnosis. At diagnosis, the glycemia level and the HbA1c were above the values recommended by the ADA guidelines. In addition, 36.3% of patients also suffered from diabetic ketoacidosis at the time of diagnosis. Subsequently, all T1DM patients were treated with insulin therapy, and 13.2% also suffered from another autoimmune disease. The whole cohort is described and compared with the MODY cohort in Table 1.
- Evaluation of DIAMODIA criteria in the baseline T1DM cohort
- Among the 390 patients in our baseline T1DM cohort, 337 tested negative according to our DIAMODIA criteria (cohort of T1DM patients [Tdia] cohort). However, 53 patients from our initial cohort tested positive. These 53 patients will be classified as having atypical diabetes (cohort of patients with atypical diabetes [Adia] cohort). The two cohorts are described and compared with the MODY cohort in Table 2. When examining the responses to the DIAMODIA criteria, we observed significant differences for all major criteria between the two cohorts, except for age at diagnosis less than 6 months. Conversely, we found no significant differences for the minor criteria between the two cohorts, except for residual C-peptide secretion (Table 3). The Adia cohort will undergo various genetic analyses to broaden the screening of monogenic diabetes. Results of genetic analysis will be discussed in an upcoming article. On the other hand, we compared the cohorts MODY and Tdia to assess the importance of the DIAMODIA criteria.
- Evaluation of DIAMODIA variables
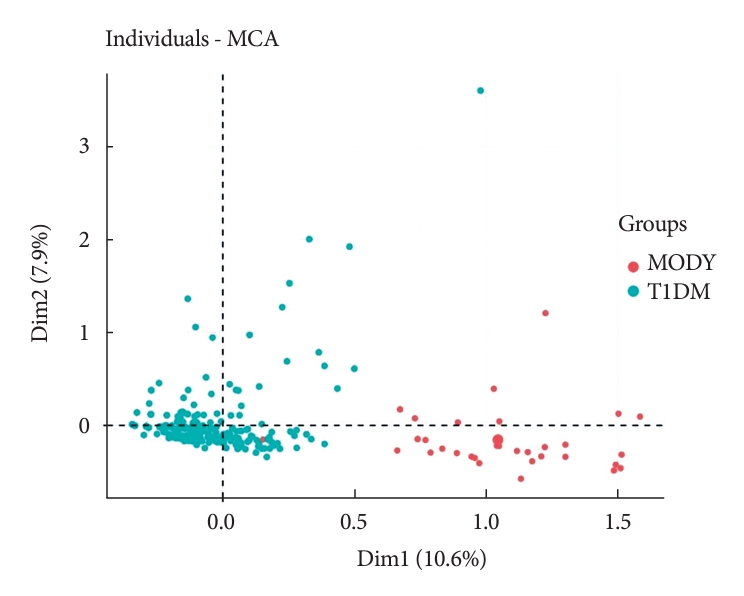
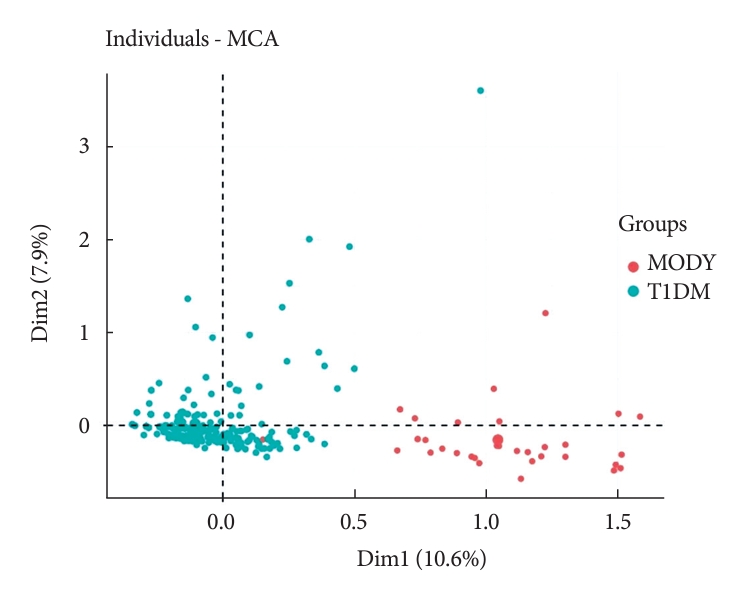
- To evaluate the DIAMODIA criteria, variables of MODY and Tdia cohorts were first analyzed using exploratory multivariate analysis (MCA). Fig. 1 shows the formation of two distinct clusters suggesting that, based only on DIAMODIA variables, the two cohorts behaved differently with individualization of MODY and Tdia cohorts. Therefore, our DIAMODIA variables enabled us to differentiate MODY patients from Tdia. One patient bearing a KCNJ11 mutation presented characteristics and a phenotype as Tdia patients. This patient displayed IDAA1c and GTAA1c scores above the recommended values, had one family member with diabetes, lacked C-peptide secretion, and was treated with insulin (0.65 IU/kg body weight/day). At diagnosis, the patient was 8 months old and presented ketoacidosis.
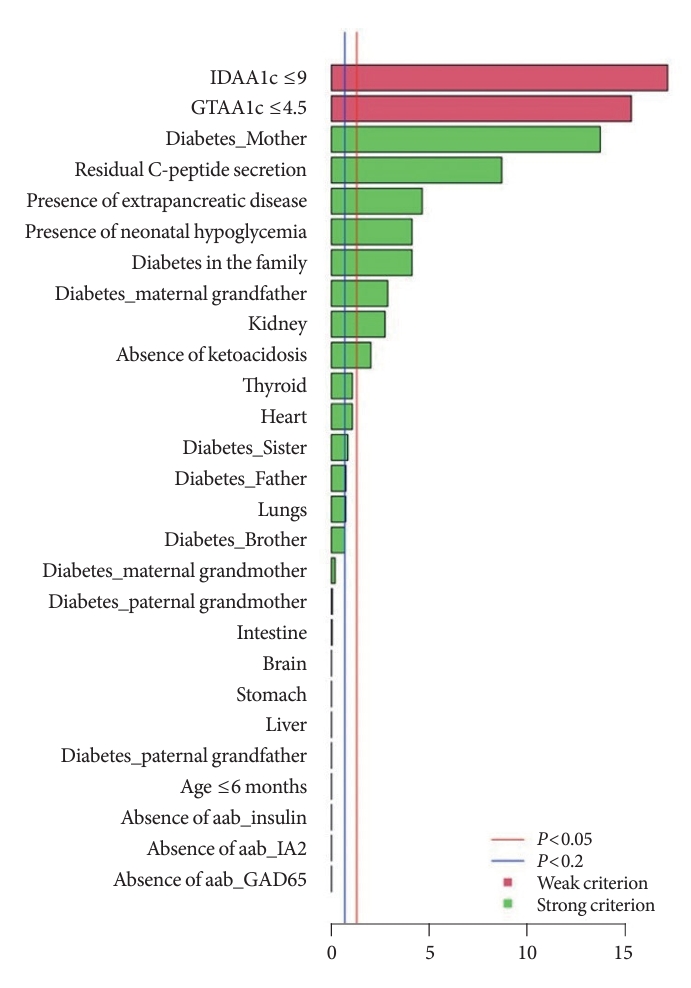
- The independently performed tests (Table 3) that compared variables between MODY and Tdia cohorts revealed that the MODY cohort presented significantly higher DIAMODIA criteria (P<0.001) than the Tdia cohort. In addition, univariate logistic regressions, adjusted for multiple comparisons, were performed to compare Tdia and MODY patients based on each DIAMODIA variable. Fig. 2 illustrates the significant differences (P<0.05) between MODY and Tdia cohorts for the following criteria: IDAA1c score ≤9; GTAA1c score ≤4.5; presence of a familial diabetes and more specifically if carried by the mother or maternal grand-father; persistence of C-peptide secretion; extra-pancreatic manifestations affecting especially the kidneys; absence of ketoacidosis at diabetes diagnostic; history of neonatal hypoglycemia. These results suggested that the presence of all cited variables, independent of each other, enabled us to differentiate a MODY profile from a Tdia. Of note, for the “diabetes diagnostic before 6 months old” criterion, logistic regression was impossible due to its absence in the T1DM cohort, although present in three MODY patients. Similar observations were made for the “absence of three anti-islet cell autoantibodies” criterion, which was positive in all MODY patients, whilst being negative in Tdia patients.
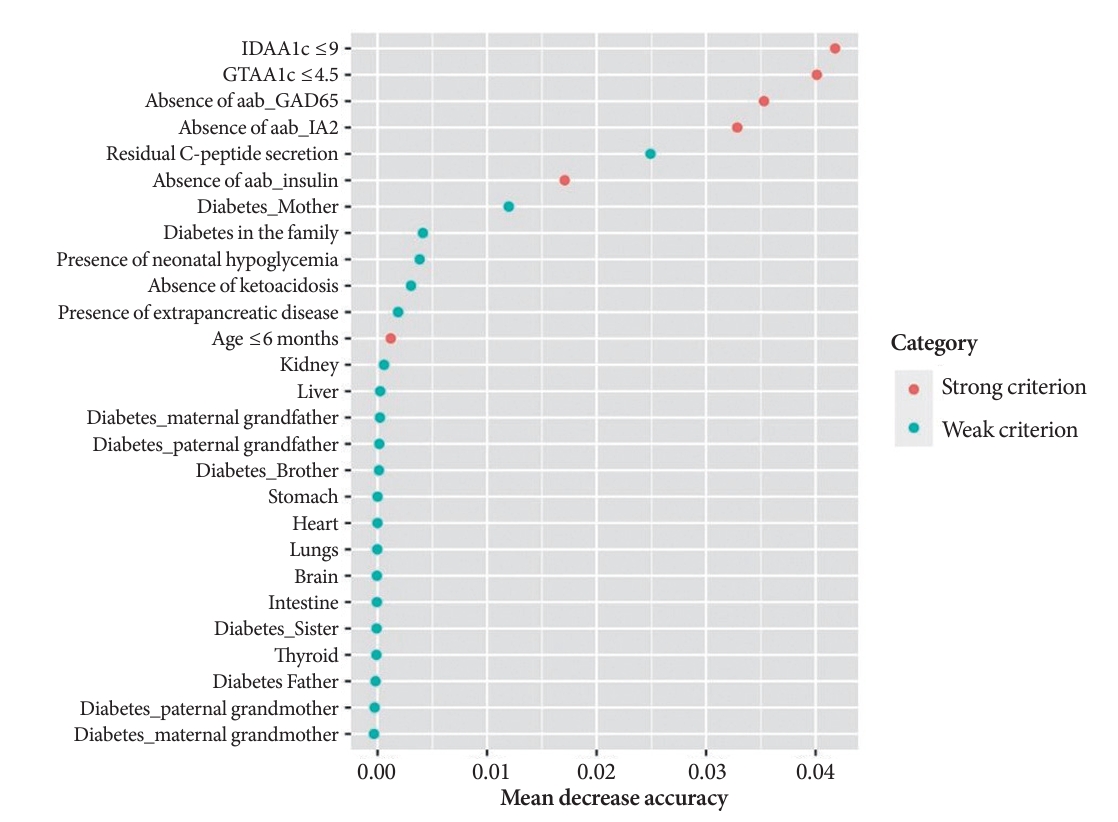
- A random Forest analysis ranked the DIAMODIA variables from the most relevant to the least relevant one to distinguish between MODY and Tdia profiles. As illustrated in Fig. 3, the ranking of DIAMODIA variables was in decreasing order: IDAA1c score ≤9, GTAA1c score ≤4.5, absence of three anti-islet cell autoantibodies, residual C-peptide secretion, having a member family with diabetes, neonatal hypoglycemia, absence of ketoacidosis at diagnosis, extra-pancreatic manifestations, and age of diabetes diagnosis under the age of 6 months. Variables 1 to 4 were associated with a higher average accuracy than variables 5 to 9, suggesting they were the most relevant in effectively differentiating a MODY profile from a Tdia.
RESULTS
- Diabetes mellitus is a common metabolic disease characterized by chronic hyperglycemia, which occurs in several forms (i.e., T1DM, T2DM, monogenic diabetes, rare forms of diabetes). More rarely, a genetic disorder is responsible for diabetes in 1% to 4% of patients. These disorders are characterized by either impaired β-cell function or insulin action dysfunction; more rarely, they are of mitochondrial origin [25,26]. In addition to being of different etiology, monogenic diabetes is more easily controllable and theoretically less severe than T1DM, both at time of diagnosis and over its course [1,27]. We clearly observed these differences between the different diabetes forms in our study. Indeed, the clinical presentation, glycemic mean, HbA1c, and time spent in normoglycemia were revealed to be significantly better in our MODY versus Tdia cohorts.
- Monogenetic diabetes occurrence is often underestimated. Several studies reported monogenic diabetes to be often confounded with T1DM or T2DM, owing to insufficient diagnostic investigations (etiology-based diagnosis) [11]. Therefore, our team has created the DIAMODIA criteria, which were initially based on the incomplete MODY probability calculator, while including additional clinical parameters to better distinguish atypical diabetes from T1DM, and thereby improving the screening of atypical diabetes forms. These additional criteria were chosen arbitrarily based on our clinical experience and the scientific literature. Conventionally, IDAA1c and GTAA1c represent two formulas used to ascertain whether a patient is under partial remission or not. In T1DM, following the initiation of insulin therapy, most patients (occurrence rate, 40% to 75%) experience a phase of partial remission characterized by the coexistence of low levels of glycemic variability and a reduction in exogenous insulin requirements. This transient phase typically lasts for less than a year. Furthermore, guidelines recommend reconsidering the diagnosis of T1DM in the event of prolonged partial remission. In this context, we have incorporated the IDAA1c and GTAA1c parameters into our DIAMODIA criteria to target patients experiencing extended partial remission [18,19,25,26]. Conversely, the other criteria are explicitly defined in the literature as parameters capable of distinguishing between T1DM and monogenic diabetes [25-27].
- The genetically confirmed MODY cohort clearly demonstrated the effectiveness of the newly created tool, DIAMODIA criteria, and validated its relevance with 100% efficiency in screening monogenic diabetes. Subsequently, the use of the DIAMODIA criteria in our T1DM cohort have allowed us to identify atypical forms of diabetes. The criteria that distinguished atypical diabetes from T1DM were the absence of anti-islet cell autoantibodies, high residual C-peptide secretion, and IDAA1c <9. The absence of anti-islet cell autoantibodies and residual C-peptide secretion were the two markers already known to target patients with atypical diabetes. Of note, several studies have previously recommended genetic analysis in all T1DM diagnosed patients that present no anti-islet cell autoantibodies at diagnosis [28-30].
- Our study displays several limitations, which must be mentioned. First, numerous data were missing owing to the retrospective study design. Second, all the patients were pediatric and under 18 years of age; clinical features occurring only after several decades of diabetes (e.g., as in HNF1B mutations) were thus not be considered. Finally, we did not test for the ZnT8 autoantibodies due to their rare occurrence.
- Finally, we believe it would also be useful to evaluate these clinical parameters in a larger cohort of patients with diabetes to confirm our results, especially among patients with monogenic diabetes. Indeed, these criteria could be studied in cohorts of adult patients or in a cohort of patient from a wider range of ethnic backgrounds.
- In conclusion, the GENEPEDIAB study demonstrated the effectiveness of our new tool, DIAMODIA criteria, in the screening of monogenic diabetes with an efficiency of 100% in the MODY cohort. The DIAMODIA criteria revealed a clinical polarization of T1DM and MODY diabetes. This new tool represents an asset to screen for monogenic diabetes, promptly referring them for genetic analyses, as necessary, and thus improving therapeutic management, clinical care, and counseling.
DISCUSSION
SUPPLEMENTARY MATERIALS
Supplementary Table 1.
-
CONFLICTS OF INTEREST
No potential conflict of interest relevant to this article was reported.
-
AUTHOR CONTRIBUTIONS
Conception or design: S.W., P.G., M.M., P.A.L.
Acquisition, analysis, or interpretation of data: all authors.
Drafting the work or revising: S.W., A.H., P.A.L.
Final approval of the manuscript: S.W., A.H., P.A.L.
-
FUNDING
This research was supported by clinical research funds from the Fondation Saint-Luc (FSL), the Fonds de la Recherche Scientifique (FNRS), Innoviris and Action de Recherche Concertée (ARC).
NOTES
-
Acknowledgements
- The work was supported by Innoviris, UCLouvain (Action de Recherche Concertée; ARC), Cliniques Universitaires Saint-Luc (Fonds de Recherche Clinique) and by the Fondation Saint-Luc (mandate and Bourse ‘Prof. Martin Buysschaert’). We thank the team of pediatric nurses from the general pediatric service of the Cliniques Universitaires Saint-Luc. Our center is a Reference center and part of the Endo-ERN rare diabetes study group.


| Variable | Total (n=424)a | Baseline T1DM (n=390) | MODY (n=34) | P value |
|---|---|---|---|---|
| Patient data | ||||
| Gender (girls), % | 49 | 50 | 41 | 0.32b,g |
| Neonatal history | ||||
| Birth weight, kg | 3.33±0.6 | 3.35±0.6 | 3.15±0.6 | 0.04c,f |
| Birht height, cm | 49.92±2.9 | 49.97±2.8 | 49.47±3.9 | 0.24b,f |
| Term, % | ||||
| Pre-term | 7.3 | 7.3 | 7.7 | 0.97b,g |
| Term | 84.8 | 84.8 | 84.6 | 0.97b,g |
| Post-term | 7.9 | 7.9 | 7.7 | 0.97b,g |
| Neonatal hypoglycemia, % | 5.1 | 3.1 | 25.9 | <0.001e |
| Gestationnal diabetes, % | 3.9 | 3.0 | 14.3 | 0.003d |
| Diabetes diagnosis | ||||
| Age, yr | 8.09±3.9 | 8.19±3.8 | 6.98±4.9 | 0.08b,f |
| Height-SDS | 0.02±1.2 | 0.05±1.1 | –0.31±1.3 | 0.07b,f |
| Weight-SDS | –0.43±1.3 | –0.46±1.3 | –0.07±1.2 | 0.04c,f |
| BMI-SDS | –0.72±1.6 | –0.78±1.6 | 0.07±1.6 | 0.002d,f |
| Glycemia, mg/dL | 446.36±224.9 | 465.84±215.8 | 203.38±194.7 | <0.001e,f |
| HbA1c, % | 11.05±2.5 | 11.36±2.2 | 7.14±2.2 | <0.001e,f |
| Diabetic ketoacidosis, % | 34.5 | 36.3 | 12.1 | 0.005d,g |
| Autoimmune disease (yes), % | 12.4 | 13.2 | 2.9 | <0.001e,g |
| Glycemic parameters | ||||
| HbA1c, % | 7.25±1.1 | 7.34±1.1 | 6.18±0.9 | <0.001e,f |
| TIR70-180, % | 46.66±14.8 | 44.64±12.1 | 76.70±17.3 | <0.001e,f |
| IDAA1c score | 10.78±1.8 | 11.06±1.5 | 7.09±1.9 | <0.001e,f |
| GTAA1c score | 5.89±1.3 | 6.04±1.1 | 3.79±1.3 | <0.001e,f |
| Chronic treatment | ||||
| Insulin treatment, % | 93.9 | 99.5 | 26.6 | NA |
| Antidiabetic drugs, % | ||||
| Biguanide | 4.0 | 3.6 | 8.8 | NA |
| Sulfonylureas | 0.4 | 0 | 5.8 | NA |
| Glinides | 0.2 | 0 | 2.9 | NA |
Values are presented as mean±standard deviation. Percentages may not total 100 due to rounding. Differences between T1DM cohort and MODY cohort were considered as significant when P value was under 0.05.
T1DM, type 1 diabetes mellitus; MODY, maturity-onset diabetes of the young; SDS, standard deviation score; BMI, body mass index; HbA1c, glycosylated hemoglobin; TIR70-180, time in range (70 to 180 mg/dL); IDAA1c, insulin-dose adjusted A1c; GTAA1c, glycemic target-adjusted A1c; NA, not applicable.
a Total, all diabetic patients in our study, the level of significance is represented as follows:
b nonsignificant,
c P<0.05,
d P<0.01,
e P<0.001,
f Wilcoxon rank,
g Chi-square (or their respective non-parametric tests).
| Variable | Tdia (n=337) | Adia (n=53) | MODY (n=34) |
P value |
|
|---|---|---|---|---|---|
| Tdia vs. Adia | Tdia vs. MODY | ||||
| Patient data | |||||
| Gender (girls), % | 51.6 | 42.7 | 41.2 | 0.26a,f | 0.84a,f |
| Neonatal history | |||||
| Birth weight, kg | 3.35±0.6 | 3.37±0.5 | 3.15±0.6 | 0.81a,e | 0.06a,e |
| Birht height, cm | 49.81±2.8 | 50.68±2.8 | 49.47±3.9 | 0.04b,e | 0.62a,e |
| Term, % | |||||
| Pre-term | 8.3 | 1.9 | 7.7 | 0.10a,f | 0.92a,f |
| Term | 83.7 | 90.7 | 84.6 | 0.20a,f | 0.81a,f |
| Post-term | 8.0 | 7.4 | 7.7 | 0.91a,f | 0.87a,f |
| Neonatal hypoglycemia, % | 2.9 | 3.9 | 25.9 | 0.75a,f | <0.001d,f |
| Gestationnal diabetes, % | 2.9 | 3.6 | 14.3 | 0.75a,f | <0.001d,f |
| Diabetes diagnosis | |||||
| Age, yr | 8.18±3.8 | 8.24±3.8 | 6.98±4.9 | 0.91a,e | 0.16a,e |
| Height-SDS | 0.03±1.1 | 0.12±1.4 | –0.31±1.3 | 0.64a,e | 0.14a,e |
| Weight-SDS | –0.49±1.2 | –0.30±1.3 | –0.07±1.2 | 0.32a,e | 0.06a,e |
| BMI-SDS | –0.82±1.6 | –0.61±1.8 | 0.07±1.6 | 0.51a,e | 0.002b,e |
| Glycemia, mg/dL | 478.95±215.2 | 405.28±209.9 | 203.38±194.7 | 0.02b,e | <0.001d,e |
| HbA1c, % | 11.47±2.2 | 10.88±2.4 | 7.14±2.2 | 0.09a,e | <0.001d,e |
| Diabetic ketoacidosis, % | 38.1 | 28.4 | 12.1 | 0.17a,f | 0.002c,f |
| Autoimmune disease (yes), % | 14.6 | 6.8 | 2.9 | 0.17a,f | 0.04b,f |
| Glycemic parameters | |||||
| HbA1c, % | 7.49±1.1 | 6.59±0.7 | 6.18±0.9 | <0.001d,e | <0.001d,e |
| TIR70-180, % | 43.12±10.9 | 51.62±15.2 | 76.70±17.3 | 0.003d,e | <0.001d,e |
| IDAA1c score | 11.34±1.4 | 9.71±1.4 | 7.09±1.9 | <0.001d,e | <0.001d,e |
| GTAA1c score | 6.25±1.0 | 4.97±0.8 | 3.79±1.3 | <0.001d,e | <0.001d,e |
| Chronic treatment | |||||
| Insulin treatment, % | 100 | 96 | 26.5 | NA | NA |
| Antidiabetic drugs, % | |||||
| Biguanide | 3.3 | 6.7 | 8.8 | NA | NA |
| Sulfonylureas | 0 | 0 | 5.8 | NA | NA |
| Glinides | 0 | 0 | 2.9 | NA | NA |
Values are presented as mean±standard deviation. Percentages may not total 100 due to rounding. Differences between the three cohorts were considered as significant when P value was under 0.05.
Tdia, cohort of type 1 diabetes mellitus patients; Adia, cohort of patients with atypical diabetes; MODY, maturity-onset diabetes of the young; SDS, standard deviation score; BMI, body mass index; HbA1c, glycosylated hemoglobin; TIR70-180, time in range (70 to 180 mg/dL); IDAA1c, insulin-dose adjusted A1c; GTAA1c, glycemic target-adjusted A1c; NA, not applicable.
The level of significance is represented as follows:
a non-significant,
b P<0.05,
c P<0.01,
d P<0.001,
e Kruskal-Wallis test,
f Chi-square (or their respective non-parametric tests).
| DIAMODIA criteria | Tdia (n=337) | Adia (n=53) | MODY (n=34) |
P value |
|
|---|---|---|---|---|---|
| Tdia vs. Adia | Tdia vs. MODY | ||||
| Strong criteria | |||||
| Absence of anti-islet antibodies, % | 0.6 | 59.4 | 100 | <0.001d | <0.001d |
| IDAA1c <9, % | 0.6 | 23.5 | 80.0 | <0.001d | <0.001d |
| GTAA1c <4.5, % | 0.9 | 28.6 | 81.5 | <0.001d | <0.001d |
| Age at diagnosis <6 months, % | 0 | 0 | 8.8 | NA | <0.001d |
| Weak criteria | |||||
| First-degree relative with diabetes, % | 41.0 | 56.8 | 85.3 | 0.02b | <0.001d |
| C-peptide secretion positive, % | 23.9 | 59.4 | 90.6 | <0.001d | <0.001d |
| Extra-pancreatic manifestations, % | 8.5 | 13.3 | 38.7 | 0.27a | 0.002c |
| Absence of ketoacidosis at diagnosis, % | 61.8 | 71.6 | 87.9 | 0.14a | 0.001d |
| History of neonatal hypoglycemia, % | 2.9 | 3.9 | 25.9 | 0.69a | <0.001d |
Percentages may not total 100 due to rounding. Differences between the three groups were considered as significant when P value was under 0.05. All P values have been calculated using the chi-square test (or their respective non-parametric tests).
DIAMODIA, DIAgnose MOnogenic DIAbetes; Tdia, cohort of type 1 diabetes mellitus patients; Adia, cohort of patients with atypical diabetes; MODY, maturity-onset diabetes of the young; IDAA1c, insulin-dose adjusted A1c; GTAA1c, glycemic target-adjusted A1c; NA, not applicable.
The level of significance is represented as follows:
a non-significant,
b P<0.05,
c P<0.01,
d P<0.001.
- 1. American Diabetes Association Professional Practice Committee. 2. Classification and diagnosis of diabetes: standards of medical care in diabetes-2022. Diabetes Care 2022;45(Suppl 1):S17-38.ArticlePubMedPDF
- 2. Watkins RA, Evans-Molina C, Blum JS, DiMeglio LA. Established and emerging biomarkers for the prediction of type 1 diabetes: a systematic review. Transl Res 2014;164:110-21.ArticlePubMedPMC
- 3. Ahlqvist E, Storm P, Karajamaki A, Martinell M, Dorkhan M, Carlsson A, et al. Novel subgroups of adult-onset diabetes and their association with outcomes: a data-driven cluster analysis of six variables. Lancet Diabetes Endocrinol 2018;6:361-9.ArticlePubMed
- 4. Møller AM, Dalgaard LT, Pociot F, Nerup J, Hansen T, Pedersen O. Mutations in the hepatocyte nuclear factor-1alpha gene in Caucasian families originally classified as having type I diabetes. Diabetologia 1998;41:1528-31.ArticlePubMedPDF
- 5. Lambert AP, Ellard S, Allen LI, Gallen IW, Gillespie KM, Bingley PJ, et al. Identifying hepatic nuclear factor 1alpha mutations in children and young adults with a clinical diagnosis of type 1 diabetes. Diabetes Care 2003;26:333-7.PubMed
- 6. Awa WL, Schober E, Wiegand S, Herwig J, Meissner T, Schmidt F, et al. Reclassification of diabetes type in pediatric patients initially classified as type 2 diabetes mellitus: 15 years follow-up using routine data from the German/Austrian DPV database. Diabetes Res Clin Pract 2011;94:463-7.ArticlePubMed
- 7. Kleinberger JW, Copeland KC, Gandica RG, Haymond MW, Levitsky LL, Linder B, et al. Monogenic diabetes in overweight and obese youth diagnosed with type 2 diabetes: the TODAY clinical trial. Genet Med 2018;20:583-90.ArticlePubMedPDF
- 8. Kleinberger JW, Pollin TI. Undiagnosed MODY: time for action. Curr Diab Rep 2015;15:110.ArticlePubMedPMCPDF
- 9. Shields BM, Hicks S, Shepherd MH, Colclough K, Hattersley AT, Ellard S. Maturity-onset diabetes of the young (MODY): how many cases are we missing? Diabetologia 2010;53:2504-8.ArticlePubMedPDF
- 10. Hattersley AT, Patel KA. Precision diabetes: learning from monogenic diabetes. Diabetologia 2017;60:769-77.ArticlePubMedPMCPDF
- 11. Nkonge KM, Nkonge DK, Nkonge TN. The epidemiology, molecular pathogenesis, diagnosis, and treatment of maturity-onset diabetes of the young (MODY). Clin Diabetes Endocrinol 2020;6:20.ArticlePubMedPMCPDF
- 12. Shields BM, McDonald TJ, Ellard S, Campbell MJ, Hyde C, Hattersley AT. The development and validation of a clinical prediction model to determine the probability of MODY in patients with young-onset diabetes. Diabetologia 2012;55:1265-72.ArticlePubMedPMC
- 13. Harris PA, Taylor R, Minor BL, Elliott V, Fernandez M, O’Neal L, et al. The REDCap consortium: building an international community of software platform partners. J Biomed Inform 2019;95:103208.ArticlePubMedPMC
- 14. Harris PA, Taylor R, Thielke R, Payne J, Gonzalez N, Conde JG. Research electronic data capture (REDCap): a metadata-driven methodology and workflow process for providing translational research informatics support. J Biomed Inform 2009;42:377-81.ArticlePubMed
- 15. Dunger DB, Sperling MA, Acerini CL, Bohn DJ, Daneman D, Danne TP, et al. European Society for Paediatric Endocrinology/Lawson Wilkins Pediatric Endocrine Society consensus statement on diabetic ketoacidosis in children and adolescents. Pediatrics 2004;113:e133-40.ArticlePubMedPDF
- 16. Roelants M, Hauspie R, Hoppenbrouwers K. References for growth and pubertal development from birth to 21 years in Flanders, Belgium. Ann Hum Biol 2009;36:680-94.ArticlePubMed
- 17. Cole TJ, Bellizzi MC, Flegal KM, Dietz WH. Establishing a standard definition for child overweight and obesity worldwide: international survey. BMJ 2000;320:1240-3.ArticlePubMedPMC
- 18. Mortensen HB, Hougaard P, Swift P, Hansen L, Holl RW, Hoey H, et al. New definition for the partial remission period in children and adolescents with type 1 diabetes. Diabetes Care 2009;32:1384-90.ArticlePubMedPMCPDF
- 19. Nielens N, Polle O, Robert A, Lysy PA. Integration of routine parameters of glycemic variability in a simple screening method for partial remission in children with type 1 diabetes. J Diabetes Res 2018;2018:5936360.ArticlePubMedPMCPDF
- 20. R Core Team. R: a language and environment for statistical computing. Vienna: R Foundation for Statistical Computing; 2013.
- 21. Le S, Josse J, Husson F. FactoMineR: an R package for multivariate analysis. J Stat Softw 2008;25:1-18.
- 22. Liaw A, Wiener M. Classification and regression by randomForest. R News 2002;2:18-22.
- 23. Friedman J, Hastie T, Tibshirani R. Regularization paths for generalized linear models via coordinate descent. J Stat Softw 2010;33:1-22.ArticlePubMedPMC
- 24. Kowarik A, Templ M. Imputation with the R package VIM. J Stat Softw 2016;74:1-16.
- 25. Libman I, Haynes A, Lyons S, Pradeep P, Rwagasor E, Tung JY, et al. ISPAD Clinical Practice Consensus Guidelines 2022: definition, epidemiology, and classification of diabetes in children and adolescents. Pediatr Diabetes 2022;23:1160-74.PubMed
- 26. Besser RE, Bell KJ, Couper JJ, Ziegler AG, Wherrett DK, Knip M, et al. ISPAD Clinical Practice Consensus Guidelines 2022: stages of type 1 diabetes in children and adolescents. Pediatr Diabetes 2022;23:1175-87.PubMed
- 27. Greeley SA, Polak M, Njolstad PR, Barbetti F, Williams R, Castano L, et al. ISPAD Clinical Practice Consensus Guidelines 2022: the diagnosis and management of monogenic diabetes in children and adolescents. Pediatr Diabetes 2022;23:1188-211.ArticlePubMedPMCPDF
- 28. Fu J, Ping F, Wang T, Liu Y, Wang X, Yu J, et al. A clinical prediction model to distinguish maturity-onset diabetes of the young from type 1 and type 2 diabetes in the Chinese population. Endocr Pract 2021;27:776-82.ArticlePubMed
- 29. McDonald TJ, Colclough K, Brown R, Shields B, Shepherd M, Bingley P, et al. Islet autoantibodies can discriminate maturity-onset diabetes of the young (MODY) from type 1 diabetes. Diabet Med 2011;28:1028-33.ArticlePubMed
- 30. Carrera P, Marzinotto I, Bonfanti R, Massimino L, Calzavara S, Favellato Μ, et al. Genetic determinants of type 1 diabetes in individuals with weak evidence of islet autoimmunity at disease onset. Diabetologia 2023;66:695-708.ArticlePubMedPDF
 PubReader
 ePub Link
 Cite
Cite