
- Current
- Browse
- Collections
-
For contributors
- For Authors
- Instructions to authors
- Article processing charge
- e-submission
- For Reviewers
- Instructions for reviewers
- How to become a reviewer
- Best reviewers
- For Readers
- Readership
- Subscription
- Permission guidelines
- About
- Editorial policy
Articles
- Page Path
- HOME > Diabetes Metab J > Ahead-of print > Article
-
Original ArticleComplications Does the Relationship of the Autonomic Symptoms Questionnaire COMPASS 31 with Cardiovascular Autonomic Tests Differ between Type 1 and Type 2 Diabetes Mellitus?
-
Ilenia D’Ippolito
 , Marika Menduni, Cinzia D’Amato, Aikaterini Andreadi, Davide Lauro, Vincenza Spallone
 -
DOI: https://doi.org/10.4093/dmj.2023.0301
Published online: February 26, 2024
- 647 Views
- 47 Download
Endocrinology Section, Department of Systems Medicine, University of Rome Tor Vergata, Rome, Italy
- Corresponding author: Vincenza Spallone Endocrinology Section, Department of Systems Medicine, University of Rome Tor Vergata, Via Montpellier, 1, Rome 00133, Italy E-mail: vincenza.spallone@uniroma2.it
Copyright © 2024 Korean Diabetes Association
This is an Open Access article distributed under the terms of the Creative Commons Attribution Non-Commercial License (http://creativecommons.org/licenses/by-nc/4.0/) which permits unrestricted non-commercial use, distribution, and reproduction in any medium, provided the original work is properly cited.
ABSTRACT
-
Background
- The aim was to investigate if autonomic symptoms questionnaire Composite Autonomic Symptom Score (COMPASS) 31 has different association with cardiovascular autonomic neuropathy (CAN) and diagnostic performance between type 1 diabetes mellitus (T1DM) and type 2 diabetes mellitus (T2DM).
-
Methods
- Seventy-nine participants with T1DM and 140 with T2DM completed COMPASS 31 before cardiovascular reflex tests (CARTs) for CAN, and assessment of symptoms, signs, vibration, and thermal perception thresholds for diabetic polyneuropathy (DPN) diagnosis.
-
Results
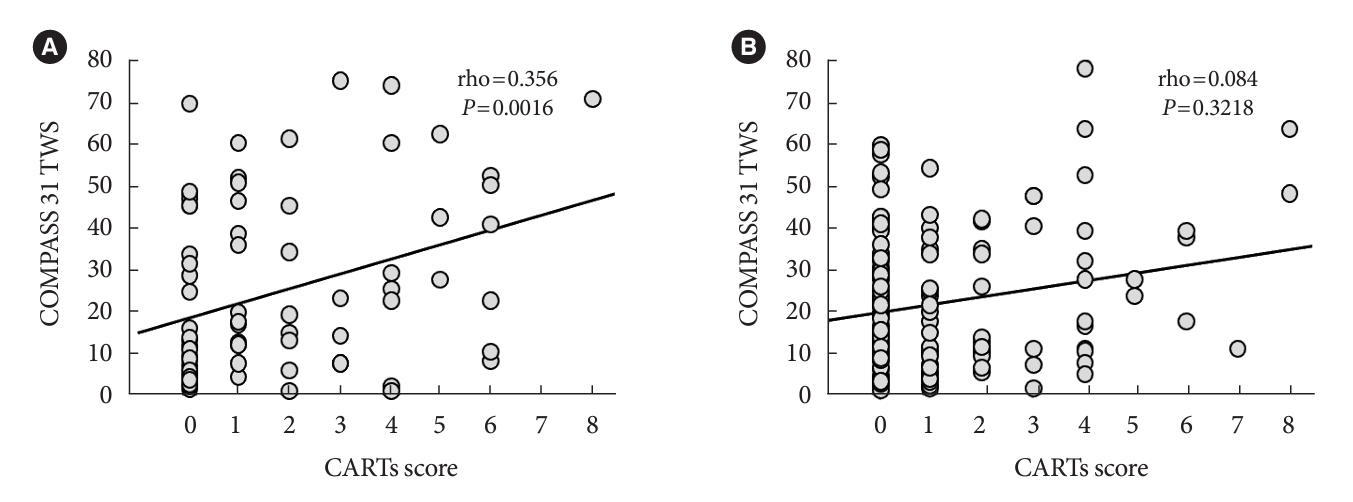
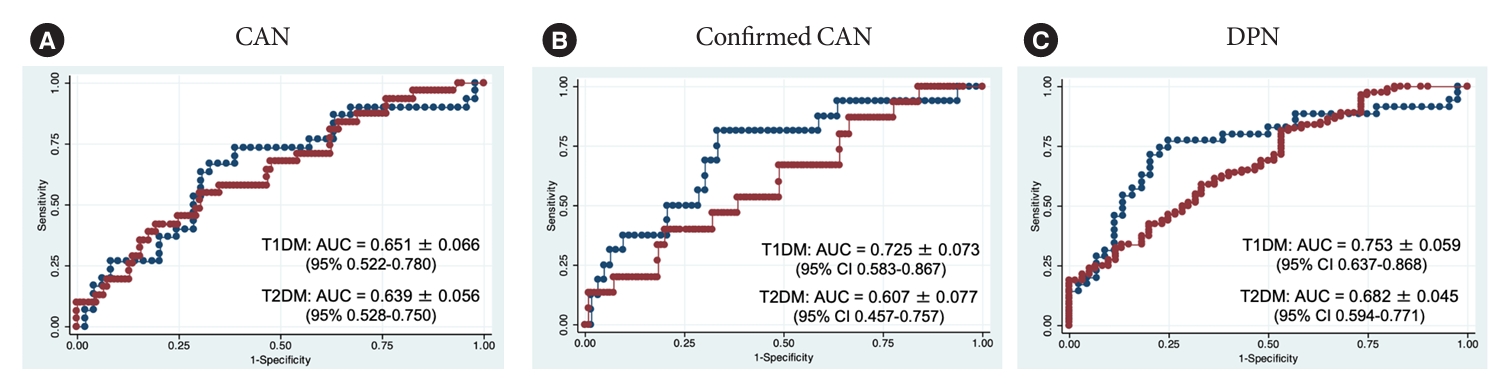
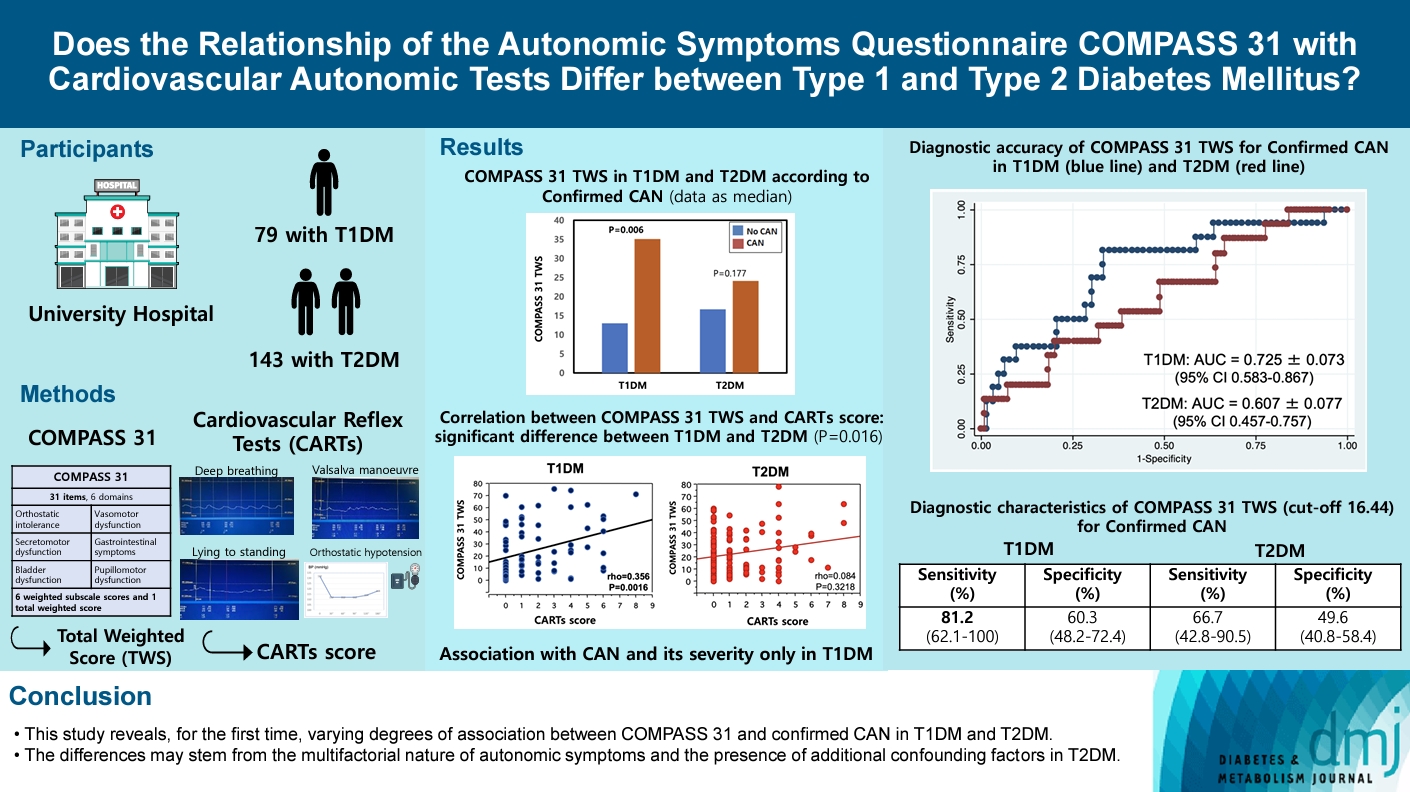
- COMPASS 31 total weighted score (TWS) was similar in the two groups, but significantly associated with confirmed CAN only in T1DM (P=0.0056) and not T2DM group (P=0.1768) and correlated with CARTs score more strongly in T1DM (rho=0.356, P=0.0016) than in T2DM group (rho=0.084, P=0.3218) (P=0.016). Only in T1DM and not T2DM group, the area under the receiver operating characteristic curve (AUC) reached a fair diagnostic accuracy (>0.7) for confirmed CAN (0.73±0.07 vs. 0.61±0.08) and DPN (0.75±0.06 vs. 0.68±0.05), although without a significant difference. COMPASS 31 TWS (cut-off 16.44) reached acceptable diagnostic performance in T1DM, with sensitivity for confirmed CAN 81.2% and sensitivity and specificity for DPN 76.3% and 78%, compared to T2DM group (all <70%). AUC for DPN of orthostatic intolerance domain was higher in T1DM compared to T2DM group (0.73±0.05 vs. 0.58±0.04, P=0.027).
-
Conclusion
- COMPASS 31 is more weakly related to CAN in T2DM than in T1DM, with a fair diagnostic accuracy for confirmed CAN only in T1DM. This difference supports a multifactorial origin of symptoms and should be considered when using COMPASS 31.
- • COMPASS 31 is a validated questionnaire for assessing autonomic symptoms in DM.
- • We compared the diagnostic accuracy of COMPASS 31 between T1DM and T2DM.
- • The association of COMPASS 31 with autonomic deficits was weaker in T2DM than T1DM.
- • Fair diagnostic accuracy for confirmed CAN was only achieved in T1DM.
- • The potential multifactorial origin of symptoms should be considered in T2DM.
Highlights
- Given their epidemiological impact [1,2], and influence on morbidity and quality of life [3], guidelines recommend looking for autonomic symptoms in any patient with diabetes [4-6], while recognizing their low specificity and limited diagnostic accuracy [7].
- To provide a systematic and quantitative assessment of autonomic symptoms the Autonomic Symptom Profile [8], and recently, easy-to-use questionnaires were developed like the Survey of Autonomic Symptoms (SAS) [9,10] and Composite Autonomic Symptom Score (COMPASS) 31 [11]. This latter, a simplified version of COMPASS [11] has 31 items in six domains (i.e., orthostatic intolerance, gastrointestinal symptoms, secretomotor, vasomotor, bladder, and pupillomotor dysfunction) and has been translated in many languages, including Italian [12-16], and validated for diabetic cardiovascular autonomic neuropathy (CAN) with a sensitivity of 75% and a specificity of 65% when using as cut-off of total weighted score (TWS) of 16 [17]. Afterward other studies found a sensitivity between 65% and 75% and a specificity between 56% and 83% for confirmed CAN at cut-off values between 15 and 19 [18-21].
- This study starts from the lack of any comparison between type 1 diabetes mellitus (T1DM) and type 2 diabetes mellitus (T2DM), and from the suggestion that autonomic symptoms might be more weakly associated with autonomic deficits in T2DM than in T1DM as documented for overall autonomic symptoms and for [22] orthostatic symptoms when related to systolic blood pressure (BP) fall on standing [23]. Thus, the objective of our work was to answer the question if autonomic symptoms measured using COMPASS 31 are more weakly associated with autonomic deficits in T2DM than in T1DM and therefore to evaluate if the diagnostic performance of COMPASS 31 for CAN differs between diabetes types. As a secondary aim, the diagnostic performance of COMPASS 31 for diabetic polyneuropathy (DPN) was assessed.
INTRODUCTION
- Patients with diabetes were prospectively recruited between October 2013 to November 2019, among the outpatients who underwent routine screening for diabetic neuropathy at the secondary care diabetes clinic of the University Hospital of Tor Vergata, Rome, Italy.
- Inclusion criteria were the diagnosis of T1DM or T2DM, diabetes duration of at least 5 years for T1DM, and age 18 to 80 years. Exclusion criteria were severe comorbidities as recent cardiovascular events, heart failure, estimated glomerular filtration rate (eGFR) <45 mL/min/1.73 m2, peripheral or autonomic neuropathies from other causes than diabetes, advanced peripheral arterial disease, active limb ulcers, major amputations, psychiatric disorders, and conditions preventing questionnaires understanding.
- The study was performed in accordance with the ethical standards of the Declaration of Helsinki as revised in 2013 and was approved by the Ethics Committee of the University Hospital of Rome Tor Vergata (approval no. 92/18). All participants gave their written informed consent prior to inclusion in the study.
- As a first step, participants were requested to complete COMPASS 31 in its Italian version before undergoing the other examinations. Operators were blinded to the COMPASS 31 results. Clinical history and smoking, drinking habits, and physical activity were recorded. Anthropometric, clinical, and metabolic parameters were measured, as well as casual BP. Diabetic chronic kidney disease (CKD) diagnosis was based on the presence of micro- and macroalbuminuria and/or the presence of reduced eGFR (using Chronic Kidney Disease Epidemiology Collaboration system) (<60 mL/min/1.73 m2). and considered present with the stages of A1G3a, A2G1–G2, A2G3a, A3G1–G2, A3G3a [24,25]. Diabetic retinopathy diagnosis was based on a dilated and comprehensive eye examination by an ophthalmologist. Peripheral vascular disease was assessed by clinical criteria, and coronary and/or cerebrovascular events by history and medical record.
- Neurological examination was performed in a quiet room through the assessment of neuropathic symptoms and signs using the Michigan Neuropathy Screening Instrument Questionnaire (MNSI-Q), and the Michigan Diabetic Neuropathy Score (MDNS) [26]. Quantitative sensory testing measured the vibration perception threshold (VPT) at the hallux dorsum and at the lateral malleolus according to the limits method, and the warm thermal perception threshold (WTT) and cold thermal perception threshold (CTT) at the dorsum of feet according to the levels method by using TSA-II Neurosensory Analyzer (Medoc, Ramat Yishai, Israel). DPN was defined with the degree of certainty of probable DPN in the presence of at least two abnormalities among neuropathic symptoms, signs, VPT, or thermal thresholds [4,27]. The presence of neuropathic pain was evaluated using the validated questionnaire Douleur Neuropathique en 4 questions (DN4) [28].
- Autonomic function was measured using four cardiovascular reflex tests (CARTs), that is, heart rate response to deep breathing, lying to standing, and Valsalva maneuver to obtain expiration: inspiration ratio, 30:15 ratio and Valsalva ratio, and the orthostatic hypotension test [4,5]. The computerized system for data acquisition and analysis DAN test (Microlab Elettronica Sas, Padua, Italy), standard procedures and age-related reference values were used [7]. A CARTs score was obtained from the sum of scores given to each CART (0 for a normal, 1 for a borderline, and 2 for an abnormal result, range 0 to 8) [7]. Early and confirmed CAN were defined according to the presence of at least one abnormal and two abnormal tests, respectively [4,5,7].
- COMPASS 31 questionnaire was analyzed to get the six domain weighted scores and the TWS and we considered a value of TWS greater than 16.44 as abnormal [11,17].
- Statistical analysis
- According to a power of 0.90 and a significance level alpha of 0.05 (two-sided), we calculated the optimal sample size for the primary outcome of COMPASS 31 TWS considering the smallest effect of clinical interest (standardized difference) from the means and standard deviation (SD) observed in groups with and without CAN in previous studies [17,21]. The maximum estimate was 33 subjects in each group with and without CAN in both types of diabetes. Moreover, we calculated the sample size according to the expected prevalence of CAN, i.e., 20% [5] and obtained a value of 16 subjects in each group with and without CAN in the T1DM and T2DM groups. Finally, we considered as the effect of interest a difference of 0.25 between the area under the receiver operating characteristic (ROC) curve (AUC) of COMPASS 31 TWS for confirmed CAN in T1DM and T2DM groups and obtained an estimate of 80 for each of T1DM and T2DM groups.
- Data distribution was evaluated using the Shapiro-Wilk W-test of normality and provided as mean±SD or median and interquartile range based on distribution. Descriptive statistics to characterize clinical variables, unpaired Student’s t-test, analysis of variance (ANOVA) test, Mann-Whitney U-test and Kruskal-Wallis test as tests of significance for means, and the chi-square test for categorical variables were used. Bonferroni correction and Dunn’s test were used in order to account for multiple comparisons. Spearman coefficient correlations for non-normally distributed variables evaluated the reciprocal relationships (being rho corrected for ties applied)
- The diagnostic accuracy of the COMPASS 31 TWS in distinguishing between patients with and without CAN was assessed using AUC, and a comparison between the AUCs was done through the test of equality of ROC areas (roccomp). The sensitivity, specificity, positive and negative predictive value, and the Youden’s J index (J=sensitivity+specificity–1) were calculated through the chi-square test, including two-sided 95% confidence intervals. The StatView IV program (SAS Institute Inc., Cary, NC, USA) and Statistics/Data Analysis (STATA) (StataCorp., College Station, TX, USA) were used. A two-tailed value of P<0.05 was considered significant. Fisher’s exact P value was considered for chi-square test.
METHODS
- According to selection criteria, 79 patients with T1DM and 140 with T2DM were included. CAN (early and confirmed) was present in 36.7% of participants with T1DM and in 22.1% of those with T2DM (P=0.0269), while confirmed CAN was present in 20.3% and 10.7%, respectively. DPN was present in 48.1% and 57.9% of participants with T1DM and T2DM, respectively. Table 1 describes their clinical characteristics and the differences between the groups. Supplementary Tables 1 and 2 show in detail the characteristics of T1DM and T2DM groups according to their CAN state (no, early, and confirmed CAN).
- There were 10 participants with proliferative retinopathy in the T1DM group and nine in the T2DM group who did not perform Valsalva maneuver. The lack of one out of four CARTs in this subset might have underestimated the diagnosis of CAN.
- COMPASS 31 according to CAN and DPN
- The weighted scores of the single domains and the TWS of COMPASS 31 did not significantly differ between the T1DM and T2DM groups (Supplementary Table 3). In both types of diabetes, participants with CAN (early and confirmed) compared to those without CAN showed significantly higher TWS and weighted score of gastrointestinal domain, while only those with T1DM and CAN had significantly higher weighted score of bladder domain. On the other hand, only in T1DM and not in T2DM participants with confirmed CAN compared to those without had higher TWS and weighted score of orthostatic intolerance, gastrointestinal and bladder symptoms (Table 2). When considering DPN, in both groups, participants with DPN showed significantly higher TWS and weighted scores of almost all domains (Table 2).
- In T1DM group COMPASS 31 TWS was correlated to the CARTs score, expiration:inspiration ratio, 30:15 ratio and orthostatic systolic BP fall, whereas in T2DM group only a correlation with the Valsalva ratio was observed (Table 3). When splitting the T1DM and T2DM groups into three subgroups with early CAN, confirmed CAN and without CAN, the only significant correlations still present were those of COMPASS 31 TWS with CARTs score (P=0.009) and with expiration: inspiration ratio (P=0.039) in the group with T1DM and confirmed CAN (Supplementary Table 4). Regarding DPN, COMPASS 31 TWS was related to all DPN measures in T1DM and only to MNSI-Q, MDNS, and DN4 in T2DM (Table 3). A comparison analysis of the Spearman’s rho showed a significant difference between T1DM and T2DM groups for the correlations of COMPASS TWS with CARTs score (P=0.016) (Fig. 1) and with VPT (P=0.038).
- COMPASS 31 diagnostic performance
- COMPASS 31 TWS showed a fair diagnostic accuracy (AUC >0.7), for confirmed CAN (AUC 0.725±0.073) and DPN (AUC 0.753±0.059) only in T1DM. The values of AUC for CAN (early and confirmed) were similar between the two groups but those for confirmed CAN and DPN slightly differ in the group with T2DM diabetes compared to T1DM (Table 4, Fig. 2), and did not exceed the value of 0.7, in T2DM although a statistical significance difference between T1DM and T2DM was not reached (confirmed CAN: chi-square=1.26, P=0.262; DPN: chi-square=0.90, P=0.343).
- When considering the diagnostic characteristics of COMPASS 31 TWS (at the cut-off of 16.44) the best values over 70% were that of sensitivity for confirmed CAN and those of sensitivity and specificity for DPN but only in T1DM (Table 4). This was also strengthened by the Youden’s indexes with the greatest values for DPN (0.54) and confirmed CAN (0.41) in T1DM compared to T2DM group (0.23 and 0.16).
- When considering the AUCs of the single domains of COMPASS 31, the best performance was that of the orthostatic intolerance and gastrointestinal domains for confirmed CAN and of orthostatic and pupillometer domains for DPN in T1DM and of secretomotor and gastrointestinal domains for DPN in T2DM (Supplementary Table 5). AUC of orthostatic intolerance domain in discriminating the presence of DPN was significantly higher in T1DM group (P=0.0268) (Supplementary Fig. 1). The Supplementary Table 6 shows in comparison the diagnostic accuracy for confirmed CAN and DPN of COMPASS 31 TWS, CARTs score and VPN.
RESULTS
- The relationship between the autonomic symptoms and the objective measures of autonomic function was found of different degree in T1DM and T2DM [22,23,29] with a limited association if any in T2DM [30]. Thus, this study aimed at investigating if COMPASS 31 has different association with CARTs and different diagnostic performance for the presence of CAN in T1DM and T2DM.
- Association between COMPASS 31 and CAN
- The study found that COMPASS 31 total and domain scores did not differ between the T1DM and T2DM group, suggesting a similar presence and intensity of autonomic symptoms (Supplementary Table 3). As expected, COMPASS 31 scores were significantly higher in presence of CAN but this association was stronger and wider in T1DM than in T2DM group (Table 2). The same was true for the correlations between COMPASS 31 TWS and CARTs with a significantly greater correlation in T1DM than in T2DM group (Table 3, Fig. 1). Thus, despite some different clinical characteristics, the participants with T1DM and T2DM reported a similar distribution and degree of autonomic symptoms, but the association of the scores of COMPASS 31 with the presence and severity of CAN seemed to be stronger in those with T1DM, reaching in this latter group values of significance not observed with other questionnaires [22,31]. No association at all was found between COMPASS 31 TWS and confirmed CAN in the group with T2DM.
- Diagnostic performance of COMPASS 31 for CAN
- When considering the diagnostic value of COMPASS 31 TWS for CAN in T1DM and T2DM, a similar diagnostic accuracy was found for overall CAN with AUC around 0.65 for both types and comparable sensitivity (65.5% and 67.7%). However, the diagnostic accuracy of COMPASS 31 TWS for confirmed CAN reached a level of fair accuracy only in T1DM with AUC of 0.72 compared to 0.61 in T2DM group (although without a statistical significance) (Fig. 2) together with a higher sensitivity (81.2% compared to 67.7% in T2DM group) (Table 4). Moreover, if in T1DM, the scores of orthostatic intolerance, gastrointestinal and bladder symptoms reached an almost fair diagnostic accuracy for confirmed CAN (AUC ≥0.65), this was not true in T2DM (Supplementary Table 5).
- Possible explanations of the weaker link between autonomic symptoms and CAN in T2DM
- We used ANOVA analysis to test possible effect modification of diabetes type on the relation between COMPASS 31 TWS and confirmed CAN or DPN. We found that diabetes type had no significant effect modification on the variance of COMPASS 31 TWS according to confirmed CAN (P=0.167) and instead a significant effect on the variance of COMPASS 31 TWS according to the presence of DPN (P=0.044).
- The two groups with T1DM and T2DM were not matched. Some differences were expected according to the epidemiological characteristics of T1DM and T2DM, as age, duration, body mass index (BMI), lipids, BP, eGFR, and percentage of hypertension and cardiovascular disease. Other differences are a limitation of this study as the percentage of females, considered below. To verify the role of those variables that differed between T1DM and T2DM (Table 1), we performed an exploratory analysis to assess if the participants with an abnormal COMPASS 31 TWS (>16.44) compared to those with normal TWS showed association with female sex, retinopathy, hypertension, cardiovascular disease, or with higher age, duration, BMI, glycosylated hemoglobin (HbA1c), triglycerides, eGFR, and casual BP or lower values of high-density lipoprotein. No significant difference was found for any variable. Thus, the impact of different characteristics appears of limited value. Moreover, in a multivariate logistic regression analysis with confirmed CAN as the dependent variable and COMPASS 31 TWS plus the variables related to confirmed CAN in univariate analysis (i.e., BMI and cardiovascular disease in T1DM, diabetes duration, HbA1c and triglycerides in T2DM, and systolic BP, retinopathy, CKD, and peripheral vascular disease in both groups), COMPASS TWS was a significant determinant of confirmed CAN (P=0.003), together with BMI and systolic BP (both P<0.05), in T1DM but not in T2DM group where only retinopathy kept a predictive value for confirmed CAN (P=0.002). This supported the weaker link of COMPASS 31 with confirmed CAN in T2DM, however, without elucidating the role of clinical differences of two diabetic populations.
- The different association between COMPASS 31 and CAN in T1DM and T2DM cannot be attributed to a less appearance of autonomic symptoms in T2DM, confirming previous observations [22].
- In patients referred for autonomic testing medications with known effect on autonomic nervous system seemed to exert a confounding effect on COMPASS 31 results mainly for the orthostatic intolerance and secretomotor domains [32]. Thus, we conducted an exploratory analysis to investigate the role of drugs potentially affecting autonomic nervous system (such as diuretics, alpha-blockers, β-blockers, and psychoactive drugs) without finding any association apart from the bladder domain in only the T2DM group (P=0.008). However, given that a greater percentage of patients in T2DM group were taking these drugs (46% vs. 25.3%, chi-square=9.48, P=0.002) we cannot exclude that this fact partially accounts for the observed disparities between T2DM and T1DM. On the other hand, we have not found differences in median values of COMPASS 31 results, including gastrointestinal and bladder domains, among those under treatment with incretins (n=29) or gliflozins (n=8) compared to other treatments.
- Among healthy partners and caregivers of patients with multiple sclerosis, with a mean age of 40.6 years, 99% and 85.3% had a score >0 in at least one or two COMPASS 31 domains, and their median value of COMPASS 31 TWS was 10.2 [33]. This was attributed to distress and over-sensitization to health problems, and to a possible role of anxiety or other confounders on the highly sensitive gastrointestinal domain [33]. Moreover, veterans with the Gulf War Illness reported elevated COMPASS 31 scores that were associated with the presence of anxiety [34]. In patients with multiple system atrophy, depressive symptoms were associated with an increased self-perceived severity of autonomic symptoms, mainly orthostatic hypotension [35]. Gastrointestinal symptoms have been found indeed related to anxiety and depression in people with diabetes [36]. In a large T1DM population, the presence of autonomic symptoms assessed with SAS questionnaire was associated with depression in addition to female sex, low income, and opioid use [31]. Unfortunately, we did not assess anxiety or depression in this study and we cannot exclude that psychological factors may affect the perception of autonomic symptoms and be more common in T2DM participants.
- There is some evidence of poor relationship of gastrointestinal and orthostatic symptoms with the correspondent functional abnormalities [37]. Most patients with orthostatic hypotension were asymptomatic or mildly symptomatic and there was no cut-off of BP fall for symptoms and instead a poor relationship with the orthostatic BP fall or the upright orthostatic BP [38]. Orthostatic intolerance symptoms might be influenced by the individual variability of the autoregulated range of cerebral blood flow, the expansion of this range under 50 mm Hg or by a failure of autoregulation [39]. It might be possible that multifactorial causative mechanisms underlying the orthostatic symptoms are more prominent in T2DM than in T1DM [23].
- In summary, more confounding factors might be present in patients with T2DM related to quality of life, mood aspects, comorbidities, and drugs interference. Ad hoc studies are needed to disentangle all the factors involved.
- Diagnostic performance of COMPASS 31 for DPN
- As previously described [17], COMPASS 31 TWS was also increased in the presence of DPN and related to DPN measures. This study shows that the link between COMPASS 31 results and DPN is almost of similar degree for both diabetes types with a stronger relation with DPN than with CAN in T2DM group (Tables 2 and 3). The values of AUC (0.75 in T1DM and 0.68 in T2DM group), sensitivity and specificity were slightly higher in T1DM group (76.3% and 78% vs. 61.7% and 61%) (Table 4) but without statistical significance. For the orthostatic intolerance domain, a significant superiority of AUC was reached in the T1DM group compared to T2DM group (Supplementary Fig. 1).
- The fair relation between DPN and its measures with COMPASS 31 in both diabetes types might indicate that some symptoms explored in COMPASS 31 refer to peripheral small fibre functions not well represented by CARTs and closer to DPN manifestations. Moreover, the very strict correlation between DN4 and COMPASS 31 TWS might indicate that perhaps pain-related mood and quality of life consequences might increase the subjective perception of autonomic symptoms.
- Strengths and limitations
- This the first study that compares the diagnostic accuracy and performance of COMPASS 31 between T1DM and T2DM and also the study on COMPASS 31 with the largest population with diabetes. Moreover, diabetic population was well characterized, and CAN diagnosis was based on the gold standard of CARTs. The absence of a control non-diabetic group is a limitation of this study, preventing to define the reference values of COMPASS 31 in a healthy population. However, other studies have validated COMPASS 31 using the same Italian version [12], and the aim of this observational study was to compare participants with T1DM and T2DM.
- The studied population is representative of patients followed at diabetes centers in Italy according to a recent large survey in T2DM [40] but could not be representative of the general population with diabetes. In this study the percentage of CAN in T2DM was lower than expected also compared to T1DM group. The use of strict selection criteria with the exclusion of severe comorbidities, as a CKD stage ≥G3b, and the use of age-related reference values for CARTs might have played a role. This finding, however, is not unusual, because the few studies comparing T1DM and T2DM have provided higher prevalence in both T1DM [1,41,42] and T2DM [22,43]. Thus, the prevalence of CAN in this study was not dissimilar from that observed in previous studies comparing T1DM and T2DM, with median values of 23% and 22% for T1DM and T2DM.
- On the other hand, DPN prevalence was rather high in both groups and the use of multiple assessing modalities in addition to the long diabetes duration might have increased the number of DPN diagnoses. There was a different sex composition in the T1DM and T2DM groups, with a greater prevalence of females in T1DM group. Similarly, to what observed by Foschi et al. [33] in healthy females and those with multiple sclerosis, also in the present study females reported higher scores of COMPASS 31. However, higher values of COMPASS 31 TWS were not found in T1DM group compared to T2DM group. More remarkably, we could not find different diagnostic accuracy of COMPASS 31 TWS for CAN, confirmed CAN or DPN between females and males when comparing AUCs of ROC analysis by splitting into groups by sex (P>0.75).
- Finally, we cannot exclude that a larger sample size would have allowed us to find significant differences in the AUCs of COMPASS 31 for confirmed CAN between the two types of diabetes.
- In conclusion, this study confirms the association between COMPASS 31 TWS and the presence of CAN and DPN in both types of diabetes, but with a lesser degree and extent of the associations and relationships between COMPASS 31 and CAN or DPN measures in T2DM than in T1DM. This translates into the fact that values of fair diagnostic accuracy of COMPASS 31 for confirmed CAN are reached only in T1DM and not in T2DM. This should be considered when using this device, without, however, restraining from the necessary assessment and management of autonomic symptoms in people with T2DM.
- The reason for the lack of fair diagnostic performance of COMPASS 31 for CAN in T2DM is not known. A multifactorial origin of autonomic symptoms and the presence of more confounding factors in T2DM might be suggested.
DISCUSSION
The role of different clinical characteristics
Degree of autonomic symptoms
Interfering drugs
Psychological aspects
Variability in symptoms’ perception
SUPPLEMENTARY MATERIALS
Supplementary Table 1.
Supplementary Table 2.
Supplementary Table 3.
Supplementary Table 4.
Supplementary Table 5.
Supplementary Table 6.
Supplementary Fig. 1.
-
CONFLICTS OF INTEREST
No potential conflict of interest relevant to this article was reported.
-
AUTHOR CONTRIBUTIONS
Conception or design: all authors.
Acquisition, analysis, or interpretation of data: I.D., M.M., C.D., V.S.
Drafting the work or revising: V.S.
Final approval of the manuscript: all authors.
-
FUNDING
None
NOTES
-
Acknowledgements
- Thanks to all the people with diabetes who accepted to be part in this study.
| Variable | T1DM (n=79) | T2DM (n=140) | P value |
|---|---|---|---|
| Sex, males:females | 30:49 | 93:47 | <0.0001a |
| Age, yr | 42.0 (33.0–49.8) | 64.0 (57.0–69.0) | <0.0001a |
| Disease duration, yr | 24.0 (16.0–43.0) | 10.0 (5.0–18.5) | <0.0001a |
| BMI, kg/m2 | 24.3 (22.3–26.7) | 28.9 (25.7–32.4) | <0.0001a |
| HbA1c, % | 7.5 (6.8–8.3) | 6.8 (6.2–7.6) | 0.0001a |
| HbA1c, mmol/mol | 58.0 (50.7–67.0) | 51.0 (45.0–59.7) | 0.0001a |
| Total cholesterol, mg/dL | 176.0 (157.0–201.5) | 169.0 (138.5–132.0) | 0.095 |
| LDL cholesterol, mg/dL | 96.1 (77.0–117.0) | 89.4 (67.0–114.0) | 0.365 |
| HDL cholesterol, mg/dL | 60.0 (48.5–70.0) | 44.5 (37.0–55.0) | <0.0001a |
| Triglycerides, mg/dL | 82.0 (59.5–98.5) | 117.0 (92.00–162.5) | <0.0001a |
| With retinopathy, %b | 33 (46.7) | 32 (24.2) | 0.009a |
| With microalbuminuria, %c | 10 (14.1) | 23 (19.0) | 0.433 |
| eGFR, mL/min/1.73 m2 | 96.0 (80.8–111.7) | 84.6 (71.0–99.0) | <0.0001a |
| With chronic kidney disease, %d | 10 (14.7) | 33 (27.2) | 0.070 |
| Casual systolic BP, mm Hg | 121.7±16.9 | 133.1±19.1 | <0.0001a |
| Casual diastolic BP, mm Hg | 71.4±10.8 | 76.8±10.2 | <0.001a |
| With hypertension, % | 31 (39.2) | 107 (76.4) | <0.0001a |
| With cardiovascular disease, % | 9 (11.4) | 34 (24.3) | 0.022a |
| With peripheral vascular disease, %e | 10 (13.2) | 29 (21.2) | 0.195 |
| Alcohol consumption, %f | 15 (19.2) | 30 (21.7) | 0.729 |
| Current smokers, %g | 21 (26.9) | 26 (18.6) | 0.171 |
| Regular physical activity, %h | 26 (33.8) | 52 (37.9) | 0.558 |
| With CAN (early and confirmed) | 29 (36.7) | 31 (22.1) | 0.027a |
| With confirmed CAN | 16 (20.3) | 15 (10.7) | 0.068 |
| With DPN | 38 (48.1) | 81 (57.9) | 0.204 |
Values are presented as median (interquartile range), number (%), or mean±standard deviation. Unpaired Student’s t-test (parametric) and Mann-Whitney U test (non-parametric) as tests of significance for means and the chi-square test for categorical variables were used.
T1DM, type 1 diabetes mellitus; T2DM, type 2 diabetes mellitus; BMI, body mass index; HbA1c, glycosylated hemoglobin; LDL, low-density lipoprotein; HDL, high-density lipoprotein; eGFR, estimated glomerular filtration rate; BP, blood pressure; CAN, cardiovascular autonomic neuropathy; DPN, diabetic polyneuropathy.
a Significant P value, Missing data for
b T2DM patients (n=8),
c T1DM (n=8) and T2DM (n=18) patients,
d T1DM (n=11) and T2DM (n=18) patients,
e T1DM (n=3) and T2DM (n=3) patients,
f T1DM (n=1) and T2DM (n=2) patients,
g T1DM (n=1) patient,
h T1DM (n=2) and T2DM (n=3) patients.
| COMPASS 31 | With CAN | Without CAN | With confirmed CAN | Without confirmed CAN | With DPN | Without DPN | P valuea | P valueb | P valuec |
|---|---|---|---|---|---|---|---|---|---|
| T1DM | |||||||||
| Orthostatic intolerance WS | 12.0 (0–24.0) | 0.0 (0–16.0) | 16.0 (4.0–28.0) | 0.0 (0–16.0) | 16.0 (0–24.0) | 0.0 (0–6.0) | 0.123 | 0.020d | <0.001d |
| Vasomotor WS | 0.0 (0–2.5) | 0.0 (0–1.8) | 0.0 (0–2.5) | 0.0 (0–0) | 0.0 (0–2.5) | 0.0 (0–0) | 0.864 | 0.257 | 0.166 |
| Secretomotor WS | 2.1 (0–8.6) | 2.1 (0–4.3) | 3.2 (1.1–8.6) | 2.1 (0–6.4) | 4.3 (0–8.6) | 0 (0–4.3) | 0.246 | 0.246 | 0.009d |
| Gastrointestinal symptoms WS | 8.0 (4.0–13.4) | 4.5 (1.8–8.0) | 10.3 (5.8–14.3) | 4.5 (1.8–8.4) | 8.5 (2.7–13.3) | 4.5 (1.8–6.5) | 0.010d | 0.009d | <0.001d |
| Bladder WS | 1.1 (0–3.6) | 0 (0–1.1) | 2.2 (0–4.4) | 0.0 (0–1.1) | 1.1 (0–3.3) | 0.0 (0–1.1) | 0.029d | 0.029d | <0.001d |
| Pupillomotor WS | 2.0 (1.0–3.7) | 1.6 (1.0–2.7) | 2.5 (1.0–4.0) | 1.6 (1.0–2.7) | 2.6 (1.3–3.7) | 1.3 (0.7–2.3) | 0.180 | 0.180 | 0.001d |
| Total WS | 25.3 (10.0–50.7) | 12.1 (5.2–34.0) | 35.1 (22.7–56.7) | 13.0 (5.2–34.2) | 34.1 (17.0–50.6) | 8.8 (4.5–42.0) | 0.006d | 0.006d | <0.0001d |
| T2DM | |||||||||
| Orthostatic intolerance WS | 8.0 (0–24.0) | 0.0 (0–16.0) | 0.0 (0–24.0) | 0.0 (0–16.0) | 0.0 (0–20.0) | 0.0 (0–12.0) | 0.084 | 0.819 | 0.159 |
| Vasomotor WS | 0.0 (0–2.3) | 0.0 (0–1.7) | 0.0 (0–3.1) | 0.0 (0–0.4) | 0.0 (0–2.5) | 0.0 (0–0) | 0.661 | 0.307 | 0.005d |
| Secretomotor WS | 4.3 (2.1–6.4) | 4.3 (2.1–6.4) | 4.3 (2.1–6.4) | 4.3 (0–6.4) | 4.3 (2.1–6.4) | 2.1 (0–4.3) | 0.120 | 0.358 | <0.0001d |
| Gastrointestinal symptoms WS | 7.1 (5.3–11.6) | 5.4 (2.4–8.0) | 8.0 (4.0–11.6) | 5.4 (2.7–8.0) | 6.2 (4.5–10.0) | 4.5 (0.9–7.1) | 0.013d | 0.089 | <0.0001d |
| Bladder WS | 1.1 (0–2.2) | 1.1 (0–2.2) | 1.1 (0–2.2) | 1.1 (0–2.2) | 1.1 (0–2.2) | 0.0 (0–1.1) | 0.370 | 0.455 | 0.023d |
| Pupillomotor WS | 2.0 (1.0–2.7) | 1.3 (0.6–2.3) | 2.0 (1.3–2.7) | 1.6 (0.7–2.3) | 2.0 (1.0–3.0) | 1.3 (0.1–2.0) | 0.132 | 0.223 | 0.001d |
| Total WS | 27.7 (11.0–41.6) | 15.4 (8.2–32.3) | 24.1 (11.0–39.7) | 16.7 (8.8–34.0) | 22.8 (10.9–40.0) | 12.0 (4.3–25.9) | 0.018d | 0.177 | <0.001d |
Values are presented as median (interquartile range). Mann-Whitney U test as test of significance was used.
COMPASS, Composite Autonomic Symptom Score; WS, weighted score; T1DM, type 1 diabetes mellitus; T2DM, type 2 diabetes mellitus; CAN, cardiovascular autonomic neuropathy; DPN, diabetic polyneuropathy.
a With vs. without CAN,
b With vs. without confirmed CAN,
c With vs. without DPN,
d Significant P value.
|
CAN |
DPN |
||||||||||
|---|---|---|---|---|---|---|---|---|---|---|---|
| CARTs score | Expiration: inspiration ratio | 30:15 ratio | Valsalva ratio | Orthostatic hypotension | MNSI-Q | MDNS | DN4 | VPT | WTT | CTT | |
| T1DM | |||||||||||
| Rho | 0.356a,b | –0.282b | –0.283b | –0.228 | 0.246b | 0.631b | 0.286b | 0.707b | 0.353b,c | 0.329b | –0.351b |
| P value | 0.0016b | 0.013b | 0.012b | 0.075 | 0.030b | <0.0001b | 0.011b | <0.0001b | 0.002b | 0.006b | 0.003b |
| T2DM | |||||||||||
| Rho | 0.084 | –0.107 | –0.087 | –0.225b | 0.089 | 0.570b | 0.335b | 0.595b | 0.132 | 0.169 | –0.183 |
| P value | 0.322 | 0.210 | 0.303 | 0.017b | 0.298 | <0.0001b | <0.0001b | <0.0001b | 0.151 | 0.073 | 0.052 |
Spearman’s rank correlations coefficients (rho) are presented with P value.
COMPASS, Composite Autonomic Symptom Score; TWS, total weighted score; CAN, cardiovascular autonomic neuropathy; DPN, diabetic polyneuropathy; T1DM, type 1 diabetes mellitus; T2DM, type 2 diabetes mellitus; CART, cardiovascular autonomic reflex test; MNSI-Q, Michigan Neuropathy Screening Instrument Questionnaire; MDNS, Michigan Diabetic Neuropathy Score; DN4, Douleur Neuropathique en 4 questions; VPT, vibration perception threshold; WTT, warm thermal perception threshold; CTT, cold thermal perception threshold.
a P=0.016 between T1DM and T2DM rho,
b Significant P value,
c P=0.038 between T1DM and T2DM rho.
|
T1DM |
T2DM |
|||||||||
|---|---|---|---|---|---|---|---|---|---|---|
| AUC | Sensitivity, % | Specificity, % | PPV, % | NPV, % | AUC | Sensitivity, % | Specificity, % | PPV, % | NPV, % | |
| CAN | 0.651±0.066 | 65.5 (48.2–82.8) | 62.0 (48.5–75.4) | 50.0 (34.1–65.9) | 75.6a (62.5–88.8) | 0.639±0.056 | 67.7 (51.3–84.2) | 52.3 (42.9–61.7) | 28.8 (18.4–39.1) | 85.1a (76.5–93.6) |
| Confirmed CAN | 0.725a ±0.073 | 81.2a (62.1–100) | 60.3 (48.2–72.4) | 34.2 (19.1–49.3) | 92.7a (84.7–100) | 0.607±0.077 | 66.7 (42.8–90.5) | 49.6 (40.8–58.4) | 13.7 (5.8–21.6) | 92.5a (86.2–98.8) |
| DPN | 0.753a ±0.059 | 76.3a (62.8–89.8) | 78.0a (65.4–90.7) | 76.3a (62.8–89.8) | 78.0a (65.4–90.7) | 0.682±0.045 | 61.7 (51.1–72.3) | 61.0 (48.6–73.5) | 68.5 (57.8–79.1) | 53.7 (41.8–65.7) |
Non-parametric receiver operating characteristic (ROC) analysis and chi-square test were used to obtain AUCs (±standard error) and sensitivity, specificity, PPV, and NPV (95% confidence intervals) of COMPASS 31 TWS for the presence of CAN, confirmed CAN, and DPN.
COMPASS, Composite Autonomic Symptom Score; TWS, total weighted score; CAN, cardiovascular autonomic neuropathy; DPN, diabetic polyneuropathy; T1DM, type 1 diabetes mellitus; T2DM, type 2 diabetes mellitus; AUC, area under the receiver operating characteristic curve; PPV, positive predictive value; NPV, negative predictive value.
a ≥0.7% and ≥70%.
- 1. Valensi P, Paries J, Attali JR; French Group for Research and Study of Diabetic Neuropathy. Cardiac autonomic neuropathy in diabetic patients: influence of diabetes duration, obesity, and microangiopathic complications: the French multicenter study. Metabolism 2003;52:815-20.ArticlePubMed
- 2. Chen HT, Lin HD, Won JG, Lee CH, Wu SC, Lin JD, et al. Cardiovascular autonomic neuropathy, autonomic symptoms and diabetic complications in 674 type 2 diabetes. Diabetes Res Clin Pract 2008;82:282-90.ArticlePubMed
- 3. Chyun DA, Melkus GD, Katten DM, Price WJ, Davey JA, Grey N, et al. The association of psychological factors, physical activity, neuropathy, and quality of life in type 2 diabetes. Biol Res Nurs 2006;7:279-88.ArticlePubMedPDF
- 4. Tesfaye S, Boulton AJ, Dyck PJ, Freeman R, Horowitz M, Kempler P, et al. Diabetic neuropathies: update on definitions, diagnostic criteria, estimation of severity, and treatments. Diabetes Care 2010;33:2285-93.ArticlePubMedPMCPDF
- 5. Spallone V, Ziegler D, Freeman R, Bernardi L, Frontoni S, PopBusui R, et al. Cardiovascular autonomic neuropathy in diabetes: clinical impact, assessment, diagnosis, and management. Diabetes Metab Res Rev 2011;27:639-53.ArticlePubMed
- 6. Pop-Busui R, Boulton AJ, Feldman EL, Bril V, Freeman R, Malik RA, et al. Diabetic neuropathy: a position statement by the American Diabetes Association. Diabetes Care 2017;40:136-54.ArticlePubMedPDF
- 7. Spallone V, Bellavere F, Scionti L, Maule S, Quadri R, Bax G, et al. Recommendations for the use of cardiovascular tests in diagnosing diabetic autonomic neuropathy. Nutr Metab Cardiovasc Dis 2011;21:69-78.ArticlePubMed
- 8. Suarez GA, Opfer-Gehrking TL, Offord KP, Atkinson EJ, O’Brien PC, Low PA. The autonomic symptom profile: a new instrument to assess autonomic symptoms. Neurology 1999;52:523-8.ArticlePubMed
- 9. Zilliox L, Peltier AC, Wren PA, Anderson A, Smith AG, Singleton JR, et al. Assessing autonomic dysfunction in early diabetic neuropathy: the survey of autonomic symptoms. Neurology 2011;76:1099-105.ArticlePubMedPMC
- 10. Kim SH, Lee KA, Jin HY, Baek HS, Park TS. Relationship between the Korean version survey of the autonomic symptoms score and cardiac autonomic neuropathy parameters in patients with diabetic peripheral neuropathy. Diabetes Metab J 2014;38:349-55.ArticlePubMedPMC
- 11. Sletten DM, Suarez GA, Low PA, Mandrekar J, Singer W. COMPASS 31: a refined and abbreviated Composite Autonomic Symptom Score. Mayo Clin Proc 2012;87:1196-201.ArticlePubMedPMC
- 12. Pierangeli G, Turrini A, Giannini G, Del Sorbo F, CalandraBuonaura G, Guaraldi P, et al. Translation and linguistic validation of the Composite Autonomic Symptom Score COMPASS 31. Neurol Sci 2015;36:1897-902.ArticlePubMedPDF
- 13. Drulovic J, Gavrilovic A, Crnosija L, Kisic-Tepavcevic D, Krbot Skoric M, Ivanovic J, et al. Validation and cross-cultural adaptation of the COMPASS-31 in Croatian and Serbian patients with multiple sclerosis. Croat Med J 2017;58:342-8.PubMed
- 14. Ahn JH, Seok JM, Park J, Jeong H, Kim Y, Song J, et al. Validation of the Korean version of the composite autonomic symptom scale 31 in patients with Parkinson’s disease. PLoS One 2021;16:e0258897.ArticlePubMedPMC
- 15. Brinth L, Pors K, Mehlsn J, Sletten DM, Terkelsen AJ, Singer W. Translation and linguistic validation of the Composite Autonomic Symptom Score COMPASS 31 in Danish. Dan Med J 2021;69:A07210576.PubMed
- 16. Hilz MJ, Wang R, Singer W. Validation of the Composite Autonomic Symptom Score 31 in the German language. Neurol Sci 2022;43:365-71.ArticlePubMedPDF
- 17. Greco C, Di Gennaro F, D’Amato C, Morganti R, Corradini D, Sun A, et al. Validation of the Composite Autonomic Symptom Score 31 (COMPASS 31) for the assessment of symptoms of autonomic neuropathy in people with diabetes. Diabet Med 2017;34:834-8.ArticlePubMedPDF
- 18. Singh R, Arbaz M, Rai NK, Joshi R. Diagnostic accuracy of composite autonomic symptom scale 31 (COMPASS-31) in early detection of autonomic dysfunction in type 2 diabetes mellitus. Diabetes Metab Syndr Obes 2019;12:1735-42.PubMedPMC
- 19. D’Amato C, Greco C, Lombardo G, Frattina V, Campo M, Cefalo CM, et al. The diagnostic usefulness of the combined COMPASS 31 questionnaire and electrochemical skin conductance for diabetic cardiovascular autonomic neuropathy and diabetic polyneuropathy. J Peripher Nerv Syst 2020;25:44-53.ArticlePubMedPDF
- 20. Peng Y, Liu YS, Wu MY, Chen CN, Li CQ, Jiang AQ, et al. Evaluation of the degree of agreement of four methods for diagnosing diabetic autonomic neuropathy. Front Neurol 2021;12:637099.ArticlePubMedPMC
- 21. Zhang Z, Ma Y, Fu L, Li L, Liu J, Peng H, et al. Combination of Composite Autonomic Symptom Score 31 and heart rate variability for diagnosis of cardiovascular autonomic neuropathy in people with type 2 diabetes. J Diabetes Res 2020;2020:5316769.ArticlePubMedPMCPDF
- 22. Low PA, Benrud-Larson LM, Sletten DM, Opfer-Gehrking TL, Weigand SD, O’Brien PC, et al. Autonomic symptoms and diabetic neuropathy: a population-based study. Diabetes Care 2004;27:2942-7.PubMed
- 23. Spallone V, Morganti R, Fedele T, D’Amato C, Maiello MR. Reappraisal of the diagnostic role of orthostatic hypotension in diabetes. Clin Auton Res 2009;19:58-64.ArticlePubMedPDF
- 24. Kidney Disease: Improving Global Outcomes (KDIGO) Diabetes Work Group. KDIGO 2022 clinical practice guideline for diabetes management in chronic kidney disease. Kidney Int 2022;102(5S):S1-127.ArticlePubMed
- 25. ElSayed NA, Aleppo G, Aroda VR, Bannuru RR, Brown FM, Bruemmer D, et al. 11. Chronic kidney disease and risk management: standards of care in diabetes-2023. Diabetes Care 2023;46(Suppl 1):S191-202.
- 26. Feldman EL, Stevens MJ, Thomas PK, Brown MB, Canal N, Greene DA. A practical two-step quantitative clinical and electrophysiological assessment for the diagnosis and staging of diabetic neuropathy. Diabetes Care 1994;17:1281-9.ArticlePubMedPDF
- 27. Dyck PJ, Albers JW, Andersen H, Arezzo JC, Biessels GJ, Bril V, et al. Diabetic polyneuropathies: update on research definition, diagnostic criteria and estimation of severity. Diabetes Metab Res Rev 2011;27:620-8.ArticlePubMed
- 28. Spallone V, Morganti R, D’Amato C, Greco C, Cacciotti L, Marfia GA. Validation of DN4 as a screening tool for neuropathic pain in painful diabetic polyneuropathy. Diabet Med 2012;29:578-85.ArticlePubMed
- 29. Nilsson H, Bergstrom B, Lilja B, Juul-Moller S, Carlsson J, Sundkvist G. Prospective study of autonomic nerve function in type 1 and type 2 diabetic patients: 24 hour heart rate variation and plasma motilin levels disturbed in parasympathetic neuropathy. Diabet Med 1995;12:1015-21.ArticlePubMed
- 30. Zimmerman M, Pourhamidi K, Rolandsson O, Dahlin LB. Autonomic neuropathy: a prospective cohort study of symptoms and E/I ratio in normal glucose tolerance, impaired glucose tolerance, and type 2 diabetes. Front Neurol 2018;9:154.ArticlePubMedPMC
- 31. Mizokami-Stout K, Bailey R, Ang L, Aleppo G, Levy CJ, Rickels MR, et al. Symptomatic diabetic autonomic neuropathy in type 1 diabetes (T1D): findings from the T1D exchange. J Diabetes Complications 2022;36:108148.ArticlePubMed
- 32. Ruska B, Pavicic T, Pavlovic I, Junakovic A, Adamec I, Crnosija L, et al. Performance of the COMPASS-31 questionnaire with regard to autonomic nervous system testing results and medication use: a prospective study in a real-life setting. Neurol Sci 2018;39:2079-84.ArticlePubMedPDF
- 33. Foschi M, Giannini G, Merli E, Mancinelli L, Zenesini C, Viti B, et al. Frequency and characteristics of dysautonomic symptoms in multiple sclerosis: a cross-sectional double-center study with the validated Italian version of the Composite Autonomic Symptom Score-31. Neurol Sci 2021;42:1395-403.ArticlePubMedPDF
- 34. Fox A, Helmer D, Tseng CL, McCarron K, Satcher S, Osinubi O. Autonomic symptoms in Gulf War Veterans evaluated at the war related illness and injury study center. Mil Med 2019;184:e191-6.Article
- 35. Martinez J, Palma JA, Norcliffe-Kaufmann L, Garakani A, Kaufmann H. Impact of depressive symptoms on self-perceived severity of autonomic dysfunction in multiple system atrophy: relevance for patient-reported outcomes in clinical trials. Clin Auton Res 2020;30:215-21.ArticlePubMedPMCPDF
- 36. de Kort S, Kruimel JW, Sels JP, Arts IC, Schaper NC, Masclee AA. Gastrointestinal symptoms in diabetes mellitus, and their relation to anxiety and depression. Diabetes Res Clin Pract 2012;96:248-55.ArticlePubMed
- 37. Arbogast SD, Alshekhlee A, Hussain Z, McNeeley K, Chelimsky TC. Hypotension unawareness in profound orthostatic hypotension. Am J Med 2009;122:574-80.ArticlePubMed
- 38. Freeman R, Illigens BM, Lapusca R, Campagnolo M, Abuzinadah AR, Bonyhay I, et al. Symptom recognition is impaired in patients with orthostatic hypotension. Hypertension 2020;75:1325-32.ArticlePubMed
- 39. Novak V, Novak P, Spies JM, Low PA. Autoregulation of cerebral blood flow in orthostatic hypotension. Stroke 1998;29:104-11.ArticlePubMed
- 40. Russo G, Di Bartolo P, Candido R, Lucisano G, Manicardi V, Giandalia A, et al. The AMD ANNALS: a continuous initiative for the improvement of type 2 diabetes care. Diabetes Res Clin Pract 2023;199:110672.ArticlePubMed
- 41. Neil HA, Thompson AV, John S, McCarthy ST, Mann JI. Diabetic autonomic neuropathy: the prevalence of impaired heart rate variability in a geographically defined population. Diabet Med 1989;6:20-4.ArticlePubMed
- 42. Motataianu A, Maier S, Bajko Z, Voidazan S, Balasa R, Stoian A. Cardiac autonomic neuropathy in type 1 and type 2 diabetes patients. BMC Neurol 2018;18:126.PubMedPMC
- 43. Ziegler D, Gries FA, Muhlen H, Rathmann W, Spuler M, Lessmann F. Prevalence and clinical correlates of cardiovascular autonomic and peripheral diabetic neuropathy in patients attending diabetes centers. The Diacan Multicenter Study Group. Diabete Metab 1993;19(1 Pt 2):143-51.
 PubReader
 ePub Link
 Cite
Cite


