
- Current
- Browse
- Collections
-
For contributors
- For Authors
- Instructions to authors
- Article processing charge
- e-submission
- For Reviewers
- Instructions for reviewers
- How to become a reviewer
- Best reviewers
- For Readers
- Readership
- Subscription
- Permission guidelines
- About
- Editorial policy
Articles
- Page Path
- HOME > Diabetes Metab J > Volume 47(6); 2023 > Article
-
Original ArticleTechnology/Device Clinical and Lifestyle Determinants of Continuous Glucose Monitoring Metrics in Insulin-Treated Patients with Type 2 Diabetes Mellitus
-
Da Young Lee1*
 , Namho Kim2*, Inha Jung1, So Young Park1, Ji Hee Yu1, Ji A Seo1, Jihee Kim1, Kyeong Jin Kim3, Nam Hoon Kim1, Hye Jin Yoo1, Sin Gon Kim1, Kyung Mook Choi1, Sei Hyun Baik1, Sung-Min Park2,3, Nan Hee Kim1,4
 -
Diabetes & Metabolism Journal 2023;47(6):826-836.
DOI: https://doi.org/10.4093/dmj.2022.0273
Published online: August 24, 2023
1Division of Endocrinology and Metabolism, Department of Internal Medicine, Korea University College of Medicine, Seoul, Korea
2Department of Convergence IT Engineering, Pohang University of Science and Technology, Pohang, Korea
3Department of Electrical Engineering, Pohang University of Science and Technology, Pohang, Korea
4BK21 FOUR R&E Center for Learning Health Systems, Korea University, Seoul, Korea
- Corresponding authors: Nan Hee Kim https://orcid.org/0000-0003-4378-520X Division of Endocrinology and Metabolism, Department of Internal Medicine, Korea University Ansan Hospital, Korea University College of Medicine, 123 Jeokgeum-ro, Danwon-gu, Ansan 15355, Korea E-mail: nhkendo@gmail.com
-
Sung-Min Park Department Convergence IT Engineering, Pohang University of Science and Technology, 77 Cheongam-ro, Nam-gu, Pohang 37673, Korea E-mail: sungminpark@postech.ac.kr
- *Da Young Lee and Namho Kim contributed equally to this study as first authors.
Copyright © 2023 Korean Diabetes Association
This is an Open Access article distributed under the terms of the Creative Commons Attribution Non-Commercial License (http://creativecommons.org/licenses/by-nc/4.0/) which permits unrestricted non-commercial use, distribution, and reproduction in any medium, provided the original work is properly cited.
ABSTRACT
-
Background
- There was limited evidence to evaluate the association between lifestyle habits and continuous glucose monitoring (CGM) metrics. Thus, we aimed to depict the behavioral and metabolic determinants of CGM metrics in insulin-treated patients with type 2 diabetes mellitus (T2DM).
-
Methods
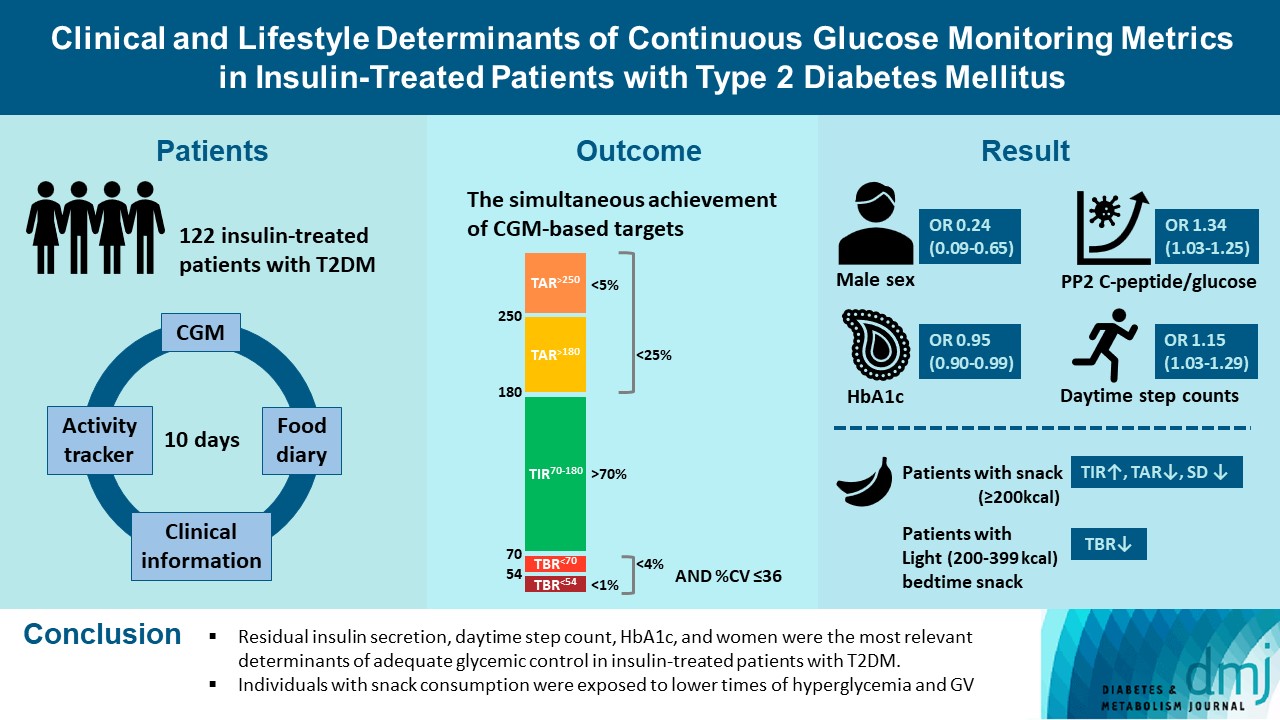
- This is a prospective observational study. We analyzed data from 122 insulin-treated patients with T2DM. Participants wore Dexcom G6 and Fitbit, and diet information was identified for 10 days. Multivariate-adjusted logistic regression analysis was performed for the simultaneous achievement of CGM-based targets, defined by the percentage of time in terms of hyper, hypoglycemia and glycemic variability (GV). Intake of macronutrients and fiber, step counts, sleep, postprandial C-peptide-to-glucose ratio (PCGR), information about glucose lowering medications and metabolic factors were added to the analyses. Additionally, we evaluated the impact of the distribution of energy and macronutrient during a day, and snack consumption on CGM metrics.
-
Results
- Logistic regression analysis revealed that female, participants with high PCGR, low glycosylated hemoglobin (HbA1c) and daytime step count had a higher probability of achieving all targets based on CGM (odds ratios [95% confidence intervals] which were 0.24 [0.09 to 0.65], 1.34 [1.03 to 1.25], 0.95 [0.9 to 0.99], and 1.15 [1.03 to 1.29], respectively). And participants who ate snacks showed a shorter period of hyperglycemia and less GV compared to those without.
-
Conclusion
- We confirmed that residual insulin secretion, daytime step count, HbA1c, and women were the most relevant determinants of adequate glycemic control in insulin-treated patients with T2DM. In addition, individuals with snack consumption were exposed to lower times of hyperglycemia and GV.
- Individuals with diabetes and similar glycosylated hemoglobin (HbA1c) values may have different glycemic profiles, with different glycemic variability (GV), which is affected by lifestyle changes such as diet and exercise [1-3]. Reducing GV, as well as chronic hyperglycemia represented by HbA1c, has been an important target in various intervention trials [4].
- Currently, continuous glucose monitoring (CGM) has been recommended as an indicator of glycemic control and for decision making in treatment regimens [5] and as a tool to assess GV [6,7]. Standardized CGM metrics were defined as the percentage time in range (TIR) of 70 to 180 mg/dL (TIR70–180), time above range (TAR) >180 mg/dL (TAR>180), TAR >250 mg/dL (TAR>250), time below range (TBR) <70 mg/dL (TBR<70), TBR <54 mg/dL (TBR<54), standard deviation (SD) and coefficient of variation (CV) representing hyperglycemia, hypoglycemia, and GV [5]. In this regard, the recommendations of experts on diabetes support the usefulness of CGM for patients with type 2 diabetes mellitus (T2DM) on insulin injections, as well as type 1 diabetes mellitus [5].
- Although understanding the relationship between lifestyle habits and glucose fluctuation in an outpatient setting, which would offer real-world clinical data, could contribute to the optimal management of T2DM, to date, studies evaluating the association between detailed lifestyle habits and CGM metrics in patients with T2DM are scarce. Most previous studies conducted in T2DM did not include lifestyle factors [8,9], estimated lifestyle habits by self-reported questionnaire [2], and were conducted in a controlled environment [10]. Although there were two recent studies that focused on the influence of behavioral factors, the study subjects were nondiabetic individuals [11,12].
- Thus, this study aimed to characterize the major determinants of standardized CGM metrics by implementing detailed measures of clinical, behavioral, and nutritional factors in insulin-treated patients with T2DM.
INTRODUCTION
- Study participants and protocol
- We analyzed the data set of an ongoing prospective observational study. We recruited Korean patients with T2DM taking both insulin and noninsulin glucose lowering medications (GLMs) between February 2021 and September 2022 at the outpatient clinic of the Korea University Ansan Hospital (Ansan). The inclusion criteria were as follows: (1) age between 19 and 80 years; (2) fasting C-peptide more than 0.4 ng/mL. Individuals were excluded under any of the following criteria: (1) those who had been hospitalized for hyperglycemic hyperosmolar syndrome, diabetic ketoacidosis, or cardiovascular disease (CVD) in the past 3 months; (2) patients with stage 4 or 5 chronic renal disease; (3) patients with hepatic dysfunction or symptomatic heart failure; (4) those who are currently receiving anticancer therapies or medicines that may affect blood glucose other than GLMs; (5) patients with uncontrolled hypertension (systolic blood pressure [BP] ≥180 mm Hg or diastolic BP ≥100 mm Hg); or (6) pregnant or lactating women.
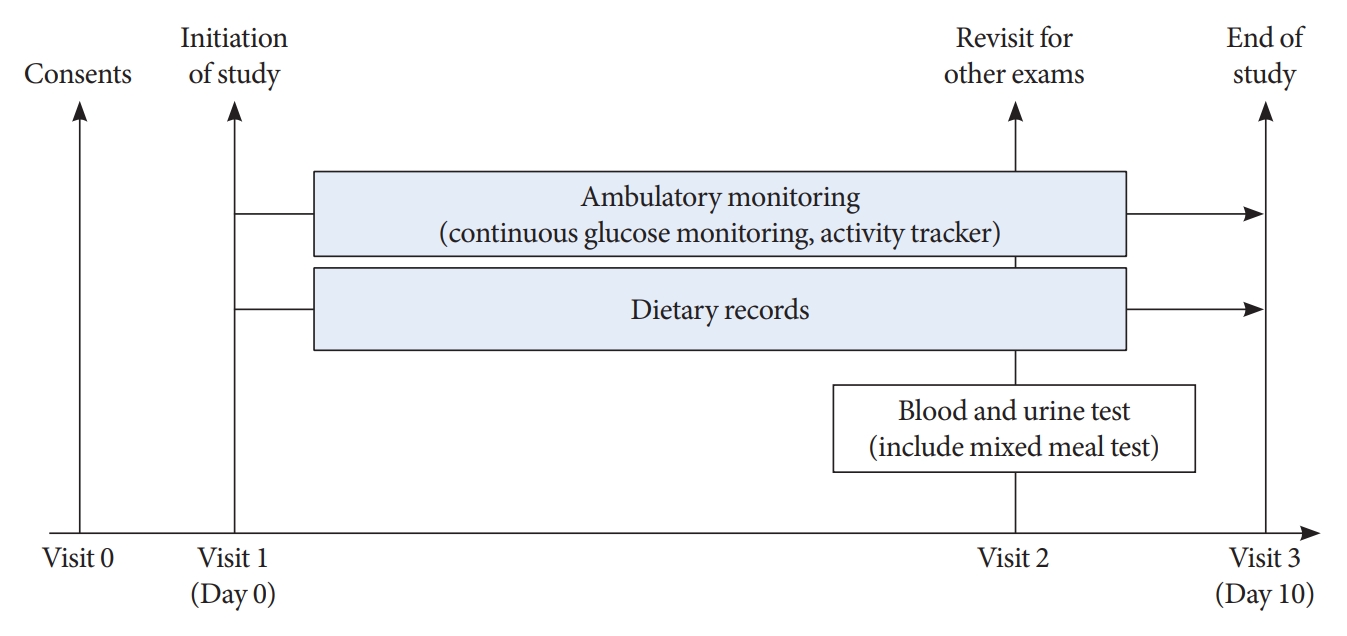
- As shown in Fig. 1, all participants visited Korea University Ansan Hospital and were equipped with real-time CGM and wearable activity trackers during the 10-day study period. In addition, participants underwent a mixed meal test.
- The present study was approved by the Institutional Review Board (IRB) of Korea University Ansan Hospital (IRB Nos. 2019AS0158 and 2021AS0099) and was conducted in accordance with the Helsinki Declaration of 1975. All participants provided written informed consent to use their data prior to participation. The study protocol was registered with the Clinical Research Information Service (CRiS) of the Ministry of Health and Welfare of the Republic of Korea (CRiS numbers: KCT0004320 and KCT0006171).
- CGM metrics
- Dexcom G6 (Dexcom Inc., San Diego, CA, USA), real-time CGM, was used for 10 days. To collect information about the lifestyle habits of the participants as is, only basic instruction was provided for the mobile application of Dexcom G6. All participants were advised to maintain their current insulin dose and health behaviors, without any education on diabetes management. The investigators obtained each participant’s CGM data via the Dexcom CLARITY for Clinics website (https://clarity.dexcom.eu/professional/).
- Following the experts’ recommendations, the CGM-derived glycemic targets were defined, which were TIR70–180 >70%, TAR>180 <25%, TAR>250 <5%, TBR<70 mg/dL <4%, TBR<54 <1%, and %CV ≤36 [5]. We regarded the concurrent achievement of the above-mentioned targets as adequate glycemic control. Additionally, we calculated the SD.
- Wearable activity tracker
- We used the Fitbit Inspire 2 (from here on, termed simply Fitbit, Fitbit Inc., San Francisco, CA, USA) to collect information on step count, energy consumption, heart rate, and sleep time. As it contained a battery capable of lasting 10 days, the participants were instructed to wear Fitbit Inspire 2 all day, even while sleeping, without charging throughout the study period. Therefore, the caloric consumption measured by Fitbit included the basal metabolic rate during sleep, and movement around the house was also incorporated into the step count.
- The data were transmitted to a Fitbit server using Bluetooth. We stratified the step counts into daytime and bedtime, as described below [13].
- (1) Daytime: the period from sunrise to sunset.
- (2) Bedtime: the period of 8 hours before sunrise of the next day.
- Dietary records
- Dietary data were investigated using the picture and dietary record method. Participants were instructed to maintain their eating habits and take pictures of the food twice (vertical and lateral photographs) before and after eating, and to describe the type and amount of food consumed, mealtime, results of self-monitoring of blood glucose, insulin unit, and GLMs in the diet diary. Each participant was educated on how to record the diet diary by a research dietitian, and examples of a diet diary and tableware (Slim Diet Tableware, Jinseoung C&T Co. Ltd., Sejong, Korea) were provided to accurately estimate the amount of a bowl of rice. The participants sent photos and diet diaries on a daily basis. At the end of the study, the research dietitian analyzed the dietary diary using the database of the Ministry of Food and Drug Safety’s integrated data collection of nutritional ingredients for eating out (2012 to 2017) [14] and the CAN-Pro 5.0 (Web version, The Korean Nutrition Society, Seoul, Korea). The calories and amounts of carbohydrates, proteins, lipids, and fibers in the main meals (breakfast, lunch, and dinner) and snack intake were calculated. Because diet information is often missing and underreported, we averaged the calories and nutrients for breakfast, lunch, dinner, and snacks during the study period. They were then summed to obtain the daily calorie and nutrient intake.
- For an elaborate analysis of dietary records, the research dietitian scored the diet diary according to the following: the presence of dietary pictures of more than 70% of total meals (1 point), the accuracy of the quantity of intake (1 point) and the timing of intake (1 point). After calculating points of all three categories (0 to 3 points), we chose the participants with 2 or 3 points (n=91). Among the 91 participants who adhered with excellent fidelity to the food diary, we calculated the proportion of main meals and snacks with respect to total daily energy, carbohydrate, fat and protein intake. Snack consumption was defined as an average energy intake of ≥200 kcal, in addition to main meals during the 10-day-of study period [15]. The consumption of snacks at bedtime was defined as those eaten during bedtime and categorized as light (200 to 399 kcal) and heavy (≥400 kcal). Because there were few participants who consumed a snack at bedtime of more than ≥500 kcal, we adopted the cutoff of 400 kcal instead of 500 kcal [16].
- Mixed meal test and laboratory measurements
- After venous blood sampling with an overnight fast of at least 8 hours, they were asked to eat a mixed meal prepared by the investigators. A mixed meal is a precooked Korean food containing a carbohydrate content of 70 g (Michel food Inc., Seoul, Korea). Postprandial 1-hour and 2-hour blood samplings were performed. The participants were instructed to eat all the food, and after eating, the research dietitian estimated the remaining amount.
- Fasting plasma glucose, total cholesterol, triglycerides, high-density lipoprotein cholesterol, blood urea nitrogen, serum creatinine, and the urinary albumin-to-creatinine ratio (uACR) were measured using an automated chemical analyzer (COBAS 8000 modular analyzer series, Roche, Basel, Switzerland). Low-density lipoprotein cholesterol levels were calculated using Friedewald’s formula. The estimated glomerular filtration rate (eGFR) was calculated using the Chronic Kidney Disease Epidemiology Collaboration formula [17]. Dyslipidemia was defined as a total cholesterol level of ≥240 mg/dL or at least on the prescription of antihyperlipidemic agents under the International Classification of Diseases 10th Revision (ICD-10) code E78. HbA1c and hemoglobin concentrations were determined using high-performance liquid chromatography (Tosoh HLC-723 G11 analyzer, Tosoh, Tokyo, Japan) and flow cytometry (Sysmex XN-9000 analyzer, Sysmex, Kobe, Japan). Serum C-peptide levels were estimated using an automated radioimmunoassay analyzer (Gamma Pro, KaiEn, Seoul, Korea).
- Insulin secretory capacity was calculated using fasting and postprandial glucose and C-peptide levels. The fasting C-peptide-to-glucose ratio (FCGR) and 1-hour and 2-hour postprandial C-peptide-to-glucose ratios (PCGR1 and PCGR2, respectively) were calculated as the fasting or postprandial C-peptide level (ng/mL), and fasting or postprandial glucose level (mg/dL)×100 [18].
- Other covariates
- The patients reported their clinical information, including the duration of diabetes and the prescribed medications. The body mass index (BMI) was calculated as their weight in kilograms divided by the square of their height in meters. Trained nurses measured BP in a sitting position using a standardized sphygmomanometer after 5 minutes of rest. Hypertension was defined as a systolic BP ≥140 mm Hg, diastolic BP ≥90 mm Hg, or at least one prescription of antihypertensive medications per year under ICD-10 codes I10–I15. The smoking status and alcohol consumption were classified as never, former, or current. Regular exercise was defined as an exercise for >30 minutes at least three times a week during the previous month. A history of stroke and ischemic heart disease was self-reported.
- Statistical analysis
- To evaluate the association between CGM metrics and clinical, behavioral, and nutritional factors, Spearman correlation analysis was performed. To identify independent factors for the simultaneous achievement of six CGM-based targets, a multivariate logistic regression analysis was performed with covariates including age, sex, BMI, HbA1c level, duration of diabetes, PCGR2, eGFR, uACR, sleep duration, and daytime step counts. With adjustment for the above-mentioned covariates, we investigated the impact of use of sulfonylurea or meglitinide, inhibitor of dipeptidyl peptidase 4 (DPP-4 inhibitor), or inhibitors of sodium glucose cotransporter 2 (SGLT-2 inhibitors), total daily dose of insulin, two or three times injection of prandial insulin per day, the amount of calories, carbohydrate, fat, protein and fiber per day on adequate glycemic control separately in the regression model.
- Furthermore, we performed a subgroup analysis according to the median of HbA1c, eGFR, uACR, the number of times of prandial insulin injection and the use of the DPP-4 inhibitor. The participants with eGFR <60 mL/min/1.73 m2 were only 18 patients. Therefore, we divided the participants according to an eGFR of 90 mL/min/1.73 m2 instead of 60 mL/min/1.73 m2. Furthermore, due to the small number of participants, we minimized the covariates.
- As a sensitivity analysis in 91 participants with excellent fidelity of diet dairy, we explored the impact of the distribution of energy and nutrient intake among each meal and snack, and frequency of eating on CGM metrics using Spearman correlation analysis. Subsequently, we obtained the risk adjusted difference in the CGM metrics according to snack consumption using the analysis of covariance. Age, sex, BMI, eGFR, HbA1c, duration of diabetes, PCGR2, urine ACR ≥30 mg/g, daytime step counts, and daily sleep duration were used as covariates.
- Finally, we compared the baseline characteristics according to snack consumption using a Student t-test and chi-square test. Data are presented as mean±SD, median (interquartile range), or the number of participants (percentage). Skewed variables were log-transformed for analysis. Statistical analyses were performed using Statistical Analysis System (SAS) version 9.1 for Windows (SAS Institute Inc., Cary, NC, USA). P values <0.05 were considered to be statistically significant.
- Data availability
- Data sharing is not applicable to this article as no datasets were generated or analyzed during the current study.
METHODS
- A total of 138 patients participated in this study. After excluding 16 participants whose activation rate of CGM was <50%, whose Fitbit data were not available, or with a lack of a diet diary, 122 participants were finally included in this analysis. The mean age was 53.4±12 years, and the proportion of the sexes was similar (Table 1). The mean duration of diabetes and mean HbA1c level measured at the end of CGM were 16±10.2 years and 8.1%±1.2%, respectively. Nearly 64% of participants (79 of 122) used both basal and prandial insulin as a premix or multiple daily injections. Degludec and aspart were the most common types of basal insulin and prandial insulin used, respectively. The most widely used oral GLMs were metformin, DPP-4 inhibitors, and SGLT-2 inhibitors. Information from Fitbit, diet diary, and CGM is also shown in Table 1. The mean CGM time was 232±33.1 hours (9.7±1.4 days).
- Table 2 shows the results of the Spearman correlation analysis between five CGM metrics and various clinical, behavioral, and nutritional factors. Although there are some differences, BMI, HbA1c, duration of diabetes, uACR, and total daily insulin dose showed a negative association with TIR70‒180 and a positive association with TAR>250, TBR<70, SD, and CV in general. On the contrary, PCGR2 and eGFR exhibited an opposite direction of significance. Furthermore, fiber intake was positively related to TBR<70 and CV.
- In the multivariate-adjusted logistic regression analysis for the simultaneous achievement of the targets based on CGM (Table 3), women and participants with low HbA1c and high PCGR2 and daytime step count had a higher probability of good glycemic control estimated from CGM. However, total calorie intake, macronutrients, and fiber did not have any association with CGM-based glycemic targets. When we conducted the subgroup analyses according to HbA1c, eGFR, uACR, frequency of prandial insulin and DPP-4 inhibitors, (Supplementary Table 1), significant interaction was found in DPP-4 inhibitors and uACR with BMI and age, respectively.
- In the sensitivity analysis conducted in 91 participants (Supplementary Table 2), the meal composition among energy and macronutrient intake is similar at about 26:32:33 with respect to breakfast, lunch, and dinner. In the analysis of the correlation between nutritional factors and CGM metrics, only the proportion of snacks among energy intake was negatively correlated with CV. Similarly, the snack composition among daily protein intake showed a positive association with TIR70–180 and a negative association with TAR>250 and SD.
- When we compared the CGM metrics according to snack consumption after adjustment for several covariates (Table 4), the group eating snacks showed higher TIR70‒180, and lower TAR>250 and GV, and those consuming light snacks at night had lower TBR<70 compared to those without snack consumption. As shown in Supplementary Table 3, the snack consumption group was younger, included more men, had higher eGFR, burned more energy, although they ate more calories and fat, and consumed less fiber.
RESULTS
- In this prospective observational study, we confirmed that factors such as residual insulin secretion capacity, daytime step count, female sex, and HbA1c were related to the high probability of simultaneous achievement of CGM-derived glycemic targets. In the nutritional aspect, snack intake was related to a lower exposure to hyperglycemia and GV, and light snack intake during bedtime was associated with a lower probability of hypoglycemia.
- The limitation of HbA1c as a risk predictor is that it does not reflect the detailed events of hypoglycemia, hyperglycemia, or GV [19]. In contrast, the CGM metrics provide information not only for GV but also for the time spent in the target range, hypoglycemia, and hyperglycemia per day [6]. In the present study, HbA1c was correlated with TBR<70 and CV with a low degree (standardized β=–0.26 and 0.31, respectively) and showed slight significance in the logistic regression analysis for the achievement of CGM-derived glycemic targets.
- Among behavioral components, we showed valid significance in step counts, especially during the daytime. Contrary to previous research demonstrating the clinical implications of step count on the risk of death, that measured step counts only during waking hours [20], participants in the present study wore Fitbit for 24 hours throughout the 10-day period, allowing us to understand the time-specific significance of step count. With reasonable reported accuracy [20], Fitbit, which is a consumer-grade accelerometer, has been suggested as an alternative to research-grade accelerometers because it is easy to use and relatively low cost [20]. Therefore, we chose Fitbit to consider generalizability.
- We confirmed that PCGR was negatively associated with a high probability of adequate glycemic control and low GV, in agreement with previous research showing that enough residual insulin secretion was associated with low GV [21,22]. Instead of C-peptide levels, we adopted PCGR to estimate the β-cell function. The ratio of C-peptide to glucose has been considered a biomarker that reflects the absolute amount of endogenous insulin secretion in response to glucose levels [18,23]. And postprandial state (PCGR), in particular, is a more reliable marker that better reflects maximum β-cell function than fasting or unstimulated value, FCGR [18,23].
- We did not find any implications for macronutrient composition or fiber intake for adequate glycemic control. Several diet interventions have shown that a low carbohydrate (<50 or <90 g/day) and a high fat diet (90 g/day) [24,25] or a high energy breakfast [26,27] is effective in reducing GV or postprandial hyperglycemia. However, our observational study design is inappropriate to draw conclusions on the usefulness of nutritional composition, due to the absence of energy restriction. Furthermore, in the present study, the macronutrient composition across the energy intake was 51.9%±7%, 28.3%±5.5%, and 17.4%±2.2%, which resembled those of the research investigating the high carbohydrate diet (53% carbohydrate, <30% lipid, and 17% protein) [25].
- Although a previous study suggested an association between high fiber intake and a decreased risk of T2DM and CVD [28], we could not reveal any association between fiber intake and GV in the logistic regression analysis. This may be attributed to the relatively high fiber intake in the present study (the mean±SD of total dietary fiber intake was 29.8±8.6 g/day, comparable to the upper 20% of fiber intake [30.1±6.6 g/day] in the previous study) [28]. A rather positive correlation between fiber intake and TBR<70 or CV could be induced by the eating behavior of more fiber with a small amount of energy source in individuals with many episodes of hypoglycemia.
- In detailed analysis on the nutritional aspects, we revealed the importance of snack consumption. A small number of studies have investigated the influence of snacks on glucose levels [10,29]. Timmer et al. [29] have shown that postprandial hyperglycemia after snacking was exacerbated more in the morning than in the evening among healthy adults. In a randomized trial in Canada, the consumption of low carbohydrate protein-rich bedtime snacks reduced fasting glucose compared to a high carbohydrate protein-matched snacks [10]. This could be explained by the fact that protein-rich snacks might enhance hepatic insulin sensitivity, resulting in suppressing hepatic glucose production [30]. Our findings were somewhat in line with previous evidence [10,29]. As shown in Supplementary Table 3, it was interesting to note that participants eating snacks tended to consume high calories and less fiber. The favorable characteristics of the participants with snack consumption could be speculated by high energy consumption and the high proportion of fat as an energy source. On the other aspect, those with snack consumption were younger and had better renal function than those without, which are important determinants of CGM metrics. However, we still demonstrated the significant association between snack consumption and CGM metrics even after age, sex, and eGFR. Therefore, we suggest that eating adequate snack can be helpful for glycemic control, and especially light night snack is important for reducing hypoglycemia.
- Although the impact of GLMs on GV has been assessed in previous studies [8,9,22,31], the present study failed to demonstrate the influence of GLMs on study outcome. The only significant finding was a positive correlation between the total daily dose of insulin and hyperglycemia or GV (Table 2). An explanation for the discrepant findings might be the differences in participants’ characteristics. As the reimbursement could cover up to two classes of GLMs for insulin-treated patients with T2DM in South Korea, the majority of participants in the present study were taking metformin and DPP-4 inhibitors or SGLT-2 inhibitors, which are already proven GLMs that decrease GV [32]. Therefore, it may be difficult to demonstrate the implications of each class of GLMs in the present study.
- To the best of our knowledge, this is the first attempt to integrate real-life information and CGM data from insulin-treated patients with T2DM. The participants were more homogeneous than those in prior studies performed on patients with various severities of T2DM.
- However, this study had several limitations. First, the CGM metric data were derived from a mean period of 9.8 days, which might be insufficient to obtain an overall representative profile [5]. Second, as we employed a real-time CGM system in an outpatient setting, the participants could alter their lifestyle habits in response to the results of the CGM readings. However, since all participants had no prior experience with CGM, it seems difficult to skillfully control the insulin dose based on the CGM value after just one session of brief education [33]. A recall bias regarding meal information is also possible. Third, owing to the small sample size and cross-sectional design, it is unclear whether this association is causal. Finally, because all the participants were Koreans, it is difficult to generalize these findings to other ethnicities.
- In conclusion, from the analysis of prospective observational studies with the environment reflecting the real-world, we found that residual insulin secretion, daytime step count, HbA1c, and women were the most relevant determinants of adequate glycemic control estimated from CGM in patients with T2DM receiving insulin injections. In addition, individuals with snack consumption were exposed to a shorter time of hyperglycemia and GV, and light snacks at night were associated with a low rate of hypoglycemia and low GV.
DISCUSSION
SUPPLEMENTARY MATERIALS
Supplementary Table 1.
Supplementary Table 2.
Supplementary Table 3.
-
CONFLICTS OF INTEREST
No potential conflict of interest relevant to this article was reported.
-
AUTHOR CONTRIBUTIONS
Conception or design: D.Y.L., N.K., S.Y.P., J.H.Y., S.M.P., N.H.K. Acquisition, analysis, or interpretation of data: D.Y.L., N.K., J.A.S., J.K., N.H.K., H.J.Y., S.G.K., K.M.C., S.H.B., S.M.P., N.H.K. Drafting the work or revising: D.Y.L., N.K., I.J.
Final approval of the manuscript: S.M.P., N.H.K.
-
FUNDING
This research was supported by the Bio & Medical Technology Development Program of the National Research Foundation (NRF) (NRF-2019M3E5D3073102 and NRF-2019R1H1A 2039682), a National IT Industry Promotion Agency (NIPA) grant (No. S0252-21-1001, Development of AI Precision Medical Solution (Doctor Answer 2.0), the Basic Science Research Program through NRF funded by the Ministry of Education (NRF-2020R1I1A1A01071665) funded by the Korean government (MSIT), and a grant (Da Young Lee, 2019F-7) from the Korean Diabetes Association). However, the funders did not participate in the study design or reporting.
NOTES
-
Acknowledgements
- None
| Characteristic | All participants (n=122) |
|---|---|
| Age, yr | 53.4±12 |
| Male sex | 65 (53.3) |
| BMI, kg/m2 | 27.1±4.5 |
| Systolic BP, mm Hg | 131.3±16.0 |
| Glycosylated hemoglobin, % | 8.1±1.2 |
| Fasting/PP2 glucose, mg/dL | 118.2±36.2/174.5±59.7 |
| FCGR/PCGR2 | 0.9±0.8/1.6±1.2 |
| Triglyceride, mg/dL | 121.6±61.1 |
| HDL-C, mg/dL | 49.0±13.3 |
| LDL-C, mg/dL | 68.8±29.9 |
| eGFR, mL/min/1.73 m2 | 90.1±24.3 |
| Urine ACR, mg/g | 312.1±720.3 |
| Urine ACR ≥30 mg/g | 56 (45.9) |
| Current drinker | 61 (50) |
| Current smoker | 38 (31.2) |
| Regular exercise | 55 (45.1) |
| Duration of diabetes, yr | 16±10.2 |
| Hypertension | 82 (67.2) |
| Dyslipidemia | 101 (82.8) |
| Stroke | 6 (4.9) |
| Ischemic heart disease | 15 (12.3) |
| Anti-diabetic drug | |
| Basal insulin | |
| Glargine | 35 (28.7) |
| Degludec | 87 (71.3) |
| Total daily dose, U | 29.1±16 |
| Prandial insulin | |
| Aspart | 75 (61.5) |
| Glulisine | 4 (3.3) |
| Total daily dose, U | 12.6±15.3 |
| Times of injection, /day | |
| 0 | 43 (35.3) |
| 1 | 20 (16.4) |
| 2 | 35 (28.7) |
| 3 | 23 (18.9) |
| Metformin | 116 (95.1) |
| Sulfonylurea or meglitinide | 23 (18.9) |
| DPP-4 inhibitor | 57 (46.7) |
| SGLT-2 inhibitors | 31 (25.4) |
| GLP-1 receptor agonist | 5 (4.1) |
| Thiazolidinedione | 3 (2.5) |
| α-Glucosidase inhibitor | 2 (1.6) |
| Fitbit | |
| Sleep duration per night, min | 402.9±62.5 |
| Energy consumption, kcal/day | 2,283.9±561.9 |
| Daily step count | 10,011.5±10,275.0 |
| Daytime | 7,324.6±3,947.6 |
| Bedtime | 1,020.7±1,107.7 |
| Information from the dietary record | |
| Calorie intake, kcal/day | 2,061.2±465.4 |
| Carbohydrate intake, g/1,000 kcal/day | 131.6±18.3 |
| Fat intake, g/1,000 kcal/day | 30.9±6.5 |
| Protein intake, g/1,000 kcal/day | 42.8±5.4 |
| Fiber intake, g/1,000 kcal/day | 14.8±4.3 |
| CGM metrics | |
| Time of active CGM, % | 94.0±8.1 |
| TIR70‒180 mg/dL, % | 62.8±20.7 |
| >70%a | 52 (42.6) |
| TAR>250 mg/dL, % | 11.1±12.8 |
| <5%a | 57 (46.7) |
| TAR>180 mg/dL, % | 35.8±21.0 |
| <25%a | 47 (38.5) |
| TBR<70 mg/dL, % | 1.3±3.7 |
| <4%a | 111 |
| TBR<54 mg/dL, % | 0.2±0.9 |
| <1%a | 114 |
| SD, mg/dL | 51.6±14.2 |
| CV, % | 30.7±6.0 |
| ≤36a | 103 (84.4) |
Values are presented as mean±standard deviation or number of subjects (%).
BMI, body mass index; BP, blood pressure; PP2, 2-hour postprandial; FCGR, fasting C-peptide-to-glucose ratio; PCGR2, 2-hour postprandial C-peptide-to-glucose ratio; HDL-C, high-density lipoprotein cholesterol; LDL-C, low-density lipoprotein cholesterol; eGFR, estimated glomerular filtration rate; ACR, albumin-to-creatinine ratio; DPP-4, dipeptidyl peptidase 4; SGLT-2, sodium glucose cotransporter 2; GLP-1, glucagon like peptide-1; CGM, continuous glucose monitoring; TIR, time in range; TAR, time above range; TBR, time below range; SD, standard deviation; CV, coefficient of variation.
a Number and % of those that meet the specified proportions of TAR, TIR, TBR, and CV.
| Variable | TIR70‒180 | TAR>250 | TBR<70 | SD | CV |
|---|---|---|---|---|---|
| Age, yr | –0.11 | 0.15 | –0.01 | 0.20e | 0.15 |
| BMI, kg/m2 | –0.24f | 0.20e | –0.27f | 0.09 | –0.08 |
| Glycosylated hemoglobin, %a | –0.53g | 0.56g | –0.26f | 0.58g | 0.31f |
| Duration of diabetes, yr | –0.22e | 0.26f | –0.01 | 0.33g | 0.23e |
| PCGR2b | 0.22e | –0.29f | –0.24f | –0.43g | –0.45g |
| eGFR, mL/min/1.73 m2 | 0.22e | –0.31g | –0.05 | –0.41g | –0.36g |
| Urine ACR, mg/g | –0.35g | 0.42g | –0.19e | 0.42g | 0.21e |
| Daily sleep duration, minc | 0.02 | –0.05 | –0.04 | –0.07 | –0.02 |
| Energy consumption, kcal/day | –0.09 | 0.05 | –0.16 | 0.01 | –0.02 |
| Daytime step countsb | 0.05 | –0.03 | –0.14 | –0.04 | –0.07 |
| Calorie intake, kcal/dayd | –0.15 | 0.10 | –0.10 | 0.07 | –0.05 |
| Carbohydrate intake, g/1,000 kcal/day | –0.09 | 0.14 | 0.02 | 0.16 | 0.11 |
| Fat intake, g/1,000 kcal/day | 0.16 | –0.18 | 0.08 | –0.16 | –0.05 |
| Protein intake, g/1,000 kcal/day | 0.10 | –0.16 | 0.11 | –0.13 | –0.05 |
| Fiber intake, g/1,000 kcal/day | 0.05 | –0.01 | 0.22e | 0.09 | 0.19e |
| Total daily dose of insulin | –0.27f | 0.29f | 0.03 | 0.37g | 0.31g |
For analyses, TAR>250, TBR<70, PCGR2, and urine ACR levels, and the daytime step count were log-transformed before the analyses to maintain the normality of the residuals.
TIR, time in range; TAR, time above range; TBR, time below range; SD, standard deviation; CV, coefficient of variation; BMI, body mass index; PCGR2, 2-hour postprandial C-peptide-to-glucose ratio; eGFR, estimated glomerular filtration rate; ACR, albumin-to-creatinine ratio.
a Per 0.1 of glycosylated hemoglobin,
b Per 0.1 of LnPCGR2 and Ln (daytime step counts/100),
c Per 10 minutes of daily sleep duration,
d Per 100 kcal of daily calorie intake,
e P<0.05,
f P<0.01,
g P<0.001.
| Variable | Odds ratio (95% CI) |
|---|---|
| Clinical and behavioral factors | f |
| Age, yr | 0.98 (0.92‒1.04) |
| Male sex | 0.24 (0.09‒0.65) |
| BMI, kg/m2 | 0.93 (0.82‒1.05) |
| Glycosylated hemoglobin, %b | 0.95 (0.90‒0.99) |
| Duration of diabetes, yr | 0.99 (0.92‒1.06) |
| PCGR2c | 1.34 (1.03‒1.25) |
| eGFR, mL/min/1.73 m2 | 1.01 (0.98‒1.04) |
| Urine ACR ≥30 mg/g | 0.32 (0.10‒1.02) |
| Daily sleep duration, mind | 0.99 (0.92‒1.08) |
| Daytime step countsc | 1.15 (1.03‒1.29) |
| Medications and nutritional factors | g |
| Sulfonylurea or meglitinide | 0.58 (0.15‒2.29) |
| DPP-4 inhibitor | 0.95 (0.33‒2.74) |
| SGLT-2 inhibitors | 1.19 (0.40‒3.53) |
| Total daily dose of insulin | 0.99 (0.96‒1.02) |
| 2 or 3 times of prandial insulin per day | 1.37 (0.49‒3.82) |
| Calorie intake, kcal/daye | 1.03 (0.91‒1.17) |
| Carbohydrate intake, g/1,000 kcal/day | 0.99 (0.96‒1.01) |
| Fat intake, g/1,000 kcal/day | 1.02 (0.94‒1.11) |
| Protein intake, g/1,000 kcal/day | 0.92 (0.83‒1.02) |
| Fiber intake, g/1,000 kcal/day | 0.91 (0.79‒1.06) |
CI, confidence interval; BMI, body mass index; PCGR2, 2-hour postprandial C-peptide-to-glucose ratio; eGFR, estimated glomerular filtration rate; ACR, albumin-to-creatinine ratio; DPP-4, dipeptidyl peptidase 4; SGLT-2, sodium glucose cotransporter 2.
a Time in range70‒180 >70%, time above range (TAR)>180 <25%, TAR>250 <5%, time below range (TBR)<70 <4%, TBR<54 <1%, and coefficient of variation ≤36%,
b Per 0.1 of glycosylated hemoglobin (HbA1c),
c Per 0.1 of LnPCGR2 and Ln (daytime step counts/100),
d Per 10 minutes of daily sleep duration,
e Per 100 kcal of daily calorie intake,
f Each variable was adjusted for the other variables in the table,
g gAge, sex, BMI, eGFR, HbA1c, duration of diabetes, PCGR2, urine ACR ≥30 mg/g, daily sleep duration, and daytime step counts were adjusted for each logistic regression analysis.
| Variable | No | Yes | P valuea | P valueb |
|---|---|---|---|---|
| Snack consumption | 60 | 31 | ||
| TIR70‒180, % | 62.8±2.3 | 73±3.3 | 0.018 | 0.019 |
| TAR>250, % | 7.2 (5.4‒9.5) | 3.9 (2.6‒5.9) | 0.022 | 0.046 |
| TBR<70, % | 0.2 (0.0‒0.8) | 0.1 (0.0‒0.6) | 0.470 | 0.382 |
| SD, mg/dL | 53.6±1.7 | 44.6±2.5 | 0.006 | 0.007 |
| CV, % | 32.1±0.8 | 29±1.1 | 0.028 | 0.086 |
| Light bedtime snack | 69 | 22 | ||
| TIR70‒180, % | 66.0±2.1 | 67.2±3.8 | 0.792 | 0.866 |
| TAR>250, % | 6.2 (4.8‒80) | 4.8 (30‒7.6) | 0.323 | 0.515 |
| TBR<70, % | 0.4 (0.0‒1.2) | 0.0 (0.0‒0.2) | 0.002 | 0.006 |
| SD, mg/dL | 51.7±1.6 | 46.6±2.8 | 0.119 | 0.305 |
| CV, % | 31.7±0.7 | 28.7±1.2 | 0.037 | 0.172 |
Values are presented as least squares mean±standard error or median (interquartile range) after adjustment for age and sex. For analyses, TAR>250, TBR<70 were log-transformed before the analyses to maintain the normality of the residuals.
TIR, time in range; TAR, time above range; TBR, time below range; SD, standard deviation; CV, coefficient of variation.
a P values represent the comparison of two groups using analysis of covariance with adjustment for age and sex,
b P values represent the comparison of two groups using analysis of covariance with adjustment for age, sex, body mass index, estimated glomerular filtration rate, glycosylated hemoglobin, duration of diabetes, 2-hour postprandial C-peptide-to-glucose ratio, urine albumin-to-creatinine ratio ≥30 mg/g, daytime step counts, and daily sleep duration.
- 1. Wakasugi S, Mita T, Katakami N, Okada Y, Yoshii H, Osonoi T, et al. Associations between continuous glucose monitoring-derived metrics and arterial stiffness in Japanese patients with type 2 diabetes. Cardiovasc Diabetol 2021;20:15.ArticlePubMedPMCPDF
- 2. Mori H, Okada Y, Kurozumi A, Narisawa M, Tanaka Y. Factors influencing inter-day glycemic variability in diabetic outpatients receiving insulin therapy. J Diabetes Investig 2017;8:69-74.ArticlePubMedPMCPDF
- 3. Siegelaar SE, Holleman F, Hoekstra JB, DeVries JH. Glucose variability: does it matter? Endocr Rev 2010;31:171-82.ArticlePubMed
- 4. Smith-Palmer J, Brandle M, Trevisan R, Orsini Federici M, Liabat S, Valentine W. Assessment of the association between glycemic variability and diabetes-related complications in type 1 and type 2 diabetes. Diabetes Res Clin Pract 2014;105:273-84.ArticlePubMed
- 5. ElSayed NA, Aleppo G, Aroda VR, Bannuru RR, Brown FM, Bruemmer D, et al. 6. Glycemic targets: standards of care in diabetes-2023. Diabetes Care 2023;46(Suppl 1):S97-110.
- 6. Bergenstal RM, Ahmann AJ, Bailey T, Beck RW, Bissen J, Buckingham B, et al. Recommendations for standardizing glucose reporting and analysis to optimize clinical decision making in diabetes: the Ambulatory Glucose Profile (AGP). Diabetes Technol Ther 2013;15:198-211.ArticlePubMed
- 7. Danne T, Nimri R, Battelino T, Bergenstal RM, Close KL, DeVries JH, et al. International consensus on use of continuous glucose monitoring. Diabetes Care 2017;40:1631-40.ArticlePubMedPMCPDF
- 8. Ohara M, Hiromura M, Nagaike H, Kohata Y, Fujikawa T, Goto S, et al. Relationship between glucose variability evaluated by continuous glucose monitoring and clinical factors, including glucagon-stimulated insulin secretion in patients with type 2 diabetes. Diabetes Res Clin Pract 2019;158:107904.ArticlePubMed
- 9. Gomez AM, Henao-Carillo DC, Taboada L, Fuentes O, Lucero O, Sanko A, et al. Clinical factors associated with high glycemic variability defined by coefficient of variation in patients with type 2 diabetes. Med Devices (Auckl) 2021;14:97-103.PubMedPMC
- 10. Abbie E, Francois ME, Chang CR, Barry JC, Little JP. A low-carbohydrate protein-rich bedtime snack to control fasting and nocturnal glucose in type 2 diabetes: a randomized trial. Clin Nutr 2020;39:3601-6.ArticlePubMed
- 11. Kishimoto I, Ohashi A. Impact of lifestyle behaviors on postprandial hyperglycemia during continuous glucose monitoring in adult males with overweight/obesity but without diabetes. Nutrients 2021;13:3092.ArticlePubMedPMC
- 12. Park SH, Yao J, Chua XH, Chandran SR, Gardner DS, Khoo CM, et al. Diet and physical activity as determinants of continuously measured glucose levels in persons at high risk of type 2 diabetes. Nutrients 2022;14:366.ArticlePubMedPMC
- 13. Cho CH, Lee T, Kim MG, In HP, Kim L, Lee HJ. Mood prediction of patients with mood disorders by machine learning using passive digital phenotypes based on the circadian rhythm: prospective observational cohort study. J Med Internet Res 2019;21:e11029.ArticlePubMedPMC
- 14. The Ministry of Food and Drug Safety. Integrated data collection of nutritional ingredients for eating out (2012-2017). Available from: https://various.foodsafetykorea.go.kr/nutrient/ (cited 2023 May 24).
- 15. Kohri T, Kaba N. Study of the effects of snack-centered dietary education on first-grade elementary students and duration of these effects. Am J Public Health Res 2015;3:1-7.
- 16. Suh Y, Lee EK, Chung YJ. Comparison of nutritional status by energy level of night snack in Korean adults: using the data from 2005 Korean National Health and Nutrition Examination Survey. Korean J Nutr 2012;45:479-88.Article
- 17. Levey AS, Stevens LA, Schmid CH, Zhang YL, Castro AF 3rd, Feldman HI, et al. A new equation to estimate glomerular filtration rate. Ann Intern Med 2009;150:604-12.ArticlePubMedPMC
- 18. Lee EY, Hwang S, Lee SH, Lee YH, Choi AR, Lee Y, et al. Postprandial C-peptide to glucose ratio as a predictor of b-cell function and its usefulness for staged management of type 2 diabetes. J Diabetes Investig 2014;5:517-24.PubMedPMC
- 19. Beck RW, Connor CG, Mullen DM, Wesley DM, Bergenstal RM. The fallacy of average: how using HbA1c alone to assess glycemic control can be misleading. Diabetes Care 2017;40:994-9.ArticlePubMedPMCPDF
- 20. Carpenter C, Yang CH, West D. A comparison of sedentary behavior as measured by the Fitbit and ActivPAL in college students. Int J Environ Res Public Health 2021;18:3914.ArticlePubMedPMC
- 21. Ohara M, Fukui T, Ouchi M, Watanabe K, Suzuki T, Yamamoto S, et al. Relationship between daily and day-to-day glycemic variability and increased oxidative stress in type 2 diabetes. Diabetes Res Clin Pract 2016;122:62-70.ArticlePubMed
- 22. Jin SM, Kim TH, Bae JC, Hur KY, Lee MS, Lee MK, et al. Clinical factors associated with absolute and relative measures of glycemic variability determined by continuous glucose monitoring: an analysis of 480 subjects. Diabetes Res Clin Pract 2014;104:266-72.ArticlePubMed
- 23. Saisho Y. Postprandial C-peptide to glucose ratio as a marker of b cell function: implication for the management of type 2 diabetes. Int J Mol Sci 2016;17:744.PubMedPMC
- 24. Ranjan A, Schmidt S, Damm-Frydenberg C, Holst JJ, Madsbad S, Norgaard K. Short-term effects of a low carbohydrate diet on glycaemic variables and cardiovascular risk markers in patients with type 1 diabetes: a randomized open-label crossover trial. Diabetes Obes Metab 2017;19:1479-84.PubMedPDF
- 25. Tay J, Thompson CH, Luscombe-Marsh ND, Wycherley TP, Noakes M, Buckley JD, et al. Effects of an energy-restricted low-carbohydrate, high unsaturated fat/low saturated fat diet versus a high-carbohydrate, low-fat diet in type 2 diabetes: a 2-year randomized clinical trial. Diabetes Obes Metab 2018;20:858-71.ArticlePubMedPDF
- 26. Jakubowicz D, Barnea M, Wainstein J, Froy O. High caloric intake at breakfast vs. dinner differentially influences weight loss of overweight and obese women. Obesity (Silver Spring) 2013;21:2504-12.ArticlePubMedPDF
- 27. Jakubowicz D, Wainstein J, Tsameret S, Landau Z. Role of high energy breakfast “big breakfast diet” in clock gene regulation of postprandial hyperglycemia and weight loss in type 2 diabetes. Nutrients 2021;13:1558.ArticlePubMedPMC
- 28. Partula V, Deschasaux M, Druesne-Pecollo N, Latino-Martel P, Desmetz E, Chazelas E, et al. Associations between consumption of dietary fibers and the risk of cardiovascular diseases, cancers, type 2 diabetes, and mortality in the prospective NutriNet-Sante cohort. Am J Clin Nutr 2020;112:195-207.PubMed
- 29. Timmer R, Bogaardt L, Brummelhuis WJ, van Oostrom CT, van Kerkhof LW, Wong A, et al. A randomized crossover trial assessing time of day snack consumption and resulting postprandial glycemic response in a real-life setting among healthy adults. Chronobiol Int 2022;39:1329-39.ArticlePubMed
- 30. Manders RJ, Praet SF, Meex RC, Koopman R, de Roos AL, Wagenmakers AJ, et al. Protein hydrolysate/leucine co-ingestion reduces the prevalence of hyperglycemia in type 2 diabetic patients. Diabetes Care 2006;29:2721-2.ArticlePubMedPDF
- 31. Miya A, Nakamura A, Handa T, Nomoto H, Kameda H, Cho KY, et al. Log-linear relationship between endogenous insulin secretion and glycemic variability in patients with type 2 diabetes on continuous glucose monitoring. Sci Rep 2021;11:9057.ArticlePubMedPMCPDF
- 32. Zhou Z, Sun B, Huang S, Zhu C, Bian M. Glycemic variability: adverse clinical outcomes and how to improve it? Cardiovasc Diabetol 2020;19:102.ArticlePubMedPMCPDF
- 33. Yoo JH, Kim G, Lee HJ, Sim KH, Jin SM, Kim JH. Effect of structured individualized education on continuous glucose monitoring use in poorly controlled patients with type 1 diabetes: a randomized controlled trial. Diabetes Res Clin Pract 2022;184:109209.ArticlePubMed
REFERENCES
Figure & Data
References
Citations
- Explanatory variables of objectively measured 24-h movement behaviors in people with prediabetes and type 2 diabetes: A systematic review
Lotte Bogaert, Iris Willems, Patrick Calders, Eveline Dirinck, Manon Kinaupenne, Marga Decraene, Bruno Lapauw, Boyd Strumane, Margot Van Daele, Vera Verbestel, Marieke De Craemer
Diabetes & Metabolic Syndrome: Clinical Research & Reviews.2024; 18(4): 102995. CrossRef
 PubReader
 ePub Link
 Cite
Cite- Figure
-


- Related articles
-
- Combining Ezetimibe and Rosuvastatin: Impacts on Insulin Sensitivity and Vascular Inflammation in Patients with Type 2 Diabetes Mellitus
- Risk Prediction and Management of Chronic Kidney Disease in People Living with Type 2 Diabetes Mellitus
- The Beneficial Effect of Glycemic Control against Adverse Outcomes in Patients with Type 2 Diabetes Mellitus and Chronic Kidney Disease
- Navigating the Seas of Glycemic Control: The Role of Continuous Glucose Monitoring in Type 1 Diabetes Mellitus
- Glycemia according to the Use of Continuous Glucose Monitoring among Adults with Type 1 Diabetes Mellitus in Korea: A Real-World Study


