- Current
- Browse
- Collections
-
For contributors
- For Authors
- Instructions to authors
- Article processing charge
- e-submission
- For Reviewers
- Instructions for reviewers
- How to become a reviewer
- Best reviewers
- For Readers
- Readership
- Subscription
- Permission guidelines
- About
- Editorial policy
Articles
- Page Path
- HOME > Diabetes Metab J > Volume 46(6); 2022 > Article
-
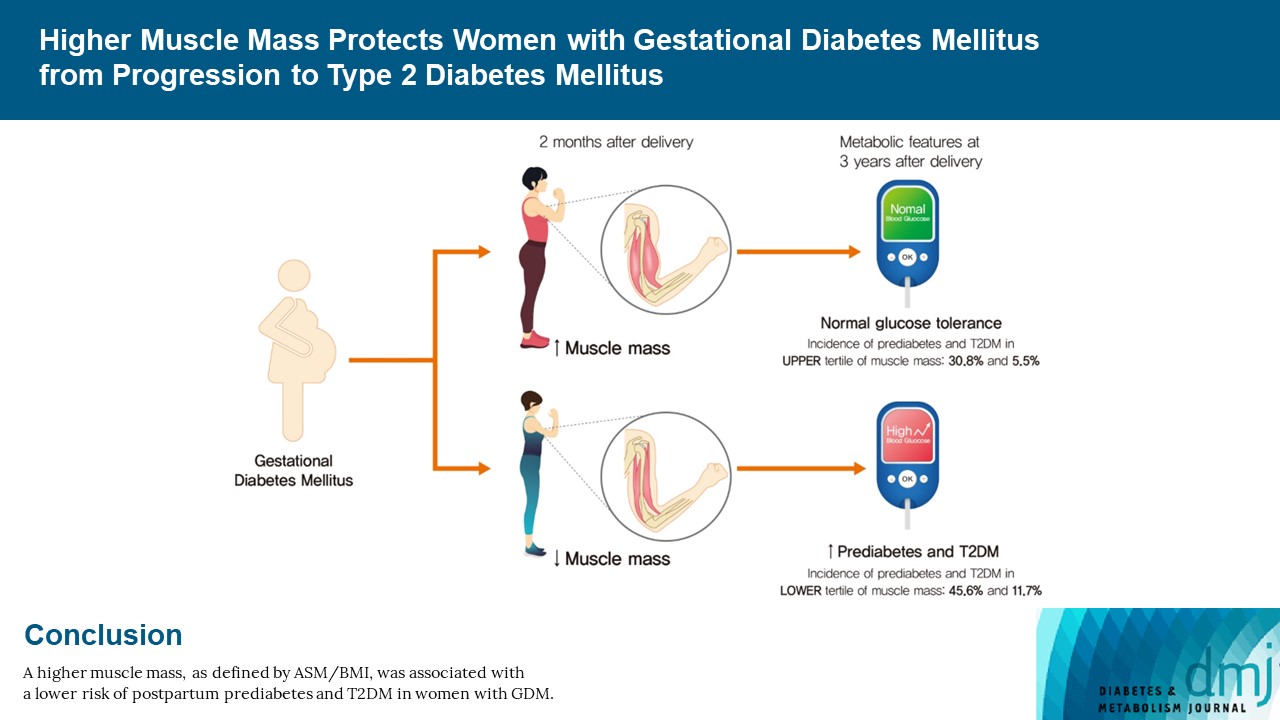
Original ArticleMetabolic Risk/Epidemiology Higher Muscle Mass Protects Women with Gestational Diabetes Mellitus from Progression to Type 2 Diabetes Mellitus
-
Yujin Shin1*
 , Joon Ho Moon1*, Tae Jung Oh1,2, Chang Ho Ahn1,2, Jae Hoon Moon1,2, Sung Hee Choi1,2, Hak Chul Jang1,2
 -
Diabetes & Metabolism Journal 2022;46(6):890-900.
DOI: https://doi.org/10.4093/dmj.2021.0334
Published online: April 28, 2022
1Department of Internal Medicine, Seoul National University Bundang Hospital, Seongnam, Korea
2Department of Internal Medicine, Seoul National University College of Medicine, Seoul, Korea
-
Corresponding author: Hak Chul Jang Department of Internal Medicine, Seoul National University Bundang Hospital, Seoul National University College of Medicine, 82 Gumi-ro 173beon-gil, Bundang-gu, Seongnam 13620, Korea E-mail: janghak@snu.ac.kr
- *Yujin Shin and Joon Ho Moon contributed equally to this study as first authors.
Copyright © 2022 Korean Diabetes Association
This is an Open Access article distributed under the terms of the Creative Commons Attribution Non-Commercial License (http://creativecommons.org/licenses/by-nc/4.0/) which permits unrestricted non-commercial use, distribution, and reproduction in any medium, provided the original work is properly cited.
ABSTRACT
-
Background
- We evaluated whether postpartum muscle mass affects the risk of type 2 diabetes mellitus (T2DM) in Korean women with gestational diabetes mellitus (GDM).
-
Methods
- A total of 305 women with GDM (mean age, 34.9 years) was prospectively evaluated for incident prediabetes and T2DM from 2 months after delivery and annually thereafter. Appendicular skeletal muscle mass (ASM) was assessed with bioelectrical impedance analysis at the initial postpartum visit, and ASM, either divided by body mass index (BMI) or squared height, and the absolute ASM were used as muscle mass indices. The risk of incident prediabetes and T2DM was assessed according to tertiles of these indices using a logistic regression model.
-
Results
- After a mean follow-up duration of 3.3 years, the highest ASM/BMI tertile group had a 61% lower risk of incident prediabetes and T2DM compared to the lowest tertile group, and this remained significant after we adjusted for covariates (adjusted odds ratio, 0.37; 95% confidence interval [CI], 0.15 to 0.92; P=0.032). Equivalent findings were observed in normal weight women (BMI <23 kg/m2), but this association was not significant for overweight women (BMI ≥23 kg/m2). Absolute ASM or ASM/height2 was not associated with the risk of postpartum T2DM.
-
Conclusion
- A higher muscle mass, as defined by the ASM/BMI index, was associated with a lower risk of postpartum prediabetes and T2DM in Korean women with GDM.
- Women with gestational diabetes mellitus (GDM) have an increased risk of developing type 2 diabetes mellitus (T2DM) compared to women with normoglycemic pregnancy [1,2]. Several risk factors for postpartum T2DM have been identified which include maternal age, body mass index (BMI), family history of diabetes, and the degree of hyperglycemia during pregnancy [1,2]. These risk factors also contribute to postpartum diabetes in the Korean population [3-5], but their attributable risk seems to vary according to ethnic groups [6-8].
- Asians develop diabetes mellitus at a lower BMI than Westerners [9,10]. A previous multiethnic study identified that Asian women had a more than three times higher prevalence of GDM in the same BMI range compared to non-Hispanic white or African American women [11]. Furthermore, following GDM, Asian women had a higher prevalence of postpartum T2DM and metabolic syndrome compared to Europeans [7]. For a given BMI, there are differences in the body composition of fat and muscle mass across the ethnic groups: Asians have more body fat at a lower BMI compared to Caucasians [12], and adiposity is well known to elevate the risk of T2DM [13]. Recent reports have suggested that low muscle mass can increase insulin resistance and diabetes risk [14,15]. Since skeletal muscle is a metabolically active organ that accounts for approximately 30% of the resting metabolic rate, reduced skeletal muscle mass can impair glucose utilization and decrease reservoir capacity [16,17]. A 9-year prospective cohort study in Korea demonstrated that middle-aged and older adults with the lowest muscle mass tertile had a more than 2-fold increased risk of T2DM after adjusting for covariates, including obesity parameters [14]. Therefore, we hypothesized that assessment of muscle mass could provide important information regarding diabetic risk especially in Asian women.
- Here, we set out to investigate if low muscle mass contributes to an increased incidence of prediabetes and T2DM in women with GDM, with the goal of offering additional information beyond BMI.
INTRODUCTION
- Study design
- This prospective observational study of women with GDM was conducted in Seoul National University Bundang Hospital. All subjects participated voluntarily, and informed consent was obtained from each subject. The Institutional Review Board of Seoul National University Bundang Hospital approved the study protocol (IRB Number: B-0503/018-001) and retrospective data analysis for this study (IRB Number: B-1909/565-106). This study was conducted according to the Declaration of Helsinki.
- Subjects were recruited from 2009 to 2018 and followed until the end of 2019. The initial postpartum follow-up visit was performed at 6 to 8 weeks postpartum, and annual follow-up visits were made thereafter to evaluate the postpartum maternal glycemic status. Subjects were censored at the onset of diabetes or the last visit of examination (or when lost to follow-up). The mean follow-up duration was 3.3 years (Supplementary Fig. 1). A total of 378 women with GDM were screened for eligibility; 305 women were eligible to participate according to the inclusion and exclusion criteria listed below. GDM was diagnosed with a 100-g oral glucose tolerance test (OGTT) at 24 to 28 weeks of gestation according to the criteria recommended by the American Diabetes Association [18]. A diagnosis of GDM was made if two or more of the following were present: fasting plasma glucose ≥95 mg/dL, postprandial (PP) 1 hour ≥180 mg/dL, PP 2 hours ≥155 mg/dL, and/or PP 3 hours ≥140 mg/dL. Subjects with a history of type 1 diabetes mellitus or T2DM, recurrent GDM, or T2DM at postpartum 2 months were excluded, and only newly diagnosed GDM subjects were included. We excluded those with an underlying medical condition, including cardiovascular disease, thyroid disease, or any condition that required concurrent medication (e.g., steroids, lipid-lowering, or anti-hypertensive agents).
- Body composition analysis
- Body composition was assessed with a direct segmental eight-point multifrequency bioelectrical impedance analysis (BIA, InBody770, Biospace Inc., Seoul, Korea) at the initial postpartum evaluation. This analysis was previously shown to have acceptable agreement with dual-energy X-ray absorptiometry (DXA) and magnetic resonance imaging [19,20]. Total fat mass and visceral fat area (VFA) were measured by BIA. VFA measured by BIA was previously reported to correlate well with that measured by computed tomography (CT), especially in Korean women with age <50 years and BMI <25 kg/m2 [21]. We employed a formula developed to approximate the VFA measured by BIA (VFA-BIA) to that measured by CT (VFACT) [21]. Estimated VFA, which was used for further analysis, is calculated as: (–142.77)+(1.40×VFA-BIA)+(–1.29×age)+(–0.98×BMI)+(2.14×waist circumference)+(–0.03×VFABIA×BMI)+(0.07×age×BMI).
- The primary muscle quantity was calculated as the appendicular skeletal muscle mass (ASM) divided by BMI, and participants were assorted into tertiles as follows: lowest, 0.51–0.66; middle, 0.67–0.73; and highest, 0.74–0.94. As secondary muscle mass measures, we examined the absolute ASM and the ASM normalized with the squared height (ASM/Ht2). These were also divided into tertiles, as follows: for ASM, lowest 11.3–15.1, middle 15.2–16.7, and highest 16.8–23.5 (kg); and for ASM/Ht2, lowest 4.60–5.93, middle 5.94–6.40, and highest 6.41-8.33 (kg/m2).
- Anthropometric and clinical parameters
- Antepartum parameters were collected at 24 to 28 weeks of gestation; these included glucose levels at OGTT and the levels of glycosylated hemoglobin (HbA1c), insulin, and C-peptide. The parameters evaluated at initial postpartum follow-up, which occurred at 6 to 8 weeks after delivery, are presented in Table 1; they included baseline anthropometric, clinical, and biochemical measurements such as maternal age, height, body weight, waist circumference, ASM, fat mass, blood pressure, and lipid profiles. Systolic and diastolic blood pressures were measured with subjects in a seated position using an electronic sphygmomanometer (UA-1020 device, A&D Co., Tokyo, Japan). We assessed physical activity after delivery. The physical activity was classified into mild, moderate, and vigorous-intensity, and we defined exercise as >150 minutes per week of moderate-intensity activity or >75 minutes per week of vigorous-intensity activity following the World Health Organization (WHO) recommendations [22]. Postpartum BMI change was defined as the difference between the BMI at the initial postpartum follow-up and that at the last visit of examination.
- Metabolic assessment
- Postpartum maternal glycemic status was evaluated with a 75-g OGTT given at 6 to 8 weeks after delivery and annually thereafter. Participants were classified into the following groups: normoglycemia; prediabetes, including impaired glucose or impaired glucose tolerance; and T2DM based on American Diabetes Association criteria [18]. HbA1c was measured using a Bio-Rad Variant II Turbo HPLC analyzer (BioRad, Hercules, CA, USA). Glucose concentrations were analyzed using the hexokinase method. Plasma concentrations of insulin and C-peptide were measured by radioimmunoassay (IZOTOP, HoilBioMed Co., Seoul, Korea). The insulinogenic index was calculated from OGTT parameters as follows: insulin (30 min)–insulin (0 min)/glucose (30 min)–glucose (0 min). Homeostasis model assessment of insulin resistance (HOMA-IR) and β-cell function (HOMA-β) were calculated [23]. Triglyceride concentrations were measured by the glycerol-3-phosphate oxidase peroxide method, and total cholesterol, high-density lipoprotein, and low-density lipoprotein were measured with a Hitachi 747 chemistry analyzer (Hitachi, Tokyo, Japan).
- Statistical analysis
- All data are expressed as the mean±standard deviation or as numbers and percentages. Analysis of variance (ANOVA) was used to compare baseline characteristics according to ASM/BMI tertiles and post hoc analysis was performed with the Bonferroni method among different groups. The incidence of prediabetes and T2DM was compared using the chi-square test and statistical significance was assessed using linear by linear association.
- The risk of incident ‘prediabetes and T2DM’ was assessed using a binary logistic regression model, and ‘prediabetes’ and ‘T2DM’ were assessed using a multinomial logistic regression model, according to the tertiles of ASM/BMI. Three models were fitted; they sequentially included the covariates from the initial postpartum follow-up, as follows. Model 1 was unadjusted; Model 2 was adjusted for maternal age, family history of diabetes, systolic blood pressure, total fat mass, and waist circumference; and Model 3 was adjusted for the variables listed in Model 2 plus breast feeding, exercise after delivery, postpartum BMI change, and the antepartum fasting plasma glucose concentration. The lowest tertile was set as the reference category. Unadjusted and adjusted odds ratios (ORs) for incident prediabetes and T2DM were calculated. The participants were stratified by their initial postpartum BMI (normal weight group, BMI <23 kg/m2; overweight group, BMI ≥23 kg/m2) for sensitivity analysis. The secondary muscle mass measures (absolute ASM and ASM/Ht2) were examined in separate models to verify the extents of association with incident prediabetes and diabetes and assess the level of consistency across the different muscle indices. All statistical analyses were performed using SPSS version 20.0 (IBM Corp., Armonk, NY, USA).
METHODS
- Clinical characteristics of the participants at the antepartum and postpartum periods
- A total of 305 women (mean age, 34.9±3.7 years) was prospectively evaluated for incident prediabetes and T2DM, with the mean follow-up duration of 3.3 years. At the 6 to 8 weeks postpartum visit, the mean BMI was 23.1±3.5 kg/m2. The ASM/BMI tertiles comprised 103, 111, and 91 women with GDM from the lowest to the highest tertiles, respectively. As shown in Table 1, the highest tertile group had lower antepartum and postpartum HbA1c as well as lower baseline postpartum BMI, waist circumference, body fat mass, blood pressures, and levels of fasting plasma glucose, insulin, C-peptide, and triglycerides, compared to the lowest tertile group.
- Incidence of prediabetes and T2DM according to ASM/BMI
- The composite incidence of prediabetes and T2DM was significantly lower in the highest ASM/BMI group, being found at 57.3%, 55.9%, and 36.3% in the lowest, middle, and highest groups, respectively (P for trend=0.004) (Table 2, Supplementary Table 1). After we adjusted for covariates such as age, family history of diabetes, blood pressure, total fat mass, waist circumference, antepartum fasting glucose concentration, breast feeding, exercise after delivery, and postpartum BMI change, the highest tertile had a 63% lower risk of developing prediabetes and T2DM (OR, 0.37; 95% confidence interval [CI], 0.15 to 0.92; P=0.032). The separate incidence of prediabetes also showed a significant association, with the risk being significantly lower in women of the highest tertile (OR, 0.36; 95% CI, 0.14 to 0.94; P=0.036). The incidence of T2DM was 72% lower in the highest group in univariate analysis (OR, 0.28; 95% CI, 0.10 to 0.82; P=0.020), but this association was attenuated after we adjusted for confounders (OR, 0.44; 95% CI, 0.06 to 30.7; P=0.437).
- We assessed the contribution of visceral fat, which is a known risk factor for T2DM [24]. Subjects with more visceral fat had a higher prevalence of postpartum prediabetes and T2DM (55.3% in the upper half vs. 45.8% in the lower half). Next, we performed multivariate logistic analysis including estimated VFA as a covariate. After we adjusted for VFA and other covariates, subjects in the highest tertile of ASM/BMI still had lower risks of developing postpartum prediabetes and T2DM (OR, 0.32; 95% CI, 0.14 to 0.72; P=0.007) (Supplementary Table 2).
- The risk of incident prediabetes and T2DM according to ASM/BMI after stratification by BMI
- For further analysis, we stratified the participants by BMI (normal weight, BMI <23 kg/m2 and overweight BMI ≥23 kg/m2) (Table 3). In the normal weight group, prediabetes and T2DM occurred at rates of 51.6%, 48.4%, and 32.9% in the lowest, middle, and highest tertiles, respectively. In a multivariate adjusted model, the highest muscle group had a 79% lower risk for developing prediabetes and T2DM (OR, 0.21; 95% CI, 0.06 to 0.77; P=0.019). However, this association was not significant for the overweight group (OR, 0.56; 95% CI, 0.10 to 3.26; P=0.522).
- Postpartum changes of HOMA-IR and HOMA-β according to ASM/BMI
- There was no significant difference in HOMA-IR across the tertiles during the antepartum period (Table 4). However, postpartum insulin resistance was lowest in the highest ASM/BMI group. HOMA-IR significantly decreased in the middle and highest tertiles from the antepartum to postpartum periods, but no statistically significant decline was seen for HOMA-IR in the lowest tertile.
- Within each tertile, HOMA-β was decreased significantly from the antepartum to postpartum periods. However, there was no statistically significant difference in the antepartum to postpartum change in HOMA-β or postpartum insulinogenic index among the different tertiles.
- Incident prediabetes and T2DM according to the absolute ASM and ASM/Ht2
- Next, we evaluated the association of absolute ASM and ASM normalized by height (ASM/Ht2) with incident prediabetes and T2DM according to the absolute ASM tertiles (Supplementary Tables 3 and 4). Of note, the highest ASM tertile group was older and had higher BMI, waist circumference, body fat mass, blood pressures, and levels of fasting plasma glucose, insulin, C-peptide, and triglycerides at baseline (Supplementary Table 3). Antepartum fasting plasma glucose and HbA1c were higher for the highest tertile compared to the lowest tertile. These metabolic phenotypes therefore showed trends opposite to those observed for ASM/BMI.
- In a crude analysis, the absolute ASM was not associated with incident prediabetes and T2DM (Supplementary Table 3). No significant associations between the absolute ASM with incident prediabetes and T2DM were found after further adjusting for covariates. In the normal weight subgroup (BMI <23 kg/m2), intriguingly, the highest ASM group had a lower risk of incident prediabetes and T2DM in a univariate analysis (OR, 0.20; 95% CI, 0.06 to 0.74; P=0.015), and this association showed marginal significance after we adjusted for covariates (OR, 0.21; 95% CI, 0.04 to 1.16; P=0.072). No such trend was observed in women with overweight or obese (BMI >23 kg/m2).
- The trends in baseline characteristics by ASM/Ht2 were similar to those seen for the absolute ASM groups: Women in the highest ASM/Ht2 tertile were older and had higher BMI, waist circumference, ASM, body fat mass, blood pressures, and levels of fasting plasma glucose, HbA1c, insulin, C-peptide, and triglycerides at baseline (Supplementary Table 4). Antepartum fasting plasma glucose and HbA1c were also increased for the highest group compared to the lowest group. Intriguingly, the incidence of prediabetes and T2DM was 46.5%, 43.0%, and 62.2% in the lowest, middle, and highest groups, respectively, which was opposite the relationship observed for ASM/BMI.
- In univariate analysis, the highest ASM/Ht2 group had an approximately 2-fold increased risk for incident prediabetes and T2DM (OR, 1.95; 95% CI, 1.10 to 3.44; P=0.022), but the association was lost after we adjusted for covariates (OR, 2.00; 95% CI, 0.73 to 5.48; P=0.176). In addition, we did not observe any significant association between ASM/Ht2 and incident prediabetes and T2DM after we adjusted for covariates following BMI stratification.
RESULTS
- This study investigated the association between postpartum muscle mass and the risk of prediabetes and T2DM in women with a previous history of GDM. Higher muscle mass defined by the ASM/BMI index was associated with lower insulin resistance after delivery and a reduced risk of prediabetes and T2DM. In a sensitivity analysis, this association was found specifically in the normal weight group (BMI <23 kg/m2). We compared different muscle indices, including ASM/BMI, absolute ASM, and ASM/Ht2, and found that maternal body parameters (e.g., body weight) highly affected the risk of postpartum prediabetes and T2DM. Our results emphasize the need to use an appropriate muscle mass index to predict metabolic outcomes in postpartum women. From our findings, we conclude that evaluation of muscle mass and adopting ASM/BMI in the postpartum period is useful for predicting future T2DM in women who had GDM, especially in a non-obese population.
- GDM is characterized by underlying maternal defects in the β-cell response to insulin resistance during pregnancy [25]. We previously reported that several genetic variants related to GDM, including CDKN2A/2B, HHEX, and CDKAL1, are associated with β-cell function and an increased risk for postpartum T2DM [26,27]. Diabetes in Asians is characterized by an underlying functional β-cell deficit that occurs years before the development of T2DM, with such individuals failing to show a proper compensatory increase in insulin secretion upon insulin resistance [28]. This partly explains the higher incidence of GDM and postpartum T2DM in Asians compared to other ethnicities at a given BMI [11,29].
- In addition to these non-modifiable factors, there are modifiable risk factors that contribute to postpartum T2DM; they include prepregnancy BMI and postpartum weight change, waist circumference, exercise, and lactation [5,27,30-32], all of which are associated with insulin resistance. Our previous study showed that women who lost weight had improvements in insulin sensitivity and the lowest incidence of T2DM, while women who gained weight showed the opposite associations during 4 years of follow-up [4]. Given that skeletal muscle is the metabolic organ that utilizes most of the glucose in the body, it is important to evaluate the association between muscle mass and progression to T2DM in GDM women.
- Muscle mass has been widely studied in association with insulin resistance and the incidence of T2DM in middle-aged and elderly populations. Low muscle mass is associated with an increased risk of T2DM and higher insulin resistance in both Koreans and Caucasians [14,15]. However, the effect of muscle mass on T2DM has been less well studied in young populations. The present study included young women at their peak of muscle mass, which begins to decrease after age 40 [33], and who were free from other comorbidities. The significant improvement in insulin sensitivity after delivery in the highest muscle mass group is consistent with our hypothesis that more muscle mass may confer a protective effect after GDM. We demonstrate that, even for a young population, relatively low muscle mass manifests as a risk for T2DM.
- Higher muscle mass is expected to improve insulin sensitivity, but women with polycystic ovary syndrome (PCOS) typically exhibit increased insulin resistance while having more muscle mass compared to women without PCOS [34,35]. To better understand the relationship between muscle mass and the risk of T2DM, we need to clarify the factors that contribute to increased muscle mass in women with PCOS (e.g., androgens, higher body weight, and/or fat mass). A recent meta-analysis reported that higher total and trunk lean tissue mass were observed in a subgroup of women with PCOS who are BMI ≥25 kg/m2, which were attributed to overweight and obesity, but not androgen or insulin resistance [36]. On the other hand, increases in total or trunk lean mass were not evident in women with BMI <25 kg/m2. This suggests that increased body weight, rather than PCOS itself, may contribute to the higher muscle mass observed in women with PCOS. In the present study, which did not exclude women with PCOS, high ASM/BMI was shown to be protective for postpartum prediabetes and T2DM after we adjusted for total fat or body weight. Nevertheless, the possible contribution of PCOS to muscle mass or insulin resistance, as well as its linking mechanisms, should be studied further.
- Asian populations develop T2DM at lower BMI than Western populations [9,10]. A previous multiethnic study including GDM women of European, Asian, and African ethnicities found an increased prevalence of impaired glucose tolerance and metabolic syndrome in Asians compared to Europeans at postpartum 20 months [7]. In addition, the relative contributions of conventional risk factors for GDM differ by ethnicity as advanced maternal age or overweight/obesity affects Chinese to a lesser extent than other ethnic groups [6]. Therefore, it is important to distinguish clinical risk factors for postpartum diabetes in Asian GDM women with relatively lower BMI, as these factors may differ from those in other ethnicities.
- Here, we stratified subjects by BMI 23 kg/m2, and found that the normal weight women (BMI <23 kg/m2) in the highest ASM/BMI group developed less prediabetes and T2DM, whereas no association or risk reduction was found in the overweight group (BMI ≥23 kg/m2). As in women with PCOS, overweight women have more muscle mass, but this excess muscle mass is considered metabolically inactive because these women are insulin resistant. Therefore, the muscle mass in overweight women was not associated with the development of postpartum glucose intolerance. The results of a previous Korean nationwide study support our finding that subjects with higher muscle mass showed improved insulin sensitivity only among lean (low fat) subjects, but this protective association of muscle mass and insulin sensitivity was attenuated in subjects with higher proportions of fat [37]. This suggests that the contribution of muscle mass to glucose metabolism may be more important in women with relatively lower BMI, but further validation studies including women with other ethnicities are required.
- Since Baumgartner first proposed the height adjusted skeletal muscle mass as a measure for representing muscle quantity [38], a number of working groups have adopted the ASM/Ht2 as a standard muscle mass index [39,40]. Meanwhile, the Foundation for the National Institutes of Health proposed ASM adjusted with BMI as having the best clinical implications for immobility and mortality [41,42]. ASM/BMI is better correlated with the age pattern in Korean women than other indices [33], but debate remains regarding the best measure for muscle mass with respect to clinical implications. Here, we compared different muscle indices to better understand the contribution of muscle mass to the development of postpartum diabetes in association with maternal body weight or BMI.
- In the present study, higher ASM/BMI was found to be a protective predictor for the composite postpartum prediabetes and T2DM. On the other hand, no association was found between the absolute ASM or ASM/Ht2 and T2DM, suggesting that there is a wide divergence between the different muscle indices. Similarly discordant findings were reported in a recent cohort study, in which absolute ASM was positively associated with incident T2DM [43]. Thus, future studies including other ethnicities are required to investigate the disparities observed in how different muscle indices are associated with metabolic outcomes, including T2DM.
- This study has several limitations. First, we used the BIA method in assessing the body composition. This may not fully reflect the actual skeletal muscle mass. However, it is a non-invasive and valid technique that provides accurate estimates of skeletal muscle mass that are closely correlated with measurements obtained using DXA and magnetic resonance imaging across ranges of age, volume status, and BMI [19,20]. Assessment of muscle mass as well as VFA using magnetic resonance imaging or CT would provide additional insights into predicting metabolic outcomes according to body composition. Second, we were unable to evaluate the contribution of muscle strength or quality to the development of postpartum glucose intolerance. The clinical implications of muscle strength have been thoroughly assessed in older adults, but future studies are needed to clarify the link between muscle strength and metabolic risk in younger populations. Third, the dietary pattern, which has been associated with the risk of postpartum diabetes, was not assessed in this study. As an alternative, we included postpartum BMI change as a covariate to reflect nutritional status, since maternal BMI has been reported to attenuate the beneficial effect of a healthy dietary pattern postpartum [44]. Fourth, due to the observational nature of this study, the follow-up duration was not uniform among the study subjects and we cannot confirm causal relationships or exclude confounding effects. The sample size was small, especially for the sensitivity analyses, which limited further assessment.
- In conclusion, the muscle mass defined by the ASM/BMI index was associated with incident prediabetes and T2DM in Korean women with GDM, independent of previously known risk factors including maternal age, glycemia during pregnancy, body fat mass, postpartum BMI change, breastfeeding, and exercise. When seeking to quantify the overall diabetes risk in women after GDM pregnancy, clinicians may find that assessing muscle quantity will help identify women at high risk for developing T2DM. Pre- and post-pregnancy aerobic and resistance exercise may help prevent postpartum diabetes by increasing muscle mass and reducing body fat, which should be further investigated through intervention studies.
DISCUSSION
SUPPLEMENTARY MATERIALS
Supplementary Table 1.
Supplementary Table 2.
Supplementary Table 3.
Supplementary Table 4.
-
CONFLICTS OF INTEREST
Tae Jung Oh was editorial board member of the Diabetes & Metabolism Journal from 2020 to 2021. Sung Hee Choi has been editorial board member of the Diabetes & Metabolism Journal since 2021. They were not involved in the review process of this article. Otherwise, there was no conflict of interest.
-
AUTHOR CONTRIBUTIONS
Conception or design: Y.S., H.C.J
Acquisition, analysis, or interpretation of data: Y.S., J.H.M., T.J.O., H.C.J.
Drafting the work or revising: Y.S., J.H.M., H.C.J.
Final approval of the manuscript: Y.S., J.H.M., T.J.O., C.H.A., J.H.M., S.H.C., H.C.J
-
FUNDING
This research was supported by the grant from Seoul National University Bundang Hospital to Hak Chul Jang (grant No. 02-2019-015).
NOTES
-
Acknowledgements
- The authors thank Division of Statistics in Medical Research Collaborating Center at Seoul National University Bundang Hospital for statistical supports.

| ASM/BMI tertiles | Lowest (n=103) | Middle (n=111) | Highest (n=91) | P value | |
|---|---|---|---|---|---|
| ASM/BMI, m2 | 0.61±0.04 | 0.70±0.02a | 0.79±0.08a,b | <0.001 | |
| Follow-up duration, yr | 3.22±2.49 | 3.27±2.58 | 3.41±2.30 | 0.899 | |
| Postpartum parameters | |||||
| Age, yr | 35.5±3.8 | 34.4±3.4 | 34.7±3.7 | 0.081 | |
| Height, cm | 156.7±4.3 | 161.3±3.9a | 164.0±4.0a,b | <0.001 | |
| Body weight, kg | 63.1±10.7 | 59.6±8.8a | 56.3±8.5a,b | <0.001 | |
| BMI, kg/m2 | 25.6±3.0 | 22.8±2.6a | 20.8±2.5a,b | <0.001 | |
| Waist circumference, cm | 86.8±10.3 | 81.4±7.5a | 79.8±7.7a | <0.001 | |
| ASM, kg | 15.7±2.0 | 15.9±1.8 | 16.5±1.9a | 0.011 | |
| Whole body fat mass, kg | 24.2±6.7 | 19.9±5.0a | 15.5±4.8a,b | <0.001 | |
| Estimated visceral fat area, cm2 | 108.8±34.2 | 85.2±29.2a | 66.9±30.9a,b | <0.001 | |
| Systolic blood pressure, mm Hg | 121.7±14.8 | 116.7±14.4a | 116.3±13.2a | 0.014 | |
| Diastolic blood pressure, mm Hg | 73.0±12.1 | 70.7±11.3 | 70.4±9.9 | 0.049 | |
| Family history of diabetes | 55 (56.7) | 52 (49.5) | 52 (58.4) | 0.840 | |
| Parity (nullipara) | 57 (58.7) | 74 (69.8) | 59 (66.3) | 0.103 | |
| Breast feeding | 51 (57.9) | 63 (62.4) | 57 (67.8) | 0.165 | |
| Exercise | 10 (9.7) | 12 (10.8) | 15 (16.5) | 0.156 | |
| Fasting plasma glucose, mg/dL | 98.6±12.5 | 95.1±10.7 | 92.6±8.9a | 0.001 | |
| PP 2 hours, mg/dL | 141.8±44.2 | 133.4±33.2 | 133.3±39.2 | 0.211 | |
| HbA1c, % | 5.6±0.4 | 5.5 ±0.4 | 5.4±0.34a | 0.003 | |
| Insulin, µIU/mL | 9.6±4.8 | 8.5±3.6 | 6.9±2.8a,b | <0.001 | |
| C-peptide, ng/mL | 2.4 ±1.3 | 2.0±1.4 | 1.5±0.7a,b | <0.001 | |
| Total cholesterol, mg/dL | 213.9±43.1 | 210.1±38.4 | 205.0±47.9 | 0.393 | |
| Triglyceride, mg/dL | 122.9±69.5 | 119.8±70.1 | 87.0±41.9a | <0.001 | |
| HDL cholesterol, mg/dL | 60.8±11.5 | 59.8±11.2 | 66.5±16.8a | 0.002 | |
| LDL cholesterol, mg/dL | 126.8±28.8 | 121.9±28.6 | 116.9±37.9 | 0.134 | |
| Antepartum parameters | |||||
| Fasting plasma glucose, mg/dL | 87.1±10.7 | 87.6±10.9 | 84.8±12.4 | 0.203 | |
| PP 1 hour, mg/dL | 191.6±23.7 | 189.8±26.9 | 195.1±27.0 | 0.362 | |
| PP 2 hours, mg/dL | 175.5±22.2 | 177.1±25.2 | 179.8±33.5 | 0.551 | |
| PP 3 hours, mg/dL | 144.1±27.2 | 145.4±26.3 | 139.7±29.5 | 0.387 | |
| HbA1c, % | 5.4±0.4 | 5.2±0.4a | 5.2±0.4a | <0.001 | |
| Insulin, µIU/mL | 11.0±5.1 | 11.2±5.7 | 10.9±6.2 | 0.590 | |
| C-peptide, ng/mL | 2.7±1.3 | 2.4±1.3 | 2.3±1.5 | 0.181 | |
| Insulin use | 29 (28.2) | 22 (19.8) | 14 (15.4) | 0.085 | |
Values are presented as mean±standard deviation or number (%). Statistical significance for linear by linear association between categorical variables was calculated using chi-square tests or ANOVA (Bonferroni method for post hoc analysis), with significance set at P<0.05.
ASM, appendicular skeletal muscle mass; BMI, body mass index; PP, postprandial glucose; HbA1c, glycosylated hemoglobin; HDL, high-density lipoprotein; LDL, low-density lipoprotein.
a Significant difference (P<0.05) compared to the lowest group,
b Compared to the middle group.
Values are presented as number (%) or odds ratio (95% confidence interval) using a logistic regression model. Model 1 is unadjusted; Model 2 is adjusted for age, family history of diabetes, systolic blood pressure, total fat mass, and waist circumference; and Model 3 is adjusted for the variables listed for Model 2 plus breast feeding, exercise after delivery, fasting plasma glucose concentration during pregnancy, and postpartum BMI change. P values are for linear by linear association analysis.
T2DM, type 2 diabetes mellitus; ASM, appendicular skeletal muscle mass; BMI, body mass index.
| Variable |
ASM/BMI tertiles |
P value | ||
|---|---|---|---|---|
| Lowest | Middle | Highest | ||
| HOMA-IR | ||||
| Antepartum | 2.35±1.08 | 2.46±1.35 | 2.20±1.35 | 0.427 |
| Postpartum | 2.36±1.35 | 2.03±1.00a | 1.57±0.67a,b | <0.001 |
| P valuec | 0.929 | <0.001 | <0.001 | |
| Mean difference | 0.01±1.48 | –0.42±1.10 | –0.64±1.31a | 0.009 |
| HOMA-β | ||||
| Antepartum | 11.1±24.0 | 10.9±14.9 | 8.2±29.1 | 0.662 |
| Postpartum | 5.64±2.43 | 5.32±2.73 | 4.96±2.23 | 0.219 |
| P valuec | 0.044 | <0.001 | 0.335 | |
| Mean difference | –5.48±24.1 | –5.60±14.4 | –3.25±30.0 | 0.764 |
| Insulinogenic index | 0.47±0.31 | 0.38±1.20 | 0.44±0.40 | 0.786 |
Values are presented as mean±standard deviation. Antepartum and postpartum values were calculated at 24 to 28 weeks of gestation and at 6 to 8 weeks after delivery, respectively. P values were calculated using ANOVA (Bonferroni method for post hoc analysis).
HOMA-IR, homeostasis model assessment of insulin resistance; HOMA-β, homeostasis model assessment of β-cell function; ASM, appendicular skeletal muscle mass; BMI, body mass index.
a Significant difference (P<0.05) compared to the lowest group,
b Compared to the middle group,
c Paired t-test from antepartum to postpartum values within each group.
- 1. Bellamy L, Casas JP, Hingorani AD, Williams D. Type 2 diabetes mellitus after gestational diabetes: a systematic review and meta-analysis. Lancet 2009;373:1773-9.ArticlePubMed
- 2. Kim C, Newton KM, Knopp RH. Gestational diabetes and the incidence of type 2 diabetes: a systematic review. Diabetes Care 2002;25:1862-8.PubMed
- 3. Jang HC. Gestational diabetes in Korea: incidence and risk factors of diabetes in women with previous gestational diabetes. Diabetes Metab J 2011;35:1-7.ArticlePubMedPMC
- 4. Moon JH, Kwak SH, Jung HS, Choi SH, Lim S, Cho YM, et al. Weight gain and progression to type 2 diabetes in women with a history of gestational diabetes mellitus. J Clin Endocrinol Metab 2015;100:3548-55.ArticlePubMed
- 5. Cho NH, Jang HC, Park HK, Cho YW. Waist circumference is the key risk factor for diabetes in Korean women with history of gestational diabetes. Diabetes Res Clin Pract 2006;71:177-83.ArticlePubMed
- 6. Pu J, Zhao B, Wang EJ, Nimbal V, Osmundson S, Kunz L, et al. Racial/ethnic differences in gestational diabetes prevalence and contribution of common risk factors. Paediatr Perinat Epidemiol 2015;29:436-43.ArticlePubMedPMC
- 7. Kousta E, Efstathiadou Z, Lawrence NJ, Jeffs JA, Godsland IF, Barrett SC, et al. The impact of ethnicity on glucose regulation and the metabolic syndrome following gestational diabetes. Diabetologia 2006;49:36-40.ArticlePubMedPDF
- 8. Moon JH, Kwak SH, Jang HC. Prevention of type 2 diabetes mellitus in women with previous gestational diabetes mellitus. Korean J Intern Med 2017;32:26-41.ArticlePubMedPMCPDF
- 9. Yoon KH, Lee JH, Kim JW, Cho JH, Choi YH, Ko SH, et al. Epidemic obesity and type 2 diabetes in Asia. Lancet 2006;368:1681-8.ArticlePubMed
- 10. Chan JC, Malik V, Jia W, Kadowaki T, Yajnik CS, Yoon KH, et al. Diabetes in Asia: epidemiology, risk factors, and pathophysiology. JAMA 2009;301:2129-40.ArticlePubMed
- 11. Hedderson M, Ehrlich S, Sridhar S, Darbinian J, Moore S, Ferrara A. Racial/ethnic disparities in the prevalence of gestational diabetes mellitus by BMI. Diabetes Care 2012;35:1492-8.ArticlePubMedPMCPDF
- 12. Deurenberg P, Deurenberg-Yap M, Guricci S. Asians are different from Caucasians and from each other in their body mass index/body fat per cent relationship. Obes Rev 2002;3:141-6.ArticlePubMed
- 13. Ohlson LO, Larsson B, Svardsudd K, Welin L, Eriksson H, Wilhelmsen L, et al. The influence of body fat distribution on the incidence of diabetes mellitus. 13.5 years of follow-up of the participants in the study of men born in 1913. Diabetes 1985;34:1055-8.ArticlePubMed
- 14. Son JW, Lee SS, Kim SR, Yoo SJ, Cha BY, Son HY, et al. Low muscle mass and risk of type 2 diabetes in middle-aged and older adults: findings from the KoGES. Diabetologia 2017;60:865-72.ArticlePubMedPDF
- 15. Srikanthan P, Karlamangla AS. Relative muscle mass is inversely associated with insulin resistance and prediabetes: findings from the third National Health and Nutrition Examination Survey. J Clin Endocrinol Metab 2011;96:2898-903.ArticlePubMed
- 16. Pedersen BK, Febbraio MA. Muscles, exercise and obesity: skeletal muscle as a secretory organ. Nat Rev Endocrinol 2012;8:457-65.ArticlePubMedPDF
- 17. DeFronzo RA, Tripathy D. Skeletal muscle insulin resistance is the primary defect in type 2 diabetes. Diabetes Care 2009;32(Suppl 2):S157-63.ArticlePubMedPMCPDF
- 18. American Diabetes Association. 2. Classification and diagnosis of diabetes: standards of medical care in diabetes-2018. Diabetes Care 2018;41(Suppl 1):S13-27.ArticlePubMedPDF
- 19. Ling CH, de Craen AJ, Slagboom PE, Gunn DA, Stokkel MP, Westendorp RG, et al. Accuracy of direct segmental multi-frequency bioimpedance analysis in the assessment of total body and segmental body composition in middle-aged adult population. Clin Nutr 2011;30:610-5.ArticlePubMed
- 20. Bosy-Westphal A, Jensen B, Braun W, Pourhassan M, Gallagher D, Muller MJ. Quantification of whole-body and segmental skeletal muscle mass using phase-sensitive 8-electrode medical bioelectrical impedance devices. Eur J Clin Nutr 2017;71:1061-7.ArticlePubMedPMCPDF
- 21. Lee DH, Park KS, Ahn S, Ku EJ, Jung KY, Kim YJ, et al. Comparison of abdominal visceral adipose tissue area measured by computed tomography with that estimated by bioelectrical impedance analysis method in Korean subjects. Nutrients 2015;7:10513-24.ArticlePubMedPMC
- 22. Bull FC, Al-Ansari SS, Biddle S, Borodulin K, Buman MP, Cardon G, et al. World Health Organization 2020 guidelines on physical activity and sedentary behaviour. Br J Sports Med 2020;54:1451-62.ArticlePubMedPMC
- 23. Matthews DR, Hosker JP, Rudenski AS, Naylor BA, Treacher DF, Turner RC. Homeostasis model assessment: insulin resistance and beta-cell function from fasting plasma glucose and insulin concentrations in man. Diabetologia 1985;28:412-9.ArticlePubMedPDF
- 24. Gastaldelli A, Miyazaki Y, Pettiti M, Matsuda M, Mahankali S, Santini E, et al. Metabolic effects of visceral fat accumulation in type 2 diabetes. J Clin Endocrinol Metab 2002;87:5098-103.ArticlePubMed
- 25. Buchanan TA, Xiang AH. Gestational diabetes mellitus. J Clin Invest 2005;115:485-91.ArticlePubMedPMC
- 26. Cho YM, Kim TH, Lim S, Choi SH, Shin HD, Lee HK, et al. Type 2 diabetes-associated genetic variants discovered in the recent genome-wide association studies are related to gestational diabetes mellitus in the Korean population. Diabetologia 2009;52:253-61.ArticlePubMedPDF
- 27. Kwak SH, Choi SH, Jung HS, Cho YM, Lim S, Cho NH, et al. Clinical and genetic risk factors for type 2 diabetes at early or late post partum after gestational diabetes mellitus. J Clin Endocrinol Metab 2013;98:E744-52.ArticlePubMed
- 28. Ohn JH, Kwak SH, Cho YM, Lim S, Jang HC, Park KS, et al. 10-Year trajectory of β-cell function and insulin sensitivity in the development of type 2 diabetes: a community-based prospective cohort study. Lancet Diabetes Endocrinol 2016;4:27-34.ArticlePubMed
- 29. Oh TJ, Kim YG, Kang S, Moon JH, Kwak SH, Choi SH, et al. Oral glucose tolerance testing allows better prediction of diabetes in women with a history of gestational diabetes mellitus. Diabetes Metab J 2019;43:342-9.ArticlePubMedPMCPDF
- 30. Moon JH, Kim H, Kim H, Park J, Choi W, Choi W, et al. Lactation improves pancreatic β cell mass and function through serotonin production. Sci Transl Med 2020;12:eaay0455.ArticlePubMedPMC
- 31. Bao W, Tobias DK, Bowers K, Chavarro J, Vaag A, Grunnet LG, et al. Physical activity and sedentary behaviors associated with risk of progression from gestational diabetes mellitus to type 2 diabetes mellitus: a prospective cohort study. JAMA Intern Med 2014;174:1047-55.ArticlePubMedPMC
- 32. Moon JH, Jang HC. Gestational diabetes mellitus: diagnostic approaches and maternal-offspring complications. Diabetes Metab J 2022;46:3-14.ArticlePubMedPMCPDF
- 33. Kim KM, Jang HC, Lim S. Differences among skeletal muscle mass indices derived from height-, weight-, and body mass index-adjusted models in assessing sarcopenia. Korean J Intern Med 2016;31:643-50.ArticlePubMedPMCPDF
- 34. Carmina E, Guastella E, Longo RA, Rini GB, Lobo RA. Correlates of increased lean muscle mass in women with polycystic ovary syndrome. Eur J Endocrinol 2009;161:583-9.ArticlePubMed
- 35. Douchi T, Yamamoto S, Oki T, Maruta K, Kuwahata R, Nagata Y. Serum androgen levels and muscle mass in women with polycystic ovary syndrome. Obstet Gynecol 1999;94:337-40.ArticlePubMed
- 36. Kazemi M, Pierson RA, Parry SA, Kaviani M, Chilibeck PD. Obesity, but not hyperandrogenism or insulin resistance, predicts skeletal muscle mass in reproductive-aged women with polycystic ovary syndrome: a systematic review and meta-analysis of 45 observational studies. Obes Rev 2021;22:e13255.ArticlePubMedPDF
- 37. Kim K, Park SM. Association of muscle mass and fat mass with insulin resistance and the prevalence of metabolic syndrome in Korean adults: a cross-sectional study. Sci Rep 2018;8:2703.ArticlePubMedPMCPDF
- 38. Baumgartner RN, Koehler KM, Gallagher D, Romero L, Heymsfield SB, Ross RR, et al. Epidemiology of sarcopenia among the elderly in New Mexico. Am J Epidemiol 1998;147:755-63.ArticlePubMed
- 39. Chen LK, Liu LK, Woo J, Assantachai P, Auyeung TW, Bahyah KS, et al. Sarcopenia in Asia: consensus report of the Asian Working Group for Sarcopenia. J Am Med Dir Assoc 2014;15:95-101.ArticlePubMed
- 40. Cruz-Jentoft AJ, Baeyens JP, Bauer JM, Boirie Y, Cederholm T, Landi F, et al. Sarcopenia: European consensus on definition and diagnosis: report of the European Working Group on Sarcopenia in Older People. Age Ageing 2010;39:412-23.PubMedPMC
- 41. McLean RR, Shardell MD, Alley DE, Cawthon PM, Fragala MS, Harris TB, et al. Criteria for clinically relevant weakness and low lean mass and their longitudinal association with incident mobility impairment and mortality: the Foundation for the National Institutes of Health (FNIH) sarcopenia project. J Gerontol A Biol Sci Med Sci 2014;69:576-83.ArticlePubMedPMC
- 42. Studenski SA, Peters KW, Alley DE, Cawthon PM, McLean RR, Harris TB, et al. The FNIH sarcopenia project: rationale, study description, conference recommendations, and final estimates. J Gerontol A Biol Sci Med Sci 2014;69:547-58.ArticlePubMedPMC
- 43. Kalyani RR, Metter EJ, Xue QL, Egan JM, Chia CW, Studenski S, et al. The relationship of lean body mass with aging to the development of diabetes. J Endocr Soc 2020;4:bvaa043.ArticlePubMedPMCPDF
- 44. Tobias DK, Hu FB, Chavarro J, Rosner B, Mozaffarian D, Zhang C. Healthful dietary patterns and type 2 diabetes mellitus risk among women with a history of gestational diabetes mellitus. Arch Intern Med 2012;172:1566-72.ArticlePubMedPMC
REFERENCES
Figure & Data
References
Citations
- More appendicular lean mass relative to body mass index is associated with lower incident diabetes in middle-aged adults in the CARDIA study
Melanie S. Haines, Aaron Leong, Bianca C. Porneala, Victor W. Zhong, Cora E. Lewis, Pamela J. Schreiner, Karen K. Miller, James B. Meigs, Mercedes R. Carnethon
Nutrition, Metabolism and Cardiovascular Diseases.2023; 33(1): 105. CrossRef - The Association of the Triglyceride and Muscle to Fat Ratio During Early Pregnancy with the Development of Gestational Diabetes Mellitus
Fang Wang, Yuan-Yuan Bao, Kang Yu
Diabetes, Metabolic Syndrome and Obesity.2023; Volume 16: 3187. CrossRef - Correlation of body composition in early pregnancy on gestational diabetes mellitus under different body weights before pregnancy
Li Xintong, Xu Dongmei, Zhang Li, Cao Ruimin, Hao Yide, Cui Lingling, Chen Tingting, Guo Yingying, Li Jiaxin
Frontiers in Endocrinology.2022;[Epub] CrossRef
 PubReader
 ePub Link
 Cite
Cite