- Current
- Browse
- Collections
-
For contributors
- For Authors
- Instructions to authors
- Article processing charge
- e-submission
- For Reviewers
- Instructions for reviewers
- How to become a reviewer
- Best reviewers
- For Readers
- Readership
- Subscription
- Permission guidelines
- About
- Editorial policy
Articles
- Page Path
- HOME > Diabetes Metab J > Volume 46(5); 2022 > Article
-
Original ArticleMetabolic Risk/Epidemiology Synergistic Interaction between Hyperuricemia and Abdominal Obesity as a Risk Factor for Metabolic Syndrome Components in Korean Population
-
Min Jin Lee1,2
 , Ah Reum Khang1,2, Yang Ho Kang1,2, Mi Sook Yun3, Dongwon Yi1,2
 -
Diabetes & Metabolism Journal 2022;46(5):756-766.
DOI: https://doi.org/10.4093/dmj.2021.0166
Published online: January 20, 2022
1Division of Endocrinology and Metabolism, Department of Internal Medicine, Pusan National University Yangsan Hospital, Pusan National University School of Medicine, Yangsan, Korea
2Research Institute for Convergence of Biomedical Science and Technology, Pusan National University Yangsan Hospital, Yangsan, Korea
3Division of Biostatistics, Research Institute for Convergence of Biomedical Science and Technology, Pusan National University Yangsan Hospital, Yangsan, Korea
- Corresponding author: Dongwon Yi, https://orcid.org/0000-0003-3574-036X, Department of Internal Medicine, Pusan National University Yangsan Hospital, Pusan National University School of Medicine, 20 Geumo-ro, Mulgeum-eup, Yangsan 50612, Korea E-mail: drwonny@gmail.com
Copyright © 2022 Korean Diabetes Association
This is an Open Access article distributed under the terms of the Creative Commons Attribution Non-Commercial License (https://creativecommons.org/licenses/by-nc/4.0/) which permits unrestricted non-commercial use, distribution, and reproduction in any medium, provided the original work is properly cited.
ABSTRACT
-
Background
- The present study investigated the role of synergistic interaction between hyperuricemia and abdominal obesity as a risk factor for the components of metabolic syndrome.
-
Methods
- We performed a cross-sectional study using the data of 16,094 individuals from the seventh Korean National Health and Nutrition Examination Survey (2016 to 2018). The adjusted odds ratios of metabolic syndrome and its components were analyzed by multivariate logistic regression analysis. The presence of synergistic interaction between hyperuricemia and abdominal obesity was evaluated by calculating the additive scales—the relative excess risk due to interaction, attributable proportion due to interaction, and synergy index (SI).
-
Results
- There was a synergistic interaction between hyperuricemia and abdominal obesity in hypertriglyceridemia (men: SI, 1.39; 95% confidence interval [CI], 1.01 to 1.98; women: SI, 1.61; 95% CI, 1.02 to 2.69), and low high-density lipoprotein cholesterol (HDL-C) (men: SI, 2.03; 95% CI, 1.41 to 2.91; women: SI, 1.70; 95% CI, 1.05 to 2.95). There was no significant synergistic interaction between hyperuricemia and abdominal obesity for the risk of high blood pressure (men: SI, 1.22; 95% CI, 0.85 to 1.77; women: SI, 1.53; 95% CI, 0.79 to 2.97), and hyperglycemia (men: SI, 1.03; 95% CI, 0.72 to 1.47; women: SI, 1.39; 95% CI, 0.75 to 2.57).
-
Conclusion
- Hyperuricemia and abdominal obesity synergistically increased the risk of hypertriglyceridemia and low HDL-C in both sexes.
- Uric acid, an inert metabolic end-product of purine metabolism, is known to be the main culprit of gout, uric acid nephrolithiasis, and nephropathy. In the past few years, studies have investigated the association of hyperuricemia with chronic diseases such as hypertension, diabetes, metabolic syndrome (MetS), chronic kidney disease, and cardiovascular disease [1–4]. The prevalence of the aforementioned chronic diseases and hyperuricemia is increasing with obesity because of dietary and lifestyle changes [5,6].
- MetS is a cluster of cardiometabolic risk factors, such as abdominal obesity, elevated blood pressure (BP), impaired fasting glucose, and abnormal lipid levels. Although abdominal obesity is the key feature of MetS, the pathogenesis of this complex condition has not been fully understood in terms of the association among various factors or interaction among metabolic disorders [7–9]. Epidemiological and experimental studies have suggested that hyperuricemia may be closely related to the development and pathogenesis of MetS [10,11].
- Recently, serum uric acid has been demonstrated to be strongly associated with visceral adiposity, the major cause of insulin resistance and MetS [12,13]. Higher amounts of both visceral and liver fat were associated with hyperuricemia, independent of other adipose depots [14]. A Japanese cross-sectional study confirmed the relationship between hyperuricemia and normal-weight central obesity among middle-aged adults [15]. Abdominal obesity was a major factor associated with the increased prevalence of MetS, and half of the individuals with hyperuricemia had abdominal obesity in Korean population studies [16,17]. However, few studies have investigated the synergistic interaction between hyperuricemia and abdominal obesity as a risk factor for MetS components. Therefore, we speculated that a synergistic interaction between hyperuricemia and abdominal obesity increased the risk of MetS components. In the present study, we investigated whether the combined effect of hyperuricemia and abdominal obesity on MetS components exceeded the sum of their individual effects using the seventh Korea National Health and Nutrition Examination Survey (KNHANES) data.
INTRODUCTION
- Study population
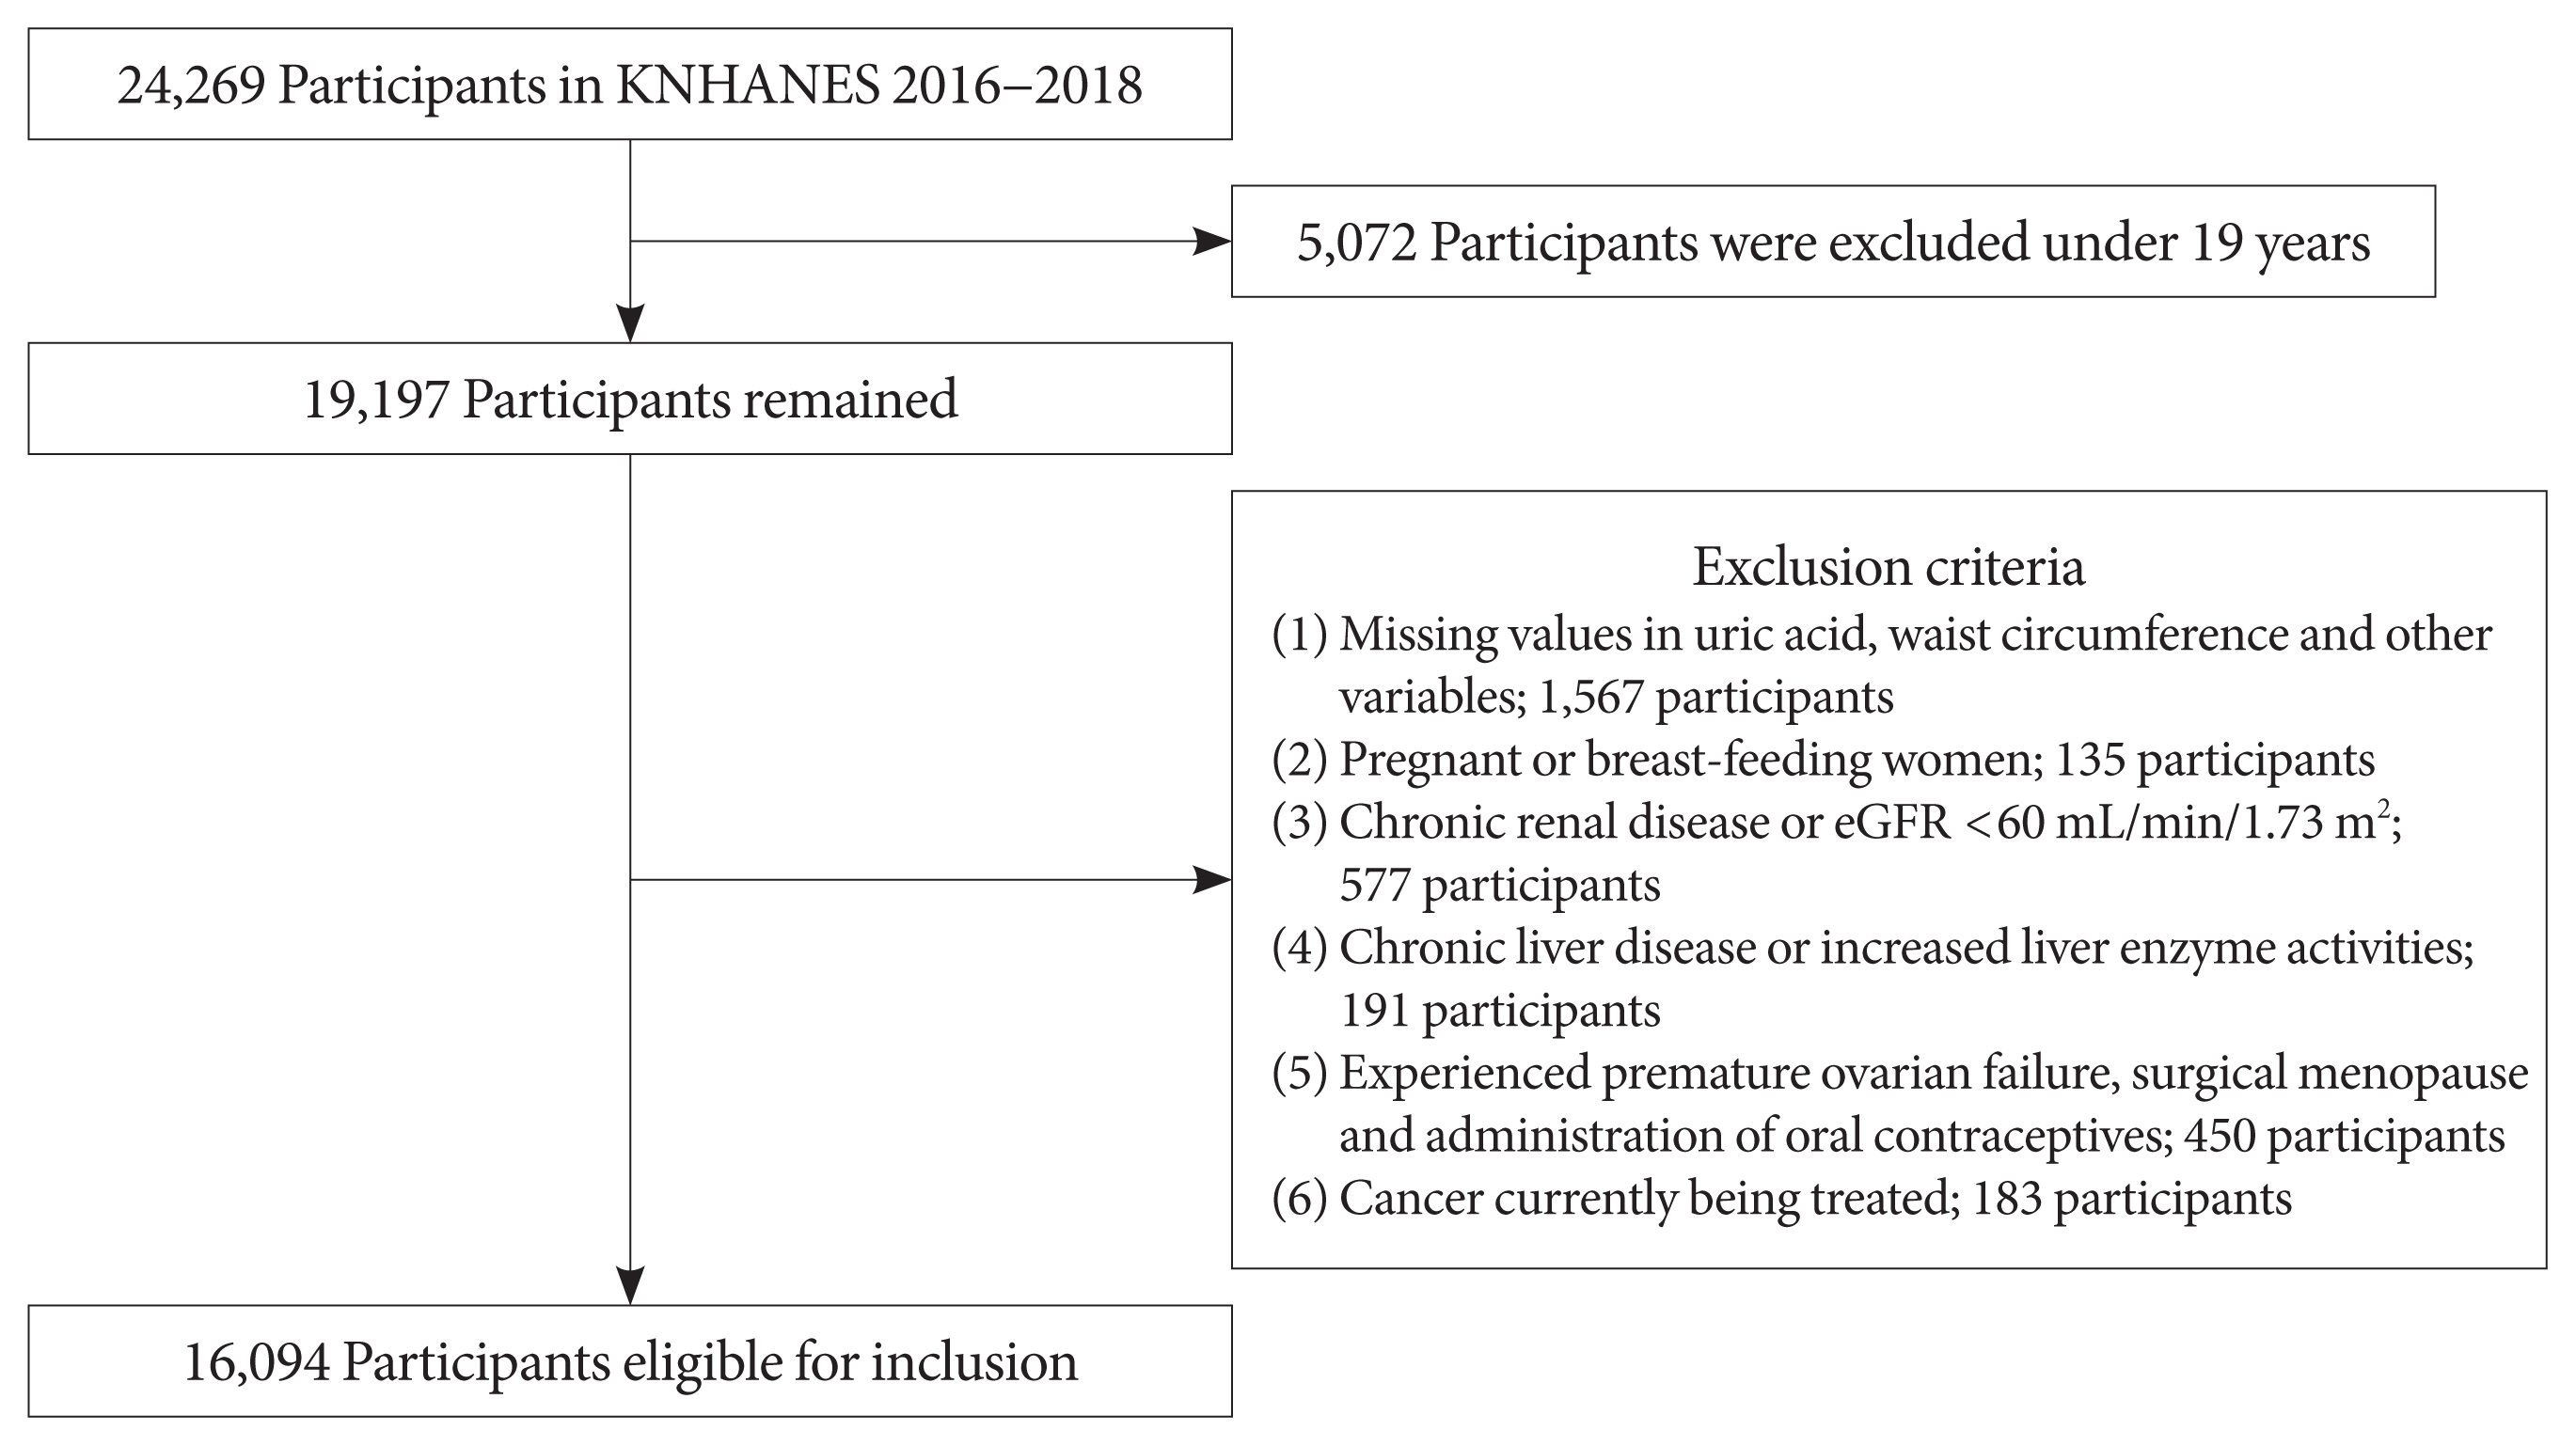
- The KNHANES, a large-scale cross-sectional survey performed using a stratified, multi-stage probability sampling method, is the representative database of the Korean population. We used data from the seventh KNHANES, which was conducted from 2016 to 2018 [18]. Of the 24,269 participants, 19,197 aged >19 years were examined. Exclusion criteria were as follows: (1) missing data on uric acid, waist circumference (WC), and other variables; (2) pregnant or breast-feeding women; (3) a previous diagnosis of chronic renal disease by a physician or an estimated glomerular filtration rate (eGFR) of <60 mL/min/1.73 m2; (4) a previous diagnosis of chronic liver disease by a physician or increased serum liver enzyme activities (e.g., aspartate aminotransferase or alanine aminotransferase >100 IU/L); (5) premature ovarian failure, surgical menopause, and administration of oral contraceptives; and (6) ongoing cancer treatment. Finally, 16,094 individuals were enrolled in the study (Fig. 1).
- All participants provided written informed consent. The KNHANES was approved by the Institutional Review Board of the Korea Centers for Disease Control and Prevention. The study protocol was approved by the Institutional Review Board of Pusan National University (IRB no. 05-2020-208).
- Data collection and measurement
- The KNHANES data included health interviews, health examinations, and nutritional surveys. Sociodemographic factors and medical history were assessed using data from self-reported questionnaires and personal interviews with trained staff, including smoking status, amount of alcohol intake, physical activity, past medical history, household income level, education level, and menopausal status.
- Anthropometric measurements were obtained by trained nurses. WC was measured at the midpoint between the lower rib margin and the iliac crest during exhalation. Body mass index (BMI) was calculated as weight (kg) divided by the square of height (m2). After resting for 5 minutes in the sitting position, BP was measured using a mercury sphygmomanometer.
- Blood samples of all participants were obtained after an 8-hour fasting and laboratory tests were conducted at a central laboratory. Low-density lipoprotein cholesterol (LDL-C) levels were calculated using the Friedewald formula [19]. If the triglyceride (TG) level was >200 mg/dL, LDL-C levels were measured directly. The eGFR was calculated using the Modification of Diet in Renal Disease equation [20].
- Participants were categorized into three groups as never smokers, ex-smokers, or current smokers based on the smoking history and as nondrinkers, light drinkers (<30 g/day), and moderate-to-heavy drinkers (≥30 g/day) based on the amount of alcohol consumption per day. Subjects who performed >150 minutes of moderate-intensity activity or ≥75 minutes of vigorous intensity activity per week were considered as physically active. Diabetes was defined as a fasting plasma glucose (FPG) level of ≥126 mg/dL or use of antidiabetic medication due to a previous diagnosis of diabetes. Hypertension was defined as a systolic BP of ≥140 mm Hg, diastolic BP of ≥90 mm Hg, or use of antihypertensive medication.
- Definitions
- Hyperuricemia was defined as a serum uric acid level of ≥7.0 mg/dL in men and ≥6.0 mg/dL in women [4]. MetS was defined according to the revised National Cholesterol Education Program and Adult Treatment Panel III criteria [21]. It was diagnosed when an individual had three or more of the following components: (1) abdominal obesity: WC ≥90 cm in men or ≥85 cm in women, according to the Korean Society of Obesity [22]; (2) high BP: systolic BP ≥130 mm Hg and/or diastolic BP ≥85 mm Hg or use of antihypertensive medications; (3) hyperglycemia: FPG ≥100 mg/dL or use of antidiabetic medications; (4) hypertriglyceridemia: TG ≥150 mg/dL or medication use; (5) low high-density lipoprotein cholesterol (HDL-C): HDL-C <40 mg/dL in men and <50 mg/dL in women or medication use. As individuals with a previous physician diagnosis of hypertension or type 2 diabetes mellitus who did not report medication use might be in remission from these conditions or might have recall bias (since it is self-reported data), they were not allocated to the high BP or hyperglycemia group, respectively.
- Statistical analysis
- Statistical analyses were performed considering the stratified multi-stage probability sampling design of the seventh KNHANES to represent the general population of Korea. We used the integrated weights from 2016 to 2018 for the analysis. Participant characteristics were compared using the complex sample generalized linear model for continuous variables and complex sample crosstabs analysis for categorical variables. Continuous variables are presented as weighted mean±stan-dard error, and categorical variables are presented as the number of cases with a weighted percentage. The odds ratios (ORs) of MetS and its components were calculated using the weighted logistic regression analysis. We assessed the synergistic interaction using three additive scales: the relative excess risk due to interaction (RERI), attributable proportion due to interaction (AP), and synergy index (SI) [23]. The additive scales may better reflect biological interactions than the multiplicative scale [24]. Therefore, we calculated three indices of additive scales. The RERI can be interpreted as the additional risk due to interaction and is calculated as the difference between the expected and observed risks: RERI=OR11−OR10−OR01+1, where OR11 refers to the OR of MetS component for the exposure of two factors, hyperuricemia and abdominal obesity; OR10 is the OR of MetS component for hyperuricemia without abdominal obesity; OR01 is the OR of MetS component for abdominal obesity without hyperuricemia. The AP is the proportion of disease that is due to the interaction among individuals with both exposures: AP=RERI/OR11. The SI can be interpreted as excess risk from exposure to both factors when there is interaction relative to the risk from exposure without interaction: SI= (OR11−1)/[(OR10−1)+(OR01−1)]. A confidence interval (CI) of >0 for RERI, >0 for AP, and >1 for SI indicates a statistically significant synergistic interaction between the two factors. SI dose not vary across strata, which suggests that it is the measure of choice in multivariate models [25]. A two-tailed P value of <0.05 was considered statistically significant. Statistical Analysis Software version 9.4 (SAS Institute, Cary, NC, USA) was used for all calculations and analyses.
METHODS
- Baseline characteristics
- A total of 16,094 individuals were enrolled in the study. The baseline characteristics of the study population stratified by sex and uric acid levels are presented in Table 1. Men in the hyperuricemia group were younger than those in the normouricemia group, whereas women in the hyperuricemia group were older than those in the normouricemia group. The hyperuricemia group was more likely to have unfavorable metabolic risk factors such as high BMI, WC, systolic/diastolic BP, TG, LDL-C, and lower HDL-C levels than the normouricemia group. In the hyperuricemia group, women had high FPG and glycosylated hemoglobin (HbA1c) levels and men had low FPG and HbA1c levels. A total of 44.4% of men and 53% of women in the hyperuricemia group had MetS. Almost half of the hyperuricemia group had abdominal obesity (men 43.3%; women 50%). The prevalence of all components of MetS was higher among the women of the hyperuricemia group than among those of the normouricemia group. The prevalence of hyperglycemia was not significantly different between men of the two groups. Baseline characteristics of the study population stratified by sex, the uric acid level, and WC are presented in Supplementary Tables 1 and 2.
- Association between hyperuricemia and the MetS components according to abdominal obesity
- The comparison of adjusted ORs for MetS components between the hyperuricemia and normouricemia groups is presented in Table 2. The prevalence of MetS (OR, 1.88; 95% CI, 1.55 to 2.29 in men; and OR, 2.31; 95% CI, 1.63 to 3.25 in women) and its components, except hyperglycemia in men (OR, 1.17; 95% CI, 0.96 to 1.42) and abdominal obesity in women (OR, 1.34; 95% CI, 0.92 to 1.95), was significantly higher in the hyperuricemia group than in the normouricemia group. Furthermore, we investigated the associations between hyperuricemia and MetS components according to abdominal obesity. Among men without abdominal obesity, those with hyperuricemia had significantly higher odds for high BP (OR, 1.63; 95% CI, 1.31 to 2.03) and hyperglycemia (OR, 1.25; 95% CI, 1.03 to 1.59), whereas among men with abdominal obesity, those with hyperuricemia had lower and statistically non-significant odds for high BP (OR, 1.24; 95% CI, 0.95 to 1.61) and hyperglycemia (OR, 1.09; 95% CI, 0.81 to 1.46). Among women with abdominal obesity, those with hyperuricemia did not have statistically significant odds for hyperglycemia (OR, 1.44; 95% CI, 0.94 to 2.18).
- Synergistic interaction effect between hyperuricemia and abdominal obesity on the MetS components
- Individuals were categorized into four groups based on the serum uric acid level and WC: Group A (control group; normouricemia without abdominal obesity), Group B (hyperuricemia without abdominal obesity), Group C (normouricemia with abdominal obesity), and Group D (hyperuricemia with abdominal obesity). The comparison of baseline characteristics between these four groups are presented in Supplementary Tables 1 and 2. The adjusted ORs for MetS components are presented in Table 3. Compared with Group A, Group D had a significantly increased risk of MetS components in both men and women. The risk of high BP, hypertriglyceridemia, and low HDL-C components was approximately four times and the risk of hyperglycemia was approximately three times among men of Group D than Group A. Compared with women of Group A, women of Group D had approximately six times the risk of hyperglycemia and hypertriglyceridemia, five times the risk of high BP, and four times the risk of low HDL-C. The results of the post hoc analysis for the risk of metabolic components between the four groups are presented in Supplementary Table 3.
- We further analyzed the additive scales to investigate whether the combined effect of hyperuricemia and abdominal obesity on the risk of MetS components exceeded the sum of their individual effects. The results are presented in Table 4 and Fig. 2. In both sexes, synergistic interaction was statistically significant between hyperuricemia and abdominal obesity for the risk of hypertriglyceridemia (men [SI, 1.39; 95% CI, 1.01 to 1.98], women [SI, 1.61; 95% CI, 1.02 to 2.69]), and low HDL-C (men [SI, 2.03; 95% CI, 1.41 to 2.91], women [SI, 1.70; 95% CI, 1.05 to 2.95]) although RERI values for these components were not significant. In other words, among men, the risk of hypertriglyceridemia from exposure to both hyperuricemia and abdominal obesity when there was interaction was 1.39 times higher than the sum of their individual risk from exposure without interaction. There was no significant synergistic interaction between hyperuricemia and abdominal obesity for the risk of high BP and hyperglycemia in either sex.
RESULTS
- In this population-based cross-sectional study using data from the seventh KNHANES, we found that individuals with hyperuricemia had significantly higher odds for MetS and its components, except hyperglycemia in men and abdominal obesity in women. These trends were almost preserved even after dividing individuals based on abdominal obesity. Furthermore, we observed a significant synergistic effect of hyperuricemia and abdominal obesity on the odds for MetS components, such as hypertriglyceridemia and low HDL-C, in both sexes.
- Studies have proposed several experimental mechanisms of hyperuricemia that contribute to MetS. The main mechanism was the deleterious effect of uric acid on endothelial cells through overproduction of reactive oxygen species caused by the enzymatic effect of xanthine oxidase [26,27]. The relationship between MetS and hyperuricemia may be linked to insulin resistance. Hyperuricemia-induced oxidative stress in adipose tissue can induce adipose tissue inflammation and is considered a cause of insulin resistance [28]. In addition, uric acid might have a detrimental effect on pancreatic islet cells and hepatocytes because of direct oxidative stress [29]. Thus, based on these mechanisms, previous epidemiological studies have demonstrated that hyperuricemia is associated with MetS [30,31]. In this study, we investigated the effect of hyperuricemia on the risk of MetS and its components and reported the ORs for MetS in the hyperuricemia group (OR, 1.88 for men and 2.31 for women).
- Hyperuricemia and abdominal obesity had a synergistic effect on the risk of hypertriglyceridemia and low HDL-C. This result might be attributed to almost the same or slightly increased ORs for hypertriglyceridemia and low HDL-C in individuals with abdominal obesity compared to those without (Table 2). These findings are supported by a prospective study that suggested that abnormal TG and HDL-C had a greater influence on serum uric acid than the other components [32]. Zhang et al. [33] investigated the combined effect of obesity and elevated uric acid level on nonalcoholic fatty liver disease (NAFLD) and MetS components using the additive scales and reported that obesity and elevated uric acid level synergistically interacted to increase the risk of NAFLD and hypertriglyceridemia in both sexes. Zhang et al. [33] and our findings suggest that a strong and more stable synergistic interaction exists between hyperuricemia and obesity for hypertriglyceridemia than other MetS components. The different synergistic effects of these two factors on other MetS components in Zhang et al. [33] and our studies might be because of differences in the study populations, definition of obesity, adjusted variables, and additive scales. Few studies have been conducted to draw a consistent synergistic interaction between these two factors on MetS components.
- In our study, synergistic interaction was not significant between hyperuricemia and abdominal obesity in hyperglycemia. This result might be attributed to lower and statistically non-significant odds for hyperglycemia in individuals with abdominal obesity compared to those without (Table 2). Although hyperuricemia contributes to insulin resistance through various mechanisms, there is a conflicting evidence on the association between the serum uric acid level and hyperglycemia or diabetes. Choi and Ford [34] showed that the fasting glucose level has a bell-shaped relationship with the serum uric acid level. They suggested that individuals with diabetes or highly elevated HbA1c levels were at a lower risk for hyperuricemia. Similarly, a study involving the Korean population reported that hyperuricemia was associated with a decreased prevalence of diabetes mellitus in men [35]. In insulin resistance or hyperinsulinemia, insulin might increase sodium and uric acid reabsorption, resulting in increased serum uric acid levels [36]. However, in individuals with diabetes or high glucose levels, glucose competitively inhibits uric acid reabsorption in the proximal renal tubule, resulting in decreased serum uric acid levels [37]. These results can be explained by the uricosuric effect of glycosuria that occurs when the blood glucose level is >180 mg/dL (10 mmol/L) [38]. In the current study, individuals with abdominal obesity had higher FPG and HbA1c levels and diabetes percentage compared to individuals without abdominal obesity (Supplementary Tables 1 and 2). Therefore, individuals with abdominal obesity might have a greater uricosuric effect of glycosuria due to elevated glucose levels compared to individuals without abdominal obesity. These assumptions could explain the lack of a significant synergistic interaction between hyperuricemia and abdominal obesity in hyperglycemia in our study.
- We also demonstrated that there was no significant synergistic interaction between hyperuricemia and abdominal obesity for the risk of high BP. This result might be attributed to the lower and statistically non-significant odds for high BP in men with abdominal obesity compared to those in men without abdominal obesity (Table 2). In addition, this result might be attributed to the lower and narrowly significant OR (1.58; 95% CI, 1.02 to 2.44; P=0.041) for high BP in women with abdominal obesity compared to the OR (1.97; 95% CI, 1.24 to 3.12; P=0.004) for high BP in women without abdominal obesity. Palmer et al. [39] demonstrated no evidence of causal effects of hyperuricemia on the risk of ischemia heart disease or raised BP by Mendelian randomization results. They suggested that BMI was an important confounding factor for observational association analyses of uric acid. Lee et al. [40] showed that there was an age-differential association between serum uric acid and incident hypertension among Koreans. They suggested that there was a significant linear association between serum uric acid and incident hypertension in younger people, but no significant association in older people. In the current study, individuals with abdominal obesity were older than those without abdominal obesity (men [47.37±0.39 and 45.12±0.28, respectively; P<0.001], women [56.44±0.46 and 45.3±0.29, respectively; P<0.001]). This result might attenuate the association between hyperuricemia and high BP in individuals with abdominal obesity. Further studies are needed to clarify the confounding role of abdominal obesity on the effect of hyperuricemia on BP.
- Serum uric acid levels can be elevated by enhanced purine catabolism in adipose tissues and by underexcretion of serum uric acid through the kidney in individuals with obesity and hyperinsulinemia [41,42]. Inversely, hyperuricemia-induced oxidative stress in adipose tissues can aggravate the inflammation of adipocytes and deteriorate insulin resistance [26]. These bidirectional causal effects suggest the presence of a synergistic interaction between hyperuricemia and abdominal obesity, reflecting insulin resistance. Based on these proposals, we assumed the presence of an additive or synergistic effect of hyperuricemia and abdominal obesity that is directly related to insulin resistance, on MetS components. We demonstrated that the synergistic interaction between hyperuricemia and abdominal obesity increased the risk of hypertriglyceridemia and low HDL-C by calculating the additive scales. Few epidemiological and experimental studies have investigated the interaction between these two factors. Hyperuricemia is commonly accompanied by abdominal obesity, and therefore, further studies are required to identify the interaction between these two factors.
- This study has several limitations. This study was based on a cross-sectional survey and therefore, could not clarify the causal relationship. As the sociodemographic factors and medical history were assessed by self-reported questionnaires and personal interviews, recall bias might have existed even if these interviews were conducted by trained staff. We defined abdominal obesity by WC, as a surrogate marker of abdominal fat mass. Although WC reflects both visceral fat and subcutaneous abdominal fat, it is a better predictor of visceral fat than BMI [43]. Recent studies suggested an important role for muscle mass and strength in the development of insulin resistance, independently of abdominal fat [44,45]. Unfortunately the seventh KNHANES did not investigate muscle mass and fat mass status. The data on the history of gout and the use of urate-lowering agents and other medications that could affect serum uric acid levels were lacking. In addition, we did not consider the details of dietary intake, such as purine sources, and used dichotomized serum uric acid levels. Therefore, we could not determine the metabolic effects of continuous serum uric acid levels. We revealed a synergistic interaction using SI values, although we calculated all additive scales. This is reasonable because the SI dose not vary across strata and is the measure of choice in multivariate models [25]. We could not include MetS as a dependent variable in Table 3 because abdominal obesity was an independent variable and a component of MetS, simultaneously. Similarly, the synergistic interaction between hyperuricemia and abdominal obesity for MetS could not be investigated in Table 4 because additive scales were calculated by the ORs of groups B, C, and D for MetS. Despite these limitations, the strength of this study is that this is the first large-scale study to show the effects of hyperuricemia on the risk of MetS and its components and the synergistic effect of hyperuricemia and abdominal obesity on the risk of MetS components. In addition, we systematically analyzed these effects based on sex and adjusted for several relevant variables. This study used a nationally representative sample and showed the clinical significance of the coexistence of hyperuricemia and abdominal obesity in the Korean population.
- In conclusion, hyperuricemia and abdominal obesity synergistically increased the risk of metabolic components, such as hypertriglyceridemia and low HDL-C, in both sexes. In other words, abdominal obesity worsened the association of hyperuricemia with hypertriglyceridemia and low HDL-C. Since hyperuricemia is commonly accompanied by abdominal obesity, aggressive diagnosis and treatment of dyslipidemia and strict weight control in individuals with both hyperuricemia and abdominal obesity are required.
DISCUSSION
SUPPLEMENTARY MATERIALS
-
Acknowledgements
- None
ACKNOWLEDGMENTS
-
CONFLICTS OF INTEREST
Dongwon Yi has been editorial board member of the Diabetes & Metabolism Journal since 2021. He was not involved in the review process of this article. Otherwise, there was no conflict of interest.
-
AUTHOR CONTRIBUTIONS
Conception or design: M.J.L.
Acquisition, analysis, or interpretation of data: M.J.L, M.S.Y.
Drafting the work or revising: M.J.L, A.R.K., Y.H.K., D.Y.
Final approval of the manuscript: M.J.L, A.R.K., Y.H.K., M.S.Y., D.Y.
-
FUNDING
This study was supported by a 2020 research grant from Pusan National University Yangsan Hospital.
NOTES


| Characteristic | Men (n=7,256) | Women (n=8,838) | ||||
|---|---|---|---|---|---|---|
|
|
|
|||||
| Normouricemia (n=5,920) | Hyperuricemiaa (n=1,336) | P value | Normouricemia (n=8,332) | Hyperuricemia (n=506) | P value | |
| Age, yr | 46.91±0.27 | 41.45±0.42 | <0.001 | 47.75±0.29 | 50.17±0.96 | 0.012 |
|
|
||||||
| BMI, kg/m2 | 24.22±0.05 | 25.77±0.11 | <0.001 | 23.12±0.05 | 26.07±0.23 | <0.001 |
|
|
||||||
| WC, cm | 85.33±0.14 | 88.72±0.3 | <0.001 | 77.63±0.16 | 85.12±0.58 | <0.001 |
|
|
||||||
| SBP, mm Hg | 119.38±0.25 | 121.18±0.42 | <0.001 | 114.87±0.26 | 120.88±1.08 | <0.001 |
|
|
||||||
| DBP, mm Hg | 77.99±0.17 | 80.8±0.34 | <0.001 | 73.36±0.14 | 76.69±0.57 | <0.001 |
|
|
||||||
| FPG, mg/dL | 102.95±0.43 | 99.67±0.51 | <0.001 | 97.01±0.26 | 101.59±1.12 | <0.001 |
|
|
||||||
| HbA1c, % | 5.69±0.01 | 5.54±0.02 | <0.001 | 5.58±0.01 | 5.77±0.05 | <0.001 |
|
|
||||||
| TG, mg/dL | 153.03±2.09 | 207.04±6.98 | <0.001 | 108.45±1.01 | 155.13±5.69 | <0.001 |
|
|
||||||
| HDL-C, mg/dL | 48.09±0.18 | 44.97±0.33 | <0.001 | 55.26±0.19 | 50.71±0.68 | <0.001 |
|
|
||||||
| LDL-C, mg/dL | 114.97±0.5 | 119.8±0.99 | <0.001 | 116.51±0.43 | 125.26±1.85 | <0.001 |
|
|
||||||
| TC, mg/dL | 190.56±0.58 | 199.67±1.25 | <0.001 | 192.84±0.48 | 204.87±1.93 | <0.001 |
|
|
||||||
| Uric acid, mg/dL | 5.44±0.02 | 7.79±0.02 | <0.001 | 4.25±0.01 | 6.55±0.03 | <0.001 |
|
|
||||||
| eGFR, mL/min/1.73 m2 | 96.54±0.35 | 92.17±0.51 | <0.001 | 101.48±0.32 | 92.2±1.04 | <0.001 |
|
|
||||||
| Smoking | 0.134 | 0.004 | ||||
| Never smoker | 1,427 (25.5) | 318 (27.1) | 7,408 (87.7) | 433 (85.2) | ||
| Ex-smoker | 2,431 (37.1) | 501 (33.6) | 494 (6.3) | 24 (4.8) | ||
| Current smoker | 2,061 (37.4) | 517 (39.3) | 429 (6.0) | 49 (10.0) | ||
|
|
||||||
| Alcohol intake | <0.001 | 0.006 | ||||
| Nondrinker | 1,043 (15.1) | 155 (10.8) | 2,842 (30.5) | 172 (29.4) | ||
| Light drinker | 4,006 (69.6) | 896 (69.3) | 5,303 (66.8) | 310 (65.0) | ||
| Moderate-to-heavy drinker | 870 (15.3) | 285 (19.9) | 186 (2.7) | 24 (5.6) | ||
|
|
||||||
| Physically active | 1,296 (24.2) | 348 (29.0) | 0.005 | 1,139 (14.8) | 76 (17.7) | 0.156 |
|
|
||||||
| Household income | 0.045 | 0.178 | ||||
| Low | 671 (16.3) | 205 (19.9) | 992 (16.7) | 60 (15.4) | ||
| Middle | 2,985 (56.4) | 669 (53.5) | 4,153 (55.6) | 271 (60.8) | ||
| High | 1,498 (27.3) | 335 (26.6) | 2,116 (27.8) | 104 (23.8) | ||
|
|
||||||
| Education level | <0.001 | 0.002 | ||||
| Elementary school or less | 809 (9.5) | 105 (4.8) | 1,962 (42.7) | 146 (24.0) | ||
| Middle school | 579 (8.6) | 104 (6.7) | 789 (8.9) | 67 (12.5) | ||
| High school | 1,883 (36.1) | 432 (37.4) | 2,347 (32.2) | 148 (32.0) | ||
| College or more | 2,337 (45.9) | 617 (51.2) | 2,863 (39.6) | 127 (31.5) | ||
|
|
||||||
| Postmenopause | - | - | - | 4,201 (42.7) | 308 (52.7) | <0.001 |
|
|
||||||
| Diabetes | 960 (13.4) | 124 (7.3) | <0.001 | 909 (9.2) | 89 (15.1) | <0.001 |
|
|
||||||
| Hypertension | 2,003 (29.0) | 496 (33.1) | 0.010 | 2,278 (22.5) | 244 (40.7) | <0.001 |
|
|
||||||
| Abdominal obesityb | 1,751 (28.4) | 601 (43.3) | <0.001 | 2,051 (21.7) | 268 (50.0) | <0.001 |
|
|
||||||
| High BPc | 2,753 (41.9) | 701 (49.8) | <0.001 | 2,903 (29.6) | 284 (48.8) | <0.001 |
|
|
||||||
| Hyperglycemiad | 2,973 (43.9) | 661 (43.7) | 0.883 | 3,098 (32.1) | 307 (53.7) | <0.001 |
|
|
||||||
| Hypertriglyceridemiae | 2,539 (41.8) | 761 (56.2) | <0.001 | 2,450 (26.0) | 259 (47.9) | <0.001 |
|
|
||||||
| Low HDL-Cf | 1,452 (22.9) | 445 (32.8) | <0.001 | 3,101 (34.9) | 277 (52.4) | <0.001 |
|
|
||||||
| MetSg | 2,093 (31.6) | 639 (44.4) | <0.001 | 2,436 (24.6) | 299 (53.0) | <0.001 |
Values are presented as mean±standard error or number (%).
BMI, body mass index; WC, waist circumference; SBP, systolic blood pressure; DBP, diastolic blood pressure; FPG, fasting plasma glucose; HbA1c, glycosylated hemoglobin; TG, triglyceride; HDL-C, high-density lipoprotein cholesterol; LDL-C, low-density lipoprotein cholesterol; TC, total cholesterol; eGFR, estimated glomerular filtration rate; BP, blood pressure; MetS, metabolic syndrome.
a Serum uric acid level of ≥7.0 mg/dL in men and ≥6.0 mg/dL in women,
b WC ≥90 cm in men or ≥85 cm in women,
c Systolic BP ≥130 mm Hg and/or diastolic BP ≥85 mm Hg or use of antihypertensive medications,
d FPG ≥100 mg/dL or use of antidiabetic medications,
e TG ≥150 mg/dL or medication use,
f HDL-C <40 mg/dL in men and <50 mg/dL in women or medication use,
g Having three or more of the aforementioned components.
| All | Without abdominal obesity | With abdominal obesity | ||||
|---|---|---|---|---|---|---|
|
|
|
|
||||
| Normouricemia | Hyperuricemiaa | Normouricemia | Hyperuricemia | Normouricemia | Hyperuricemia | |
| Men | ||||||
| Abdominal obesityb | 1 | 1.31 (1.02–1.69) | - | - | - | - |
| High BPc | 1 | 1.46 (1.24–1.73) | 1 | 1.63 (1.31–2.03) | 1 | 1.24 (0.95–1.61) |
| Hyperglycemiad | 1 | 1.17 (0.96–1.42) | 1 | 1.25 (1.03–1.59) | 1 | 1.09 (0.81–1.46) |
| Hypertriglyceridemiae | 1 | 1.69 (1.44–1.99) | 1 | 1.73 (1.40–2.14) | 1 | 1.68 (1.29–2.18) |
| Low HDL-Cf | 1 | 1.72 (1.45–2.03) | 1 | 1.53 (1.21–1.93) | 1 | 1.95 (1.51–2.51) |
| MetSg | 1 | 1.88 (1.55–2.29) | 1 | 2.13 (1.65–2.76) | 1 | 1.69 (1.27–2.25) |
|
|
||||||
| Women | ||||||
| Abdominal obesity | 1 | 1.34 (0.92–1.95) | - | - | - | - |
| High BP | 1 | 1.82 (1.32–2.50) | 1 | 1.97 (1.24–3.12) | 1 | 1.58 (1.02–2.44) |
| Hyperglycemia | 1 | 1.60 (1.23–2.09) | 1 | 1.74 (1.20–2.51) | 1 | 1.44 (0.94–2.18) |
| Hypertriglyceridemia | 1 | 1.85 (1.38–2.49) | 1 | 1.81 (1.19–2.76) | 1 | 1.79 (1.24–2.58) |
| Low HDL-C | 1 | 1.59 (1.23–2.06) | 1 | 1.41 (1.01–2.03) | 1 | 1.77 (1.25–2.52) |
| MetS | 1 | 2.31 (1.63–3.25) | 1 | 2.32 (1.46–3.68) | 1 | 2.11 (1.31–3.39) |
Adjusted for age, body mass index, estimated glomerular filtration rate, low-density lipoprotein cholesterol, alcohol intake, smoking status, physically active, household income, education levels, menopausal status.
OR, odds ratio; CI, confidence interval; BP, blood pressure; HDL-C, high-density lipoprotein cholesterol; MetS, metabolic syndrome.
a Serum uric acid level of ≥7.0 mg/dL in men and ≥6.0 mg/dL in women,
b Waist circumference ≥90 cm in men or ≥85 cm in women,
c Systolic BP ≥130 mm Hg and/or diastolic BP ≥85 mm Hg or use of antihypertensive medications,
d Fasting plasma glucose ≥100 mg/dL or use of antidiabetic medications,
e Triglyceride ≥150 mg/dL or medication use,
f HDL-C <40 mg/dL in men and <50 mg/dL in women or medication use,
g Having three or more of the aforementioned components.
| High BPa | Hyperglycemiab | Hypertriglyceridemiac | Low HDL-Cd | |
|---|---|---|---|---|
| Men | ||||
| Group A | 1 | 1 | 1 | 1 |
| Group B | 1.72 (1.39–2.11) | 1.40 (1.11–1.77) | 1.89 (1.54–2.32) | 1.67 (1.33–2.10) |
| Group C | 2.70 (2.29–3.18) | 2.67 (2.26–3.16) | 2.37 (2.05–2.74) | 2.06 (1.74–2.43) |
| Group D | 3.97 (3.08–5.11) | 3.12 (2.42–4.03) | 4.15 (3.28–5.23) | 4.43 (3.54–5.55) |
|
|
||||
| Women | ||||
| Group A | 1 | 1 | 1 | 1 |
| Group B | 2.24 (1.46–3.42) | 2.12 (1.50–3.01) | 2.24 (1.52–3.28) | 1.76 (1.26–2.48) |
| Group C | 2.47 (2.08–2.93) | 3.46 (2.92–4.09) | 2.90 (2.48–3.38) | 1.99 (1.72–2.30) |
| Group D | 5.15 (3.25–8.16) | 5.97 (3.93–9.07) | 6.05 (4.06–9.02) | 3.98 (2.78–5.71) |
Values are presented as odds ratio (95% confidence interval). Adjusted for age, estimated glomerular filtration rate, low-density lipoprotein cholesterol, alcohol intake, smoking status, physically active, household income, education levels, menopausal status. Group A: hyperuricemia (−) and abdominal obesity (−). Group B: hyperuricemia (+) and abdominal obesity (−). Group C: hyperuricemia (−) and abdominal obesity (+). Group D: hyperuricemia (+) and abdominal obesity (+).
HDL-C, high-density lipoprotein cholesterol; BP, blood pressure.
a Systolic BP ≥130 mm Hg and/or diastolic BP ≥85 mm Hg or use of antihypertensive medications,
b Fasting plasma glucose ≥100 mg/dL or use of antidiabetic medications,
c Triglyceride ≥150 mg/dL or medication use,
d HDL-C <40 mg/dL in men and <50 mg/dL in women or medication use.
| RERI (95% CI) | AP (95% CI) | SI (95% CI) | |
|---|---|---|---|
| Men | |||
| High BPa | 0.55 (−0.47 to 1.58) | 0.14 (−0.09 to 0.37) | 1.22 (0.85 to 1.77) |
| Hyperglycemiab | 0.05 (−0.81 to 0.92) | 0.02 (−0.26 to 0.29) | 1.03 (0.72 to 1.47) |
| Hypertriglyceridemiac | 0.88 (−0.14 to 1.90) | 0.21 (0.02 to 0.42)e | 1.39 (1.01 to 1.98)e |
| Low HDL-Cd | 1.70 (0.75 to 2.66)e | 0.39 (0.23 to 0.55)e | 2.03 (1.41 to 2.91)e |
|
|
|||
| Women | |||
| High BP | 1.45 (−1.07 to 3.96) | 0.28 (−0.09 to 0.66) | 1.53 (0.79 to 2.97) |
| Hyperglycemia | 1.39 (−1.35 to 4.12) | 0.23 (−0.14 to 0.60) | 1.39 (0.75 to 2.57) |
| Hypertriglyceridemia | 1.92 (−0.52 to 4.36) | 0.32 (0.05 to 0.61)e | 1.61 (1.02 to 2.69)e |
| Low HDL-C | 1.23 (−0.24 to 2.71) | 0.31 (0.07 to 0.59)e | 1.70 (1.05 to 2.95)e |
Adjusted for age, estimated glomerular filtration rate, low-density lipoprotein cholesterol, alcohol intake, smoking status, physically active, household income, education levels, menopausal status.
RERI, relative excess risk due to interaction; CI, confidence interval; AP, attributable proportion due to interaction; SI, synergy index; BP, blood pressure; HDL-C, high-density lipoprotein cholesterol.
a Systolic BP ≥130 mm Hg and/or diastolic BP ≥85 mm Hg or use of antihypertensive medications,
b Fasting plasma glucose ≥100 mg/dL or use of antidiabetic medications,
c Triglyceride ≥150 mg/dL or medication use,
d HDL-C <40 mg/dL in men and <50 mg/dL in women or medication use;
e P<0.05 and indicated a synergistic interaction.
- 1. Cirillo P, Sato W, Reungjui S, Heinig M, Gersch M, Sautin Y, et al. Uric acid, the metabolic syndrome, and renal disease. J Am Soc Nephrol 2006;17(12 Suppl 3):S165-8.ArticlePubMed
- 2. Kanbay M, Jensen T, Solak Y, Le M, Roncal-Jimenez C, Rivard C, et al. Uric acid in metabolic syndrome: from an innocent bystander to a central player. Eur J Intern Med 2016;29:3-8.ArticlePubMedPMC
- 3. Kim Y, Kang J, Kim GT. Prevalence of hyperuricemia and its associated factors in the general Korean population: an analysis of a population-based nationally representative sample. Clin Rheumatol 2018;37:2529-38.ArticlePubMedPDF
- 4. Sui X, Church TS, Meriwether RA, Lobelo F, Blair SN. Uric acid and the development of metabolic syndrome in women and men. Metabolism 2008;57:845-52.ArticlePubMedPMC
- 5. Miao Z, Li C, Chen Y, Zhao S, Wang Y, Wang Z, et al. Dietary and lifestyle changes associated with high prevalence of hyperuricemia and gout in the Shandong coastal cities of Eastern China. J Rheumatol 2008;35:1859-64.PubMed
- 6. Lee SE, Han K, Kang YM, Kim SO, Cho YK, Ko KS, et al. Trends in the prevalence of metabolic syndrome and its components in South Korea: findings from the Korean National Health Insurance Service Database (2009–2013). PLoS One 2018;13:e0194490.ArticlePubMedPMC
- 7. Maison P, Byrne CD, Hales CN, Day NE, Wareham NJ. Do different dimensions of the metabolic syndrome change together over time? Evidence supporting obesity as the central feature. Diabetes Care 2001;24:1758-63.PubMed
- 8. Paley CA, Johnson MI. Abdominal obesity and metabolic syndrome: exercise as medicine? BMC Sports Sci Med Rehabil 2018;10:7.ArticlePubMedPMCPDF
- 9. Tsay YC, Chen CH, Pan WH. Ages at onset of 5 cardiometabolic diseases adjusting for nonsusceptibility: implications for the pathogenesis of metabolic syndrome. Am J Epidemiol 2016;184:366-77.ArticlePubMed
- 10. Lee YB, Jun JE, Lee SE, Ahn J, Kim G, Jee JH, et al. Utility of serum albumin for predicting incident metabolic syndrome according to hyperuricemia. Diabetes Metab J 2018;42:529-37.ArticlePubMedPMCPDF
- 11. Billiet L, Doaty S, Katz JD, Velasquez MT. Review of hyperuricemia as new marker for metabolic syndrome. ISRN Rheumatol 2014;2014:852954.ArticlePubMedPMCPDF
- 12. Rospleszcz S, Dermyshi D, Muller-Peltzer K, Strauch K, Bamberg F, Peters A. Association of serum uric acid with visceral, subcutaneous and hepatic fat quantified by magnetic resonance imaging. Sci Rep 2020;10:442.ArticlePubMedPMCPDF
- 13. Hikita M, Ohno I, Mori Y, Ichida K, Yokose T, Hosoya T. Relationship between hyperuricemia and body fat distribution. Intern Med 2007;46:1353-8.ArticlePubMed
- 14. Yamada A, Sato KK, Kinuhata S, Uehara S, Endo G, Hikita Y, et al. Association of visceral fat and liver fat with hyperuricemia. Arthritis Care Res (Hoboken) 2016;68:553-61.ArticlePubMed
- 15. Shirasawa T, Ochiai H, Yoshimoto T, Nagahama S, Watanabe A, Yoshida R, et al. Cross-sectional study of associations between normal body weight with central obesity and hyperuricemia in Japan. BMC Endocr Disord 2020;20:2.ArticlePubMedPMCPDF
- 16. Lim S, Shin H, Song JH, Kwak SH, Kang SM, Yoon JW, et al. Increasing prevalence of metabolic syndrome in Korea: the Korean National Health and Nutrition Examination Survey for 1998–2007. Diabetes Care 2011;34:1323-8.PubMedPMC
- 17. Kim IY, Han KD, Kim DH, Eun Y, Cha HS, Koh EM, et al. Women with metabolic syndrome and general obesity are at a higher risk for significant hyperuricemia compared to men. J Clin Med 2019;8:837.ArticlePubMedPMC
- 18. Kweon S, Kim Y, Jang MJ, Kim Y, Kim K, Choi S, et al. Data resource profile: the Korea National Health and Nutrition Examination Survey (KNHANES). Int J Epidemiol 2014;43:69-77.ArticlePubMedPMC
- 19. Roberts WC. The Friedewald-Levy-Fredrickson formula for calculating low-density lipoprotein cholesterol, the basis for lipid-lowering therapy. Am J Cardiol 1988;62:345-6.ArticlePubMed
- 20. Levey AS, Bosch JP, Lewis JB, Greene T, Rogers N, Roth D. A more accurate method to estimate glomerular filtration rate from serum creatinine: a new prediction equation. Modification of Diet in Renal Disease Study Group. Ann Intern Med 1999;130:461-70.ArticlePubMed
- 21. Grundy SM, Cleeman JI, Daniels SR, Donato KA, Eckel RH, Franklin BA, et al. Diagnosis and management of the metabolic syndrome: an American Heart Association/National Heart, Lung, and Blood Institute Scientific Statement. Circulation 2005;112:2735-52.ArticlePubMed
- 22. Yoon YS, Oh SW. Optimal waist circumference cutoff values for the diagnosis of abdominal obesity in Korean adults. Endocrinol Metab (Seoul) 2014;29:418-26.ArticlePubMedPMC
- 23. Andersson T, Alfredsson L, Kallberg H, Zdravkovic S, Ahlbom A. Calculating measures of biological interaction. Eur J Epidemiol 2005;20:575-9.ArticlePubMedPDF
- 24. VanderWeele TJ, Knol MJ. A tutorial on interaction. Epidemiol Methods 2014;3:33-72.Article
- 25. de Mutsert R, Jager KJ, Zoccali C, Dekker FW. The effect of joint exposures: examining the presence of interaction. Kidney Int 2009;75:677-81.ArticlePubMed
- 26. Soltani Z, Rasheed K, Kapusta DR, Reisin E. Potential role of uric acid in metabolic syndrome, hypertension, kidney injury, and cardiovascular diseases: is it time for reappraisal? Curr Hypertens Rep 2013;15:175-81.ArticlePubMedPMCPDF
- 27. Nakagawa T, Hu H, Zharikov S, Tuttle KR, Short RA, Glushakova O, et al. A causal role for uric acid in fructose-induced metabolic syndrome. Am J Physiol Renal Physiol 2006;290:F625-31.ArticlePubMed
- 28. Baldwin W, McRae S, Marek G, Wymer D, Pannu V, Baylis C, et al. Hyperuricemia as a mediator of the proinflammatory endocrine imbalance in the adipose tissue in a murine model of the metabolic syndrome. Diabetes 2011;60:1258-69.ArticlePubMedPMCPDF
- 29. Roncal-Jimenez CA, Lanaspa MA, Rivard CJ, Nakagawa T, Sanchez-Lozada LG, Jalal D, et al. Sucrose induces fatty liver and pancreatic inflammation in male breeder rats independent of excess energy intake. Metabolism 2011;60:1259-70.ArticlePubMedPMC
- 30. Yuan H, Yu C, Li X, Sun L, Zhu X, Zhao C, et al. Serum uric acid levels and risk of metabolic syndrome: a dose-response meta-analysis of prospective studies. J Clin Endocrinol Metab 2015;100:4198-207.ArticlePubMed
- 31. Jeong J, Suh YJ. Association between serum uric acid and metabolic syndrome in Koreans. J Korean Med Sci 2019;34:e307.ArticlePubMedPMCPDF
- 32. Lin SD, Tsai DH, Hsu SR. Association between serum uric acid level and components of the metabolic syndrome. J Chin Med Assoc 2006;69:512-6.ArticlePubMed
- 33. Zhang S, Du T, Li M, Lu H, Lin X, Yu X. Combined effect of obesity and uric acid on nonalcoholic fatty liver disease and hypertriglyceridemia. Medicine (Baltimore) 2017;96:e6381.ArticlePubMedPMC
- 34. Choi HK, Ford ES. Haemoglobin A1c, fasting glucose, serum C-peptide and insulin resistance in relation to serum uric acid levels: the Third National Health and Nutrition Examination Survey. Rheumatology (Oxford) 2008;47:713-7.ArticlePubMed
- 35. Jeong H, Moon JE, Jeon CH. Hyperuricemia is associated with an increased prevalence of metabolic syndrome in a general population and a decreased prevalence of diabetes in men. J Rheum Dis 2020;27:247-60.Article
- 36. Reaven GM. The kidney: an unwilling accomplice in syndrome X. Am J Kidney Dis 1997;30:928-31.ArticlePubMed
- 37. Tuomilehto J, Zimmet P, Wolf E, Taylor R, Ram P, King H. Plasma uric acid level and its association with diabetes mellitus and some biologic parameters in a biracial population of Fiji. Am J Epidemiol 1988;127:321-36.ArticlePubMed
- 38. Cook DG, Shaper AG, Thelle DS, Whitehead TP. Serum uric acid, serum glucose and diabetes: relationships in a population study. Postgrad Med J 1986;62:1001-6.ArticlePubMedPMCPDF
- 39. Palmer TM, Nordestgaard BG, Benn M, Tybjaerg-Hansen A, Davey Smith G, Lawlor DA, et al. Association of plasma uric acid with ischaemic heart disease and blood pressure: mendelian randomisation analysis of two large cohorts. BMJ 2013;347:f4262.ArticlePubMedPMC
- 40. Lee SW, Kim HC, Nam C, Lee HY, Ahn SV, Oh YA, et al. Age-differential association between serum uric acid and incident hypertension. Hypertens Res 2019;42:428-437.ArticlePubMedPDF
- 41. Tsushima Y, Nishizawa H, Tochino Y, Nakatsuji H, Sekimoto R, Nagao H, et al. Uric acid secretion from adipose tissue and its increase in obesity. J Biol Chem 2013;288:27138-49.ArticlePubMedPMC
- 42. Matsuura F, Yamashita S, Nakamura T, Nishida M, Nozaki S, Funahashi T, et al. Effect of visceral fat accumulation on uric acid metabolism in male obese subjects: visceral fat obesity is linked more closely to overproduction of uric acid than subcutaneous fat obesity. Metabolism 1998;47:929-33.ArticlePubMed
- 43. Klein S, Allison DB, Heymsfield SB, Kelley DE, Leibel RL, Nonas C, et al. Waist circumference and cardiometabolic risk: a consensus statement from shaping America’s health: Association for Weight Management and Obesity Prevention; NAASO, the Obesity Society; the American Society for Nutrition; and the American Diabetes Association. Diabetes Care 2007;30:1647-52.ArticlePubMed
- 44. Han SJ, Boyko EJ, Kim SK, Fujimoto WY, Kahn SE, Leonetti DL. Association of thigh muscle mass with insulin resistance and incident type 2 diabetes mellitus in Japanese Americans. Diabetes Metab J 2018;42:488-95.ArticlePubMedPMCPDF
- 45. Cheng YJ, Gregg EW, De Rekeneire N, Williams DE, Imperatore G, Caspersen CJ, et al. Muscle-strengthening activity and its association with insulin sensitivity. Diabetes Care 2007;30:2264-70.ArticlePubMedPDF
REFERENCES
Figure & Data
References
Citations
- Prevalence and factors associated with overweight, obesity and central obesity among adults in Shenmu City, Shaanxi Province, China
Mingxia Liu, Chunjiao Jia, Yaoda Hu, Juan Liu, Lizhen Liu, Shengli Sun, Haiying Wang, Yonglin Liu
Preventive Medicine Reports.2024; 40: 102673. CrossRef - Synergistic interaction between hyperlipidemia and obesity as a risk factor for stress urinary incontinence in Americans
Fangyi Zhu, Mao Chen, Ya Xiao, Xiaoyu Huang, Liying Chen, Li Hong
Scientific Reports.2024;[Epub] CrossRef - The role of cognitive function in the relationship between surrogate markers of visceral fat and depressive symptoms in general middle-aged and elderly population: A nationwide population-based study
Na Zhang, Jianqian Chao, Xueyu Wu, Hongling Chen, Min Bao
Journal of Affective Disorders.2023; 338: 581. CrossRef - Biodegradation of Uric Acid by Bacillus paramycoides-YC02
Xiaoyu Cao, Jingyuan Cai, Yu Zhang, Chao Liu, Meijie Song, Qianqian Xu, Yang Liu, Hai Yan
Microorganisms.2023; 11(8): 1989. CrossRef - A predictive model for hyperuricemia among type 2 diabetes mellitus patients in Urumqi, China
Palizhati Abudureyimu, Yuesheng Pang, Lirun Huang, Qianqian Luo, Xiaozheng Zhang, Yifan Xu, Liang Jiang, Patamu Mohemaiti
BMC Public Health.2023;[Epub] CrossRef - Dietary Ferulic Acid Ameliorates Metabolism Syndrome-Associated Hyperuricemia in Rats via Regulating Uric Acid Synthesis, Glycolipid Metabolism, and Hepatic Injury
Nanhai Zhang, Jingxuan Zhou, Lei Zhao, Ou Wang, Liebing Zhang, Feng Zhou
Frontiers in Nutrition.2022;[Epub] CrossRef
 PubReader
 ePub Link
 Cite
Cite