
- Current
- Browse
- Collections
-
For contributors
- For Authors
- Instructions to authors
- Article processing charge
- e-submission
- For Reviewers
- Instructions for reviewers
- How to become a reviewer
- Best reviewers
- For Readers
- Readership
- Subscription
- Permission guidelines
- About
- Editorial policy
Articles
- Page Path
- HOME > Diabetes Metab J > Volume 35(3); 2011 > Article
-
Original ArticleATP-Sensitive Potassium Channel-Deficient Mice Show Hyperphagia but Are Resistant to Obesity
- Yeul Bum Park1, Yun Jung Choi2, So Young Park2, Jong Yeon Kim2, Seong Ho Kim1, Dae Kyu Song3, Kyu Chang Won4, Yong Woon Kim1
-
Diabetes & Metabolism Journal 2011;35(3):219-225.
DOI: https://doi.org/10.4093/dmj.2011.35.3.219
Published online: June 30, 2011
1Department of Neurosurgery, Yeungnam University College of Medicine, Daegu, Korea.
2Department of Physiology, Yeungnam University College of Medicine, Daegu, Korea.
3Department of Physiology, Keimyung University College of Medicine, Daegu, Korea.
4Department of Internal Medicine, Yeungnam University College of Medicine, Daegu, Korea.
- Corresponding author: Yong Woon Kim. Department of Physiology, Yeungnam University College of Medicine, 317-1 Daemyeong-dong, Nam-gu, Daegu 705-717, Korea. ywkim@med.yu.ac.kr
• Received: November 15, 2010 • Accepted: December 22, 2010
Copyright © 2011 Korean Diabetes Association
This is an Open Access article distributed under the terms of the Creative Commons Attribution Non-Commercial License (http://creativecommons.org/licenses/by-nc/3.0/) which permits unrestricted non-commercial use, distribution, and reproduction in any medium, provided the original work is properly cited.
ABSTRACT
-
Background
- The hypothalamus, the center for body weight regulation, can sense changes in blood glucose level based on ATP-sensitive potassium (KATP) channels in the hypothalamic neurons. We hypothesized that a lack of glucose sensing in the hypothalamus affects the regulations of appetite and body weight.
-
Methods
- To evaluate this hypothesis, the responses to glucose loading and high fat feeding for eight weeks were compared in Kir6.2 knock-out (KO) mice and control C57BL/6 mice, because Kir6.2 is a key component of the KATP channel.
-
Results
- The hypothalamic neuropeptide Y (NPY) analyzed one hour after glucose injection was suppressed in C57BL/6 mice, but not in Kir6.2 KO mice, suggesting a blunted hypothalamic response to glucose in Kir6.2 KO mice. The hypothalamic NPY expression at a fed state was elevated in Kir6.2 KO mice and was accompanied with hyperphagia. However, the retroperitoneal fat mass was markedly decreased in Kir6.2 KO mice compared to that in C57BL/6 mice. Moreover, the body weight and visceral fat following eight weeks of high fat feeding in Kir6.2 KO mice were not significantly different from those in control diet-fed Kir6.2 KO mice, while body weight and visceral fat mass were elevated due to high fat feeding in C57BL/6 mice.
-
Conclusion
- These results suggested that Kir6.2 KO mice showed a blunted hypothalamic response to glucose loading and elevated hypothalamic NPY expression accompanied with hyperphagia, while visceral fat mass was decreased, suggesting resistance to diet-induced obesity. Further study is needed to explain this phenomenon.
- Obesity is a condition characterized by excessive accumulation of fat in the body resulting from a chronic excess energy intake compared to energy expenditure. Currently, obesity is considered a disease state because it is associated with metabolic syndrome, including diabetes, hypertension, atherosclerosis, dyslipidemia, and hyperuricemia. Moreover, obesity has dramatically increased throughout the world [1]. Body weight homeostasis is maintained through the balance between energy expenditure and energy intake, and these processes are controlled in the hypothalamus - the center for body weight regulation. Various mechanical and hormonal signals from the gut and adipose tissue, such as gut distension, leptin, insulin, glucagon-like peptide 1, cholecystokinin, peptide YY, pancreatic polypeptide, oxyntomodulin and ghrelin, etc., stimulate proopiomelanocortin (POMC; the precursor of a melanocyte-stimulating hormone) and cocaine- and amphetamine-regulated transcript (CART) expressing neurons or neuropeptide Y (NPY) and agouti-related peptide (AgRP) expressing neuron in the arcuate nucleus of the hypothalamus. POMC and CART are typical anorexigenic peptides, while NPY and AgRP are typical orexigenic peptides [2-4]. When anorexigenic peptide is elevated, melanocortin receptor 3/4 in the paraventricular nucleus of the hypothalamus is activated and satiation and thermogenesis are induced. Increased orexigenic peptide activates the Y1/5 receptor in the paraventricular nucleus of the hypothalamus, induces a sense of hunger, and halts thermogenesis [5].
- In addition to the mechanical and hormonal signals entering the hypothalamus, the hypothalamic neurons also directly sense nutrient signals in the blood, such as hyperglycemia and hyperlipidemia, and activate the regulatory processes of energy balance in the hypothalamus [6]. There are specialized subgroups of hypothalamic neurons which sense the changes in blood glucose levels [7,8]. Glucose-sensing neurons were assumed to employ the glucose-sensing strategy used in pancreatic β-cells, where increased intracellular glucose, resulted from hyperglycemia, increases cytosolic ATP through glucose metabolism. This leads to closure of ATP-sensitive potassium ion channels (KATP channels) containing Kir6.x potassium channel subunits and sulfonylurea receptors, causing membrane depolarization, Ca++ influx, and insulin release or increased excitability [9]. Metabolic stresses such as hypoxia, ischemia, or hypoglycemia lead to depletion of intracellular ATP and activation of KATP channels, resulting in hyperpolarization and decreased excitability. The KATP channels are expressed not only in pancreatic β-cells, but also in cardiac muscle and neurons in the hypothalamus and brain stem [10-12]. Activation of the neuronal KATP channels during depletion of ATP hyperpolarizes the neuron membrane, thereby reducing neuronal excitability and ATP consumption.
- Recently, there has been accumulating evidence that KATP channels are associated with regulation of food intake. The expression of the KATP channel component, Kir6.2, was decreased in the dorsomedial and ventromedial hypothalamus of Zucker diabetic fatty rats [13]. Polakof et al. [14] reported that intracerebroventricular injection of glucose or deoxyglucose changes appetite via glucose-sensing components in the hypothalamus of rainbow trout. Jo et al. [15] demonstrated that oleic acid increased POMC expression through suppression of the KATP channel in the hypothalamus. However, we do not yet know how KATP channel activity is associated with the regulation of food intake.
- In this study, we evaluated the role of hypothalamic KATP channels in the regulations of appetite and body weight using Kir6.2 knock-out (KO) mice and control C57BL/6 mice because Kir6.2 is a key component of the KATP channel.
INTRODUCTION
- Animal care
- Male KATP KO mice and C57BL/6 control mice were used in this study. Kir6.2 subunit KO mice were kindly donated by Dr. S. Seino at Kobe University, and C57BL/6 mice were purchased from Jung-Ang Experimental Animals (Seoul, Korea). The mice were housed individually with a 12:12 light:dark cycle (07:00 to 19:00 hour) and were cared for in accordance with the "Guide to the Care and Use of Experimental Animals" of the Yeungnam Medical Center. This experimental protocol was approved by the Ethics Committee of Yeungnam University.
- Experimental design
- To analyze whether Kir6.2 deletion affects glucose-sensing in the hypothalamus, a 20% glucose solution (2 g/kg) was injected intraperitoneally into 12-week-old Kir6.2 KO and C57BL/6 mice. One hour after the injection, blood was collected through the abdominal aorta, and the hypothalamus was excised and analyzed for hypothalamic neuropeptides.
- To evaluate the role of Kir6.2 on the induction of obesity, four-week-old Kir6.2 KO mice and C57BL/6 mice were treated with a high fat diet or control diet for eight weeks. Food intake and body weight were measured twice per week. After eight weeks of high fat or control diet, blood samples were obtained and visceral fat and the hypothalamus were removed. The diets used in this study were the 'HFD60%cal' high fat diet and the 'AIN93G' control diet. The 'HFD60%cal' was composed of protein, carbohydrate, and fat (20, 20, and 60%, respectively, of total calories) supplemented with vitamins (1%) and minerals (3.5%), while the caloric composition of 'AIN93G' was 20, 64, and 16% (protein, carbohydrate, and fat, respectively). The diets were provided by Feedlab Korea Co. (Seoul, Korea).
- Tissue preparations
- Mice were anesthetized via intraperitoneal injection of Tiletamine and Zolazepam (25 mg/kg BW, Zoletil®; Virbac, Carros, France). Blood was rapidly collected through the abdominal aorta using a heparin coated syringe and then separated from plasma using centrifugation at 4℃. Visceral fat tissues in perirenal, retroperitoneal and epididymal areas were excised and weighed. The hypothalamus was excised, quickly frozen in liquid nitrogen, and stored in a deep freezer.
- Real time polymerase chain reaction analysis
- Each whole mouse hypothalamus was homogenized in TRI reagent (Sigma-Aldrich, St. Louis, MO, USA) using an Ultra-Turrax T25 (Staufel, Germany). RNA was reverse transcribed to cDNA from 1 µg of total RNA using a High-Capacity cDNA Reverse Transcription Kit (Applied Biosystems, Foster City, CA, USA). Quantitative real-time PCR was performed using the Real-Time PCR 7500 system and Power SYBR Green PCR master mix (Applied Biosystems), according to the manufacturer's instructions. The expression level of glyceraldehyde 3-phosphate dehydrogenase (GAPDH) was used as an internal control. The reactions were incubated at 95℃ for 10 minutes, followed by 45 cycles of 95℃ for 15 seconds, 55℃ for 20 seconds, and 72℃ for 35 seconds. Primers for mouse POMC, NPY, and GAPDH were based on NCBI's nucleotide database and designed using the Primer Express program (Applied Biosystems): mouse POMC (forward, 5'-ACC TCA CCA CGG AAA GCA A-3'; reverse, 5'-CGG GGA TTT TCA GTA AAG G-3'), mouse NPY (forward, 5'-TAT CCC TGC TCG TGT GTT TG-3'; reverse, 5'-GTT CTG GGG GCA TTT TCT G-3'), mouse GAPDH (forward, 5'-CAG GAT GAC ACC AAA ACC CTC-3'; reverse, 5'-TCC AAG CCA GTG ACC CTC TG-3').
- Statistical analysis
- The data was expressed as mean±standard error. Statistical comparisons between control and Kir6.2-deficient mice were made using the t-test. A value of less than 0.05 was considered statistically significant.
METHODS
Experiment 1
Experiment 2
- Responses to glucose loading in Kir6.2 KO mice
- Overnight fasting glucose levels in C57BL/6 and Kir6.2 KO mice were not significantly different. Serum glucose levels were significantly elevated at one hour after glucose injection (2 g/kg) in both C57BL/6 and Kir6.2 KO mice (Fig. 1A). The hypothalamic neuropeptides were analyzed one hour after glucose injection and there was no significant difference in basal hypothalamic POMC or NPY expression between C57BL/6 and Kir6.2 KO mice. However, the hypothalamic NPY expression was significantly decreased by glucose injection in C57BL/6 mice, while there was no change in Kir6.2 KO mice, suggesting a failure of the hypothalamic glucose sensing function (Fig. 1B and C).
- Characteristics of Kir6.2 KO mice and response to a high fat diet
- The body weights of Kir6.2 KO mice were not significantly different from those of age matched C57BL/6 mice (Table 1, initial body weight), while daily caloric intake was higher in Kir6.2 KO mice (Fig. 2A). Interestingly, the retroperitoneal white adipose tissue (RT-WAT) deposition was dramatically decreased in Kir6.2 KO mice compared to that in C57BL/6 mice (Fig. 2B). The eight-week high fat diet significantly increased body weight compared to that of the control diet in C57BL/6 mice, while the body weight of eight-week high fat-treated Kir6.2 KO mice was not increased compared to that of control dieting mice. RT-WAT mass changes following a high fat diet also showed the same pattern as did body weight changes. The increase in RT-WAT mass following a high fat diet in Kir6.2 KO mice was less than that in C57BL/6 mice (Fig. 2B).
- Serum glucose levels did not differ between C57BL/6 and Kir6.2 KO mice, while serum concentrations of FFA, insulin, and leptin were significantly lower in Kir6.2 KO mice compared to those in C57BL/6 mice. Moreover, there were no significant changes in serum glucose, FFA, insulin or leptin following eight weeks of a high fat diet in Kir6.2 KO mice, while there were significant elevations in insulin and leptin in C57BL/6 mice (Fig. 3). The hypothalamic NPY mRNA expression at the "fed state" was elevated in Kir6.2 KO mice compared to that in C57BL/6 mice; however, there was no significant change following a high fat diet in either C57BL/6 or Kir6.2 KO mice (Fig. 3F). The hypothalamic POMC mRNA expressions were not different among the experimental groups (Fig. 3E).
RESULTS
- In the present study, we measured hypothalamic expressions of POMC and NPY, caloric intake, body weight, and visceral fat mass following eight weeks of high fat dieting in Kir6.2 KO mice and control C57BL/6 mice to investigate the role of the KATP channel in the regulation of food intake and the induction of obesity. This study demonstrated that Kir6.2-deficient mice showed increased hypothalamic NPY expression accompanied with increased caloric intake, decreased visceral fat mass, and resistance to the induction of obesity by a high fat diet compared to the levels in C57BL/6 mice.
- KATP channels were first identified in the heart and have been extensively studied in both cardiac myocytes and pancreatic β-cells [16-18]. Deletion of KATP channels due to disruption of the Kir6.2 gene results in the complete absence of KATP channel activity in pancreatic β-cells, skeletal muscle, and heart [19]. In this study, we focused on the role of KATP channels in the hypothalamus - a regulatory center for body weight homeostasis. Several previous reports have provided evidence for an association of the hypothalamic KATP channel with obesity or appetite regulation [13-15,20]. We also found that hypothalamic Kir6.2 mRNA expression increased in high fat, obese mice (data not shown), which is inconsistent with the report by Gyte et al. [13] that showed reduced expression of Kir6.2 in the hypothalami of Zucker diabetic fatty rats.
- This discrepancy might result from differences in the animal models used for the study. The increase in Kir6.2 expression in high fat-fed mice appears to result from a compensatory mechanism. In the present study, we found that an absence of a glucose-sensing mechanism in the hypothalamic neurons leads to a blunted satiety signal, while C57BL/6 mice showed a decrease in hypothalamic NPY, an orexigenic neuropeptide (Fig. 1C). Moreover, Kir6.2 KO mice demonstrated hyperphagia and increased hypothalamic NPY mRNA expression in the fed state (Figs 2A and 3F). We suggested that these results are associated with the co-localization of Kir6.2 and NPY throughout the hypothalamus [13,21,22]. The hypothalamus contains glucose-inhibited neurons and glucose-excited neurons [23]. The NPY neuron is a typical glucose-inhibited neuron [21], while the POMC neuron is a typical glucose-excited neuron [12]. Thus, in the present study, glucose loading induced the suppression of hypothalamic NPY mRNA expression in C57BL/6 mice.
- Although there are several reports demonstrating the involvement of POMC neurons in glucose-sensing [12,20,24], we did not observe any changes in hypothalamic POMC mRNA expression in either C57BL/6 or Kir6.2 KO mice (Fig. 1B). This result is supported by Fioramonti et al.'s study [21] showing that more than 95% of POMC neurons do not respond to glucose in vitro. The Kir6.2 KO mice showed normoglycemia and mild glucose intolerance (data not shown) in fasting and feeding states (Figs 1A and 3A), while serum insulin concentration was decreased compared to the levels in C57BL/6 mice. These results are consistent with previous reports [19,25] in that Kir6.2-deficient mice demonstrated only mild glucose intolerance, despite the marked defect in insulin secretion. The maintenance of a normoglycemic condition in Kir6.2 KO mice might result from enhanced insulin sensitivity in skeletal muscle [25,26]. Serum levels of leptin and FFA were markedly decreased in Kir6.2 KO mice compared to those in C57BL/6 mice (Fig. 3), which resulted from the decrease in body fat mass.
- Although Kir6.2 KO mice showed a blunted satiety signal to glucose injection and hyperphagia, visceral fat mass was markedly decreased and resistant to induction of obesity due to a high fat diet in this study. These results are consistent with Alekseev et al.'s recent study [27] showing that genetic disruption of the KATP channel function results in a lean phenotype that is resistant to diet-induced obesity. They demonstrated an increase in energy expenditure in cardiac and skeletal muscles in the Kir6.2 KO mice, which may result in the lean phenotype. However, they also demonstrated that the running distance of Kir6.2 KO mice was lower than that of wild-type mice, which is supported by our unpublished data. We found that oxygen consumption corrected according to running distance was increased in Kir6.2 KO mice (data not shown), suggesting a lower fuel efficiency during exercise, which may result in the lean phenotype by magnifying the benefit of activity [28]. However, why Kir6.2 KO mice have such a lean phenotype despite showing hyperphagia and lowered locomotor activity could not be explained completely, even though Kir6.2 KO mice have an inefficient energy expending system.
- The limitation of this study is that Kir6.2 KO effects are not specific for the hypothalamus because Kir6.2 mRNA is expressed not only in neurons, but in most excitable tissues such as pancreatic β-cells, cardiac muscle, and skeletal muscle [19,23]. Although the glucose-sensing role of the hypothalamic KATP channels was demonstrated by the blunted hypothalamic response to glucose loading and hyperphagia, the effects of Kir6.2 KO on pancreatic β-cells, cardiac muscle, and skeletal muscle affected the results of this experiment. To eliminate the extra-hypothalamic effects, further studies using selective deletion of hypothalamic Kir6.2 are needed. Although we could not explain the exact mechanism for the lean phenotype in Kir6.2 KO mice, the development of an animal model resistant to obesity induction may lead to obesity treatment.
- In summary, Kir6.2 KO mice showed a blunted hypothalamic response to glucose loading, increased hypothalamic NPY expression associated with hyperphagia, smaller visceral fat mass, and resistance to induction of obesity due to a high fat diet. We could not completely explain the disparity between hyperphagia and smaller visceral fat mass. Further study is needed to define the mechanism explaining this phenomenon.
DISCUSSION
-
Acknowledgements
- The research was supported by the Basic Science Research Program through the National Research Foundation of Korea (NRF) funded by the Ministry of Education, Science and Technology (2009-0069055).
ACKNOWLEDGMENTS
- 1. Wang Y, Beydoun MA. The obesity epidemic in the United States--gender, age, socioeconomic, racial/ethnic, and geographic characteristics: a systematic review and meta-regression analysis. Epidemiol Rev 2007;29:6-28. ArticlePubMed
- 2. Schwartz MW, Woods SC, Porte D Jr, Seeley RJ, Baskin DG. Central nervous system control of food intake. Nature 2000;404:661-671. ArticlePubMedPDF
- 3. Flier JS. Obesity wars: molecular progress confronts an expanding epidemic. Cell 2004;116:337-350. ArticlePubMed
- 4. Harrold JA. Hypothalamic control of energy balance. Curr Drug Targets 2004;5:207-219. ArticlePubMed
- 5. Scarpace PJ, Matheny M, Tumer N. Hypothalamic leptin resistance is associated with impaired leptin signal transduction in aged obese rats. Neuroscience 2001;104:1111-1117. ArticlePubMed
- 6. Obici S, Rossetti L. Minireview: nutrient sensing and the regulation of insulin action and energy balance. Endocrinology 2003;144:5172-5178. ArticlePubMed
- 7. Levin BE, Routh VH, Kang L, Sanders NM, Dunn-Meynell AA. Neuronal glucosensing: what do we know after 50 years? Diabetes 2004;53:2521-2528. PubMed
- 8. Burdakov D, Luckman SM, Verkhratsky A. Glucose-sensing neurons of the hypothalamus. Philos Trans R Soc Lond B Biol Sci 2005;360:2227-2235. ArticlePubMedPMCPDF
- 9. Schuit FC, Huypens P, Heimberg H, Pipeleers DG. Glucose sensing in pancreatic beta-cells: a model for the study of other glucose-regulated cells in gut, pancreas, and hypothalamus. Diabetes 2001;50:1-11.
- 10. Miki T, Liss B, Minami K, Shiuchi T, Saraya A, Kashima Y, Horiuchi M, Ashcroft F, Minokoshi Y, Roeper J, Seino S. ATP-sensitive K+ channels in the hypothalamus are essential for the maintenance of glucose homeostasis. Nat Neurosci 2001;4:507-512. ArticlePubMedPDF
- 11. Minami K, Miki T, Kadowaki T, Seino S. Roles of ATP-sensitive K+ channels as metabolic sensors: studies of Kir6.x null mice. Diabetes 2004;53(Suppl 3):S176-S180. PubMed
- 12. Parton LE, Ye CP, Coppari R, Enriori PJ, Choi B, Zhang CY, Xu C, Vianna CR, Balthasar N, Lee CE, Elmquist JK, Cowley MA, Lowell BB. Glucose sensing by POMC neurons regulates glucose homeostasis and is impaired in obesity. Nature 2007;449:228-232. ArticlePubMedPDF
- 13. Gyte A, Pritchard LE, Jones HB, Brennand JC, White A. Reduced expression of the KATP channel subunit, Kir6.2, is associated with decreased expression of neuropeptide Y and agouti-related protein in the hypothalami of Zucker diabetic fatty rats. J Neuroendocrinol 2007;19:941-951. ArticlePubMedPDF
- 14. Polakof S, Panserat S, Plagnes-Juan E, Soengas JL. Altered dietary carbohydrates significantly affect gene expression of the major glucosensing components in Brockmann bodies and hypothalamus of rainbow trout. Am J Physiol Regul Integr Comp Physiol 2008;295:R1077-R1088. ArticlePubMed
- 15. Jo YH, Su Y, Gutierrez-Juarez R, Chua S Jr. Oleic acid directly regulates POMC neuron excitability in the hypothalamus. J Neurophysiol 2009;101:2305-2316. ArticlePubMedPMC
- 16. Noma A. ATP-regulated K+ channels in cardiac muscle. Nature 1983;305:147-148. ArticlePubMedPDF
- 17. Cook DL, Hales CN. Intracellular ATP directly blocks K+ channels in pancreatic B-cells. Nature 1984;311:271-273. ArticlePubMedPDF
- 18. Ashcroft FM. Adenosine 5'-triphosphate-sensitive potassium channels. Annu Rev Neurosci 1988;11:97-118. ArticlePubMed
- 19. Miki T, Nagashima K, Tashiro F, Kotake K, Yoshitomi H, Tamamoto A, Gonoi T, Iwanaga T, Miyazaki J, Seino S. Defective insulin secretion and enhanced insulin action in KATP channel-deficient mice. Proc Natl Acad Sci U S A 1998;95:10402-10406. ArticlePubMedPMC
- 20. Plum L, Ma X, Hampel B, Balthasar N, Coppari R, Munzberg H, Shanabrough M, Burdakov D, Rother E, Janoschek R, Alber J, Belgardt BF, Koch L, Seibler J, Schwenk F, Fekete C, Suzuki A, Mak TW, Krone W, Horvath TL, Ashcroft FM, Bruning JC. Enhanced PIP3 signaling in POMC neurons causes KATP channel activation and leads to diet-sensitive obesity. J Clin Invest 2006;116:1886-1901. ArticlePubMedPMC
- 21. Fioramonti X, Contie S, Song Z, Routh VH, Lorsignol A, Penicaud L. Characterization of glucosensing neuron subpopulations in the arcuate nucleus: integration in neuropeptide Y and pro-opio melanocortin networks. Diabetes 2007;56:1219-1227. PubMed
- 22. Mountjoy PD, Bailey SJ, Rutter GA. Inhibition by glucose or leptin of hypothalamic neurons expressing neuropeptide Y requires changes in AMP-activated protein kinase activity. Diabetologia 2007;50:168-177. ArticlePubMedPDF
- 23. Gonzalez JA, Reimann F, Burdakov D. Dissociation between sensing and metabolism of glucose in sugar sensing neurones. J Physiol 2009;587(Pt 1):41-48. ArticlePubMed
- 24. Burdakov D, Gerasimenko O, Verkhratsky A. Physiological changes in glucose differentially modulate the excitability of hypothalamic melanin-concentrating hormone and orexin neurons in situ. J Neurosci 2005;25:2429-2433. ArticlePubMedPMC
- 25. Miki T, Minami K, Zhang L, Morita M, Gonoi T, Shiuchi T, Minokoshi Y, Renaud JM, Seino S. ATP-sensitive potassium channels participate in glucose uptake in skeletal muscle and adipose tissue. Am J Physiol Endocrinol Metab 2002;283:E1178-E1184. ArticlePubMed
- 26. Chutkow WA, Samuel V, Hansen PA, Pu J, Valdivia CR, Makielski JC, Burant CF. Disruption of Sur2-containing K(ATP) channels enhances insulin-stimulated glucose uptake in skeletal muscle. Proc Natl Acad Sci U S A 2001;98:11760-11764. ArticlePubMedPMC
- 27. Alekseev AE, Reyes S, Yamada S, Hodgson-Zingman DM, Sattiraju S, Zhu Z, Sierra A, Gerbin M, Coetzee WA, Goldhamer DJ, Terzic A, Zingman LV. Sarcolemmal ATP-sensitive K(+) channels control energy expenditure determining body weight. Cell Metab 2010;11:58-69. ArticlePubMedPMC
- 28. Himms-Hagen J. Exercise in a pill: feasibility of energy expenditure targets. Curr Drug Targets CNS Neurol Disord 2004;3:389-409. ArticlePubMed
REFERENCES
Fig. 1The serum glucose levels (A) and hypothalamic expressions of proopiomelanocortin (POMC; B) and neuropeptide Y (NPY; C) mRNA following intraperitoneal saline or glucose injection in overnight fasted C57BL/6 and Kir6.2 knockout (KO) mice. Values are the mean±standard error of 5 to 10 experimental animals per group. aP<0.05 vs. the saline group.
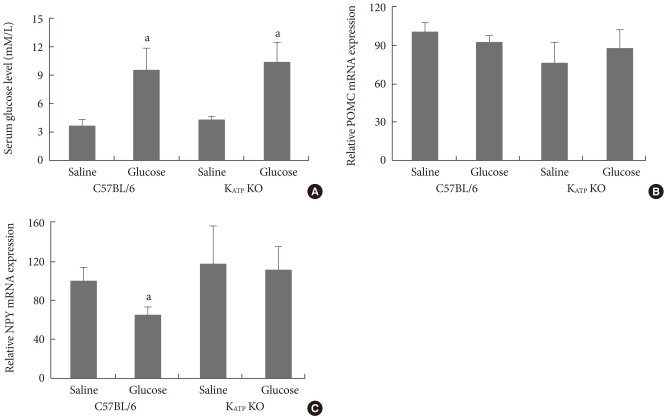
Fig. 2The average daily caloric intake (A) and deposition of retroperitoneal white adipose tissue (RT-WAT; B) in control or high fat diet-fed C57BL/6 (normal) and Kir6.2-deficient (KO) mice. Values are the mean±standard error of 5 to 10 experimental animals per group. N-C, normal control group; N-HF, high fat-fed normal mice; KO-C, control diet fed Kir6.2 KO mice; KO-HF, high fat diet-fed Kir6.2 KO mice. aP<0.05 vs. N-C, bP<0.05 vs. KO-C.
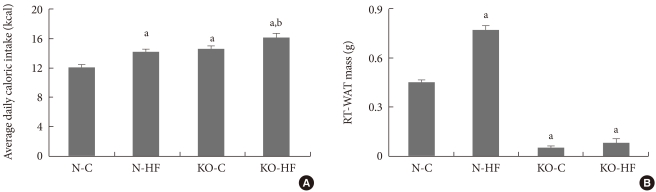
Fig. 3The serum levels of glucose (A), free fatty acids (FFA; B), insulin (C), and leptin (D), and the hypothalamic expressions of proopiomelanocortin (POMC; E) and neuropeptide Y (NPY; F) mRNA in control or high fat diet-fed C57BL/6 (normal) and Kir6.2-deficient (KO) mice. Values are the mean±standard error of 5 to 10 experimental animals per group. N-C, normal control group; N-HF, high fat-fed normal mice; KO-C, control diet-fed Kir6.2 KO mice; KO-HF, high fat diet-fed Kir6.2 KO mice. aP<0.05 vs. N-C.
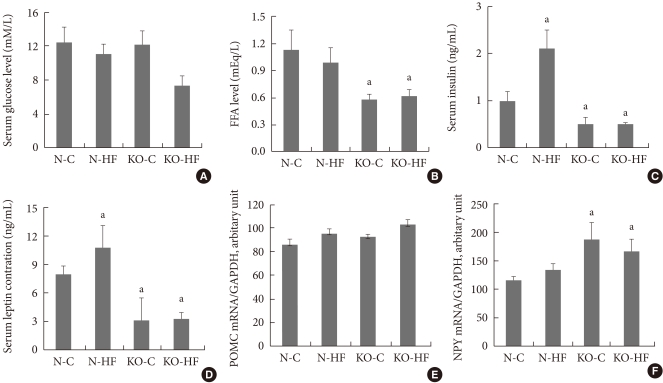
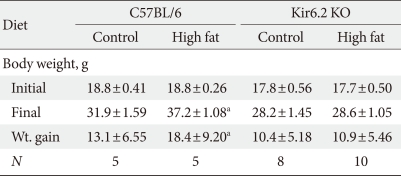
Figure & Data
References
Citations
Citations to this article as recorded by 
- 17β-estradiol promotes acute refeeding in hungry mice via membrane-initiated ERα signaling
Kaifan Yu, Yanlin He, Ilirjana Hyseni, Zhou Pei, Yongjie Yang, Pingwen Xu, Xing Cai, Hesong Liu, Na Qu, Hailan Liu, Yang He, Meng Yu, Chen Liang, Tingting Yang, Julia Wang, Pierre Gourdy, Jean-Francois Arnal, Francoise Lenfant, Yong Xu, Chunmei Wang
Molecular Metabolism.2020; 42: 101053. CrossRef - Brain Glucose-Sensing Mechanism and Energy Homeostasis
A. J. López-Gambero, F. Martínez, K. Salazar, M. Cifuentes, F. Nualart
Molecular Neurobiology.2019; 56(2): 769. CrossRef - The involvement of purinergic signalling in obesity
Geoffrey Burnstock, Daniela Gentile
Purinergic Signalling.2018; 14(2): 97. CrossRef - High‐fat‐diet‐induced remission of diabetes in a subset of KATP‐GOF insulin‐secretory‐deficient mice
Zihan Yan, Zeenat A. Shyr, Manuela Fortunato, Alecia Welscher, Mariana Alisio, Michael Martino, Brian N. Finck, Hannah Conway, Maria S. Remedi
Diabetes, Obesity and Metabolism.2018; 20(11): 2574. CrossRef - Hypothalamic arcuate nucleus glucokinase regulates insulin secretion and glucose homeostasis
Yue Ma, Risheka Ratnasabapathy, Chioma Izzi‐Engbeaya, Marie‐Sophie Nguyen‐Tu, Errol Richardson, Sufyan Hussain, Ivan De Backer, Christopher Holton, Mariana Norton, Gaelle Carrat, Blanche Schwappach, Guy A. Rutter, Waljit S. Dhillo, James Gardiner
Diabetes, Obesity and Metabolism.2018; 20(9): 2246. CrossRef - Overexpression of WNK1 in POMC-expressing neurons reduces weigh gain via WNK4-mediated degradation of Kir6.2
Woo Young Chung, Jung Woo Han, Woon Heo, Min Goo Lee, Joo Young Kim
Molecular and Cellular Biochemistry.2018; 447(1-2): 165. CrossRef - Insights into the role of neuronal glucokinase
Ivan De Backer, Sufyan S. Hussain, Stephen R. Bloom, James V. Gardiner
American Journal of Physiology-Endocrinology and Metabolism.2016; 311(1): E42. CrossRef - Obesogenic and Diabetogenic Effects of High-Calorie Nutrition Require Adipocyte BK Channels
Julia Illison, Lijun Tian, Heather McClafferty, Martin Werno, Luke H. Chamberlain, Veronika Leiss, Antonia Sassmann, Stefan Offermanns, Peter Ruth, Michael J. Shipston, Robert Lukowski
Diabetes.2016; 65(12): 3621. CrossRef -
ABCC8 R1420H Loss-of-Function Variant in a Southwest American Indian Community: Association With Increased Birth Weight and Doubled Risk of Type 2 Diabetes
Leslie J. Baier, Yunhua Li Muller, Maria Sara Remedi, Michael Traurig, Paolo Piaggi, Gregory Wiessner, Ke Huang, Alyssa Stacy, Sayuko Kobes, Jonathan Krakoff, Peter H. Bennett, Robert G. Nelson, William C. Knowler, Robert L. Hanson, Colin G. Nichols, Clif
Diabetes.2015; 64(12): 4322. CrossRef - Glucokinase activity in the arcuate nucleus regulates glucose intake
Syed Hussain, Errol Richardson, Yue Ma, Christopher Holton, Ivan De Backer, Niki Buckley, Waljit Dhillo, Gavin Bewick, Shuai Zhang, David Carling, Steve Bloom, James Gardiner
Journal of Clinical Investigation.2015; 125(1): 337. CrossRef - Dissecting the Etiology of Type 2 Diabetes in the Pima Indian Population
Ewan R. Pearson
Diabetes.2015; 64(12): 3993. CrossRef - Ocular Hypotensive Effects of the ATP-Sensitive Potassium Channel Opener Cromakalim in Human and Murine Experimental Model Systems
Uttio Roy Chowdhury, Cindy K. Bahler, Bradley H. Holman, Peter I. Dosa, Michael P. Fautsch, Ted S Acott
PLOS ONE.2015; 10(11): e0141783. CrossRef - Differential gene expression pattern in hypothalamus of chickens during fasting-induced metabolic reprogramming: Functions of glucose and lipid metabolism in the feed intake of chickens
Xin-Ling Fang, Xiao-Tong Zhu, Sheng-Feng Chen, Zhi-Qi Zhang, Qing-Jie Zeng, Lin Deng, Jian-Long Peng, Jian-Jian Yu, Li-Na Wang, Song-Bo Wang, Ping Gao, Qing-Yan Jiang, Gang Shu
Poultry Science.2014; 93(11): 2841. CrossRef - Combined Treatment of Betulinic Acid, a PTP1B Inhibitor, with Orthosiphon stamineus Extract Decreases Body Weight in High-Fat–Fed Mice
Yoon-Jung Choi, So-Young Park, Jong-Yeon Kim, Kyu-Chang Won, Bo-Ra Kim, Jong-Keun Son, Seung-Ho Lee, Yong-Woon Kim
Journal of Medicinal Food.2013; 16(1): 2. CrossRef
 PubReader
 Cite
Cite


