- Current
- Browse
- Collections
-
For contributors
- For Authors
- Instructions to authors
- Article processing charge
- e-submission
- For Reviewers
- Instructions for reviewers
- How to become a reviewer
- Best reviewers
- For Readers
- Readership
- Subscription
- Permission guidelines
- About
- Editorial policy
Articles
- Page Path
- HOME > Diabetes Metab J > Volume 44(6); 2020 > Article
-
Original ArticleDrug/Regimen Metformin Preserves Peripheral Nerve Damage with Comparable Effects to Alpha Lipoic Acid in Streptozotocin/High-Fat Diet Induced Diabetic Rats
-
Sun Hee Kim
 , Tae Sun Park, Heung Yong Jin
 -
Diabetes & Metabolism Journal 2020;44(6):842-853.
DOI: https://doi.org/10.4093/dmj.2019.0190
Published online: May 28, 2020
Division of Endocrinology and Metabolism, Department of Internal Medicine, Jeonbuk National University Medical School, Research Institute of Clinical Medicine of Jeonbuk National University-Biomedical Research Institute of Jeonbuk National University Hospital, Jeonju, Korea
- Corresponding author: Heung Yong Jin. Division of Endocrinology and Metabolism, Department of Internal Medicine, Jeonbuk National University Medical School, 20 Geonji-ro, Deokjin-gu, Jeonju 54907, Korea. mdjinhy@jbnu.ac.kr
Copyright © 2020 Korean Diabetes Association
This is an Open Access article distributed under the terms of the Creative Commons Attribution Non-Commercial License (http://creativecommons.org/licenses/by-nc/4.0/) which permits unrestricted non-commercial use, distribution, and reproduction in any medium, provided the original work is properly cited.
ABSTRACT
-
Background
- Metformin is widely marketed medication for the treatment of diabetes, but its pharmacological effect on diabetic peripheral neuropathy remains unclear. In this study, the effect of metformin on peripheral nerves in diabetic rats was investigated using diverse neuronal parameters of nerve fibers.
-
Methods
- Rats were assigned to one of four groups (n=7 to 10 per group): normal, diabetes mellitus (DM), DM+metformin (100 mg/kg), and DM+alpha lipoic acid (ALA, 100 mg/kg). DM was induced by streptozotocin/high-fat diet (STZ/HFD). After 12 weeks, the sensory thresholds to mechanical and heat stimuli were assessed. Repeated sensory tests, immunofluorescence microscopic comparison of peripheral nerves, and biochemical blood analysis were performed after 24 weeks.
-
Results
- Both DM+metformin and DM+ALA groups showed similar trends to diverse sensory tests at 24 weeks compared to DM group although the degree of change were different according to the stimulated senses. There was no significant difference in the comparison of the intraepidermal nerve fiber density (IENFD) of peripheral nerves between the DM+metformin and DM+ALA groups (11.83±0.07 fibers/mm vs. 12.37±1.82 fibers/mm, respectively). Both groups showed preserved IENFD significantly compared with DM group (8.46±1.98 fibers/mm, P<0.05). Sciatic nerve morphology of the experimental animals showed a similar trend to the IENFD, with respect to axonal diameter, myelin sheath thickness, and myelinated fiber diameter.
-
Conclusion
- Metformin has beneficial pharmacological effects on the preservation of peripheral nerves in diabetic rats and its effects are comparable to those of ALA.
- Diabetic peripheral neuropathy (DPN) is an important cause of foot ulceration and non-traumatic amputation of the leg. Moreover, it affects quality of life due to troublesome neuropathic symptoms [12]. There are few drugs targeting the pathogenesis of DPN, and most drugs for this condition only provide symptomatic relief. Fundamentally correcting or halting the progression of DPN is difficult using current therapeutic strategies, with the exception of strict glucose control. Causes of DPN include complex pathological processes and several studies have investigated whether DPN can be prevented or reversed by correction of these problems [3]. Until now, alpha lipoic acid (ALA), which is a potent antioxidant, has been considered as only pathogenic treatment that is available in the clinical care of DPN patients.
- These days, it is important to note that anti-diabetic agents can also have additional beneficial effects in the prevention of diverse complication of diabetic patients, beyond their glucose-lowering effects. Several anti-diabetic medications, including thiazolidinedione, glucagon-like peptidase 1 receptor agonist (GLP-1 RA), dipeptidyl peptidase IV inhibitor, and metformin [4,5,6] have been reported to show beneficial effects in DPN patients. Various possible pathways of these agents, such as anti-apoptotic, neurotropic, and anti-inflammatory pathways, may be involved in their beneficial effects. Pioglitazone has been shown to attenuate tactile allodynia and thermal hyperalgesia in mice through the inhibition of proinflammatory cytokine up-regulation by peroxisome proliferator-activated receptor γ [7]. Rosiglitazone reduces oxidative stress and decreases thermal hypoalgesia in streptozotocin (STZ) induced diabetes mellitus (DM) mice [8]. GLP-1 RA has been reported to have anti-apoptotic and neurotrophic effects on neurons of the central nervous system and nerve growth factor-like effects on peripheral nerves [59]. Vildagliptin has been suggested to be associated with the preservation of peripheral nerve degeneration in STZ induced DM rats [6]. However, a clear relationship between anti-diabetic agents and DPN has not been established in the clinical practice.
- Metformin is the first-line anti-diabetic drug for the management of hyperglycemia in type 2 diabetes mellitus (T2DM) patients, and it is currently the most widely prescribed oral anti-diabetic medication [10]. Moreover, metformin has beneficial effects on carbohydrate metabolism, weight loss, and vascular protection. However, many studies have reported the association between metformin use and vitamin B12 deficiency, which causes peripheral neuropathy in diabetic patients [1112]. Recently, American Diabetes Association (ADA) recommended that periodic measurement of vitamin B12 levels should be considered in metformin-treated diabetic patients, due to the risk of peripheral neuropathy and it emphasized the importance of excluding vitamin B12 deficiency in patients with DPN [13]. However, other studies reported that there was no association between metformin and vitamin B12 deficiency on the contrary [1415]. Furthermore, some studies reported that metformin preserved a peripheral neuropathy in diabetic animals and improved a neuropathy in several radiculopathy patients [1617].
- Therefore, in this study, we investigated the pharmaceutical effect of metformin on the peripheral nerves of STZ/high-fat diet (HFD) induced diabetic rats, in comparison with ALA.
INTRODUCTION
- Animals
- All experiments were performed after approval of the protocol by the Institutional Rat Care and Use Committee of the Jeonbuk National University Hospital (CUH-IACUC-2017-8-2). Six-to-eight-week-old male Sprague-Dawley rats were housed under optimal conditions, with a 12-hour light/dark cycle. The temperature of the room was 23℃ and the humidity was maintained at 53%. Animals had free access to food and water. In these experiments, animals with similar glucose levels were necessary to minimize the metabolic effects on nerves. Diabetes was induced by injecting STZ (Sigma, St. Louis, MO, USA), dissolved in 0.1 mol/L sodium citrate buffer (30 mg/kg body weight), intraperitoneally for 2 days in rats fed a high-fat diet (VHFD 60 kcal%; Research Diets Inc., New Brunswick, NJ, USA) during the experimental period. Normal control rats received the same volume of sterile saline intraperitoneally. Blood samples were drawn from the tail vein and blood glucose levels were measured using a Precision Xtra Plus instrument (MediSence Product, Abbott Laboratories, Bedford, MA, USA). Rats with blood glucose levels greater than 250 mg/dL were considered as diabetes in our experiments.
- Experimental design
- Animals were divided by normal and DM groups. DM groups were randomly selected and allocated into three groups (n=7 to 10 per group), according to the following treatment regimens: DM, DM+ALA, and DM+metformin groups. Metformin (100 mg/kg/day) was administrated orally and 0.5% ALA (100 mg/kg/day) was mixed with daily food. Treatment doses were decided after taking into consideration the human-rat dose conversion. To compare the neuronal effect with minimalizing glucose lowering effect from metformin treatment, metformin dose in our experiment (100 mg/kg/day) was determined in consideration of therapeutic range as anti-diabetic drug. After 12 weeks, diverse sensory thresholds of mechanical and heat stimuli were assessed. Repeated sensory tests, immunofluorescence microscopic counting of cutaneous small nerve fibers and measurement of sciatic nerves, and biochemical serum analysis were performed at 24 weeks.
- Blood chemistry analysis and Sensory test
- Blood samples were obtained by cardiac puncture after sacrificing the rats at the end of the study period. Plasma levels of vitamin B12, glutathione, and tumor necrosis factor α (TNF-α) were compared among experimental groups. Plasma was collected after centrifugation at 600×g for 10 minutes in a 10 mM potassium phosphate buffer containing 1 mM ethylenediaminetetraacetic acid (EDTA). A commercially available kit (NycoCard, Oslo, Norway) was used to measure glycosylated hemoglobin (HbA1c) levels. Enzyme-linked immunosorbent assay (ELISA) kits were used to measure glutathione (Cayman Chemical, Ann Arbor, MI, USA), TNF-α (R&D Systems Inc., Minneapolis, MN, USA), and vitamin B 12 (MyBioSource, San Diego, CA, USA) levels respectively.
- Tactile stimulation was performed using a flexible von Frey filament (Stoelting, Wood Dale, IL, USA) to evaluate the sensitivity of the hind paw to mechanical stimuli. The assessing method was as follows. After adaptation to the testing condition for at least 20 minutes, experimental rats were placed in a plastic case with a 1 cm perforated mesh. Von Frey filament, with calibrated bending forces (in g), was applied to the plantar surface of the hind paw to deliver tactile stimuli of varying intensity. We performed the stimulation five times with 5 seconds intervals. Immediate withdrawal in at least one of the five applications was determined to be a positive response. To measure thermal response, rats were placed on a hot plate (UgoBasile, Collegeville, PA, USA) with temperature 55℃. The latency to the first sign of a paw-licking response to avoid the heat was taken as the threshold for heat sensitivity. The tail flick response was assessed by measuring the withdrawal time of the tail from the hot plate. These withdrawal times (in seconds) also determined the threshold for heat sensitivity. A Randall-Selittometer (UgoBasile, Comerio, Italy) was used to assess pressure threshold.
- Immunofluorescence and neuronal quantification
- At 12 weeks, 3×3 mm tissues were taken from the dorsum of the foot, via skin biopsy, for immunofluorescence analyses of intraepidermal nerve fiber density (IENFD). At 24 weeks, after killing all rats under deep anesthesia, we obtained cutaneous tissue samples from the foot and segments of sciatic nerve. We fixed the skin samples with periodate-lysine-paraformaldehyde solution (2% paraformaldehyde, 0.075 M lysine, 0.05 M phosphate buffer, and 0.01 M sodium periodate) for 24 hours. We rinsed these samples in phosphate-buffered saline (PBS) (20% glycerol and 0.1 M phosphate buffer) for 48 hours at 4℃ and cryoprotected using Tissue-Tek (Miles, Elkhart, IN, USA). We prepared sections of 40 µm in thickness with a sliding microtome (Leica CM 1510, Leica Microsystems AG, Wetzlar, Germany) and washed twice in PBS for 10 minutes. The samples were incubatedin 0.25% potassium permanganate for 15 minutes, PBS wash for 2 minutes, and 4.5% oxalic acid for 2 minutes. Then, these samples transferred into microcentrifuge tubes containing Protein Block, Serum-Free (Dako, Carpinteria, CA, USA), supplemented with 1% normal goat serum as a blocking buffer. After 30 minutes of blocking on a shaking table, we washed the specimens with PBS twice for 10 minutes and incubated overnight in primary antibody (diluted 1:1,000) at 4℃. The primary antibody was rabbit anti-protein-gene-product 9.5 (PGP 9.5; Bio-Rad, Poole, UK). After washing, we incubated the samples with the secondary antibody, goat anti-rabbit immunoglobulin G-floresceinisothiocyanste (FITC, 1:200, Vector, Sheffield, UK) for 1 hour in dark room. After washing with PBS, sections were placed on slides and mounted with a fluorescent mounting media (Dako, Carpinteria, CA, USA). We measured subcutaneous innervation based on immunofluorescence, and quantified IENFD. The number of intraepidermal nerve fibers (IENFs) per length (fibers/mm) was considered as the amount of innervation.
- Sciatic nerve tissues were immersed in a fixative (10% formaldehyde) and incubated overnight at 4℃. Samples were then embedded in paraffin for serial sectioning using a microtome and the resulting 5 µm transverse sections were stained with toluidine blue. Myelinated fibers and axonal area in the sciatic nerve, represented by the outer or inner border of myelin sheath, were measured using the aid of ZEN image analysis program of the Axiocam 506 camera (Axiocam 506 color; Zeiss, Goettingen, Germany). To avoid any possible bias, two independent investigators blinded to the experimental groups, counted IENFD and assessed sciatic nerve fibers.
- Statistical analysis
- All data are expressed as mean±standard deviation. One-way analysis of variance (ANOVA) with Duncan's post hoc test was used to compare experimental groups. The confidence interval for testing the differences between groups was 95%, and results with P<0.05 were considered statistically significant. Statistical analyses were performed using SPSS version 18.0 software (SPSS Inc., Chicago, IL, USA).
METHODS
- Body weight and blood glucose levels of experimental groups
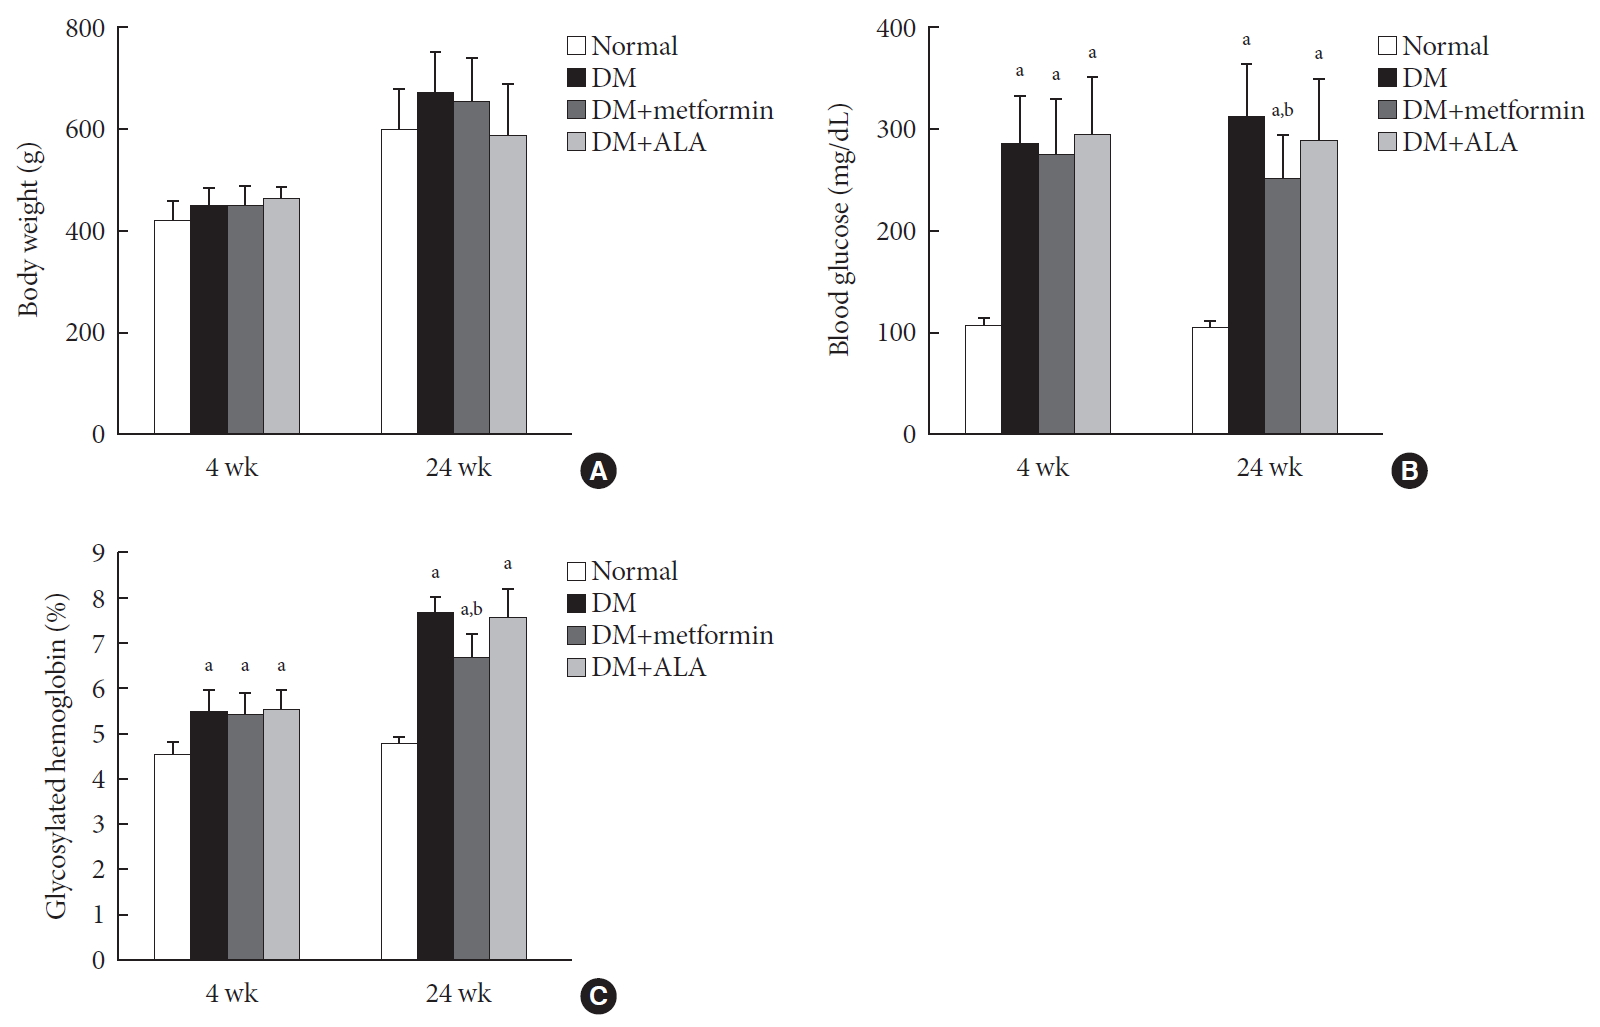
- Body weight and blood glucose levels of experimental groups were compared at 4 and 24 weeks after diabetes induction. The time of 4 weeks was starting point of treatment. The body weight of all groups increased constantly during the experimental period and there were no significant differences in body weight among the groups (Fig. 1A). However, the increased body weight trend was less pronounced in the DM+ALA group compared to the other DM groups as shown in Fig. 1A. At 24 weeks, blood glucose levels were 102.5±7.4, 311.8±50.8, 251.3±42.3, and 289.1±59.5 mg/dL in the normal control, DM, DM+metformin, and DM+ALA groups, respectively. Blood glucose levels in all DM groups were significantly higher than those in the normal group (P<0.05). The DM+metformin group also showed a reduced blood glucose level compared with those of the DM or DM+ALA groups (P<0.05) as shown in Fig. 1B. The HbA1c levels showed similar trends to the blood glucose levels as shown in Fig. 1C. At 24 weeks, HbA1c levels were 4.7%±0.3%, 7.6%±0.3%, 6.7%±0.5%, and 7.5%±0.6% in the normal control, DM, DM+metformin, and DM+ALA groups, respectively. The DM+metformin group showed lower HbA1c significantly compared to other DM groups (P<0.05).
- Comparison of diverse sensory tests during the experimental period
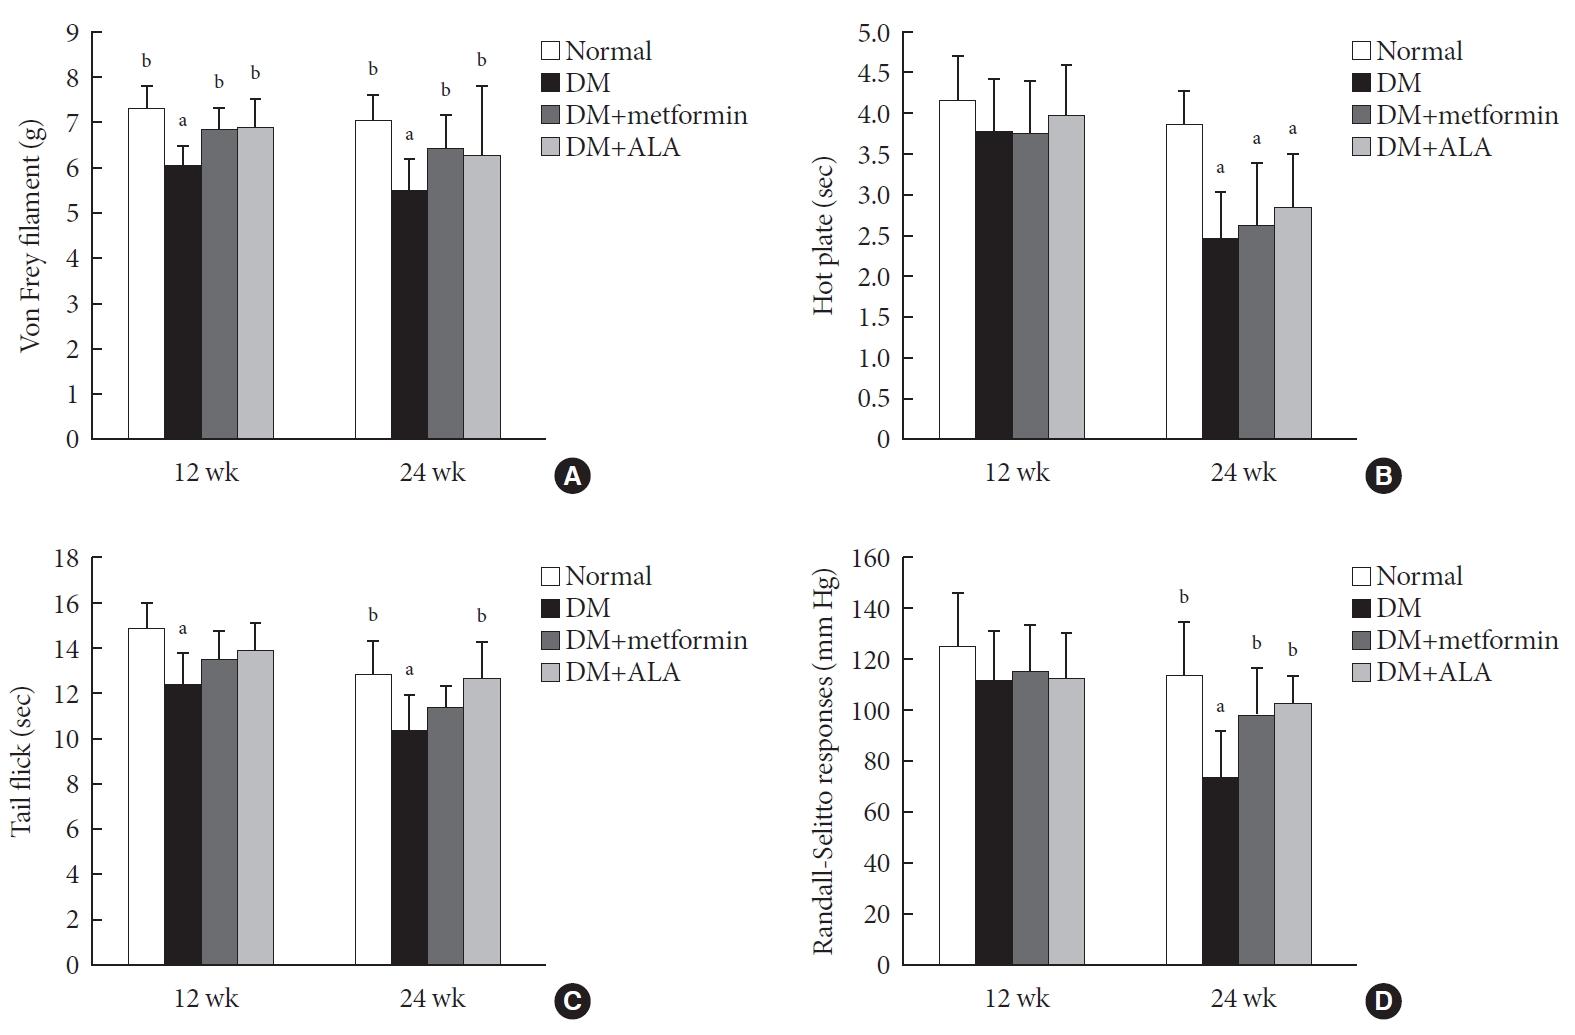
- At 12 weeks, the paw withdrawal threshold, when stimulated with a von Frey filament, was reduced in the diabetic group compared to the normal group. This reduction was significantly prevented in DM+metformin and DM+ALA groups compared with non-treated DM group in Fig. 2A (P>0.05). However, there was no significant difference in the degree of threshold reduction in tactile response between the DM+metformin and DM+ALA groups (P>0.05). At 24 weeks, this pattern of response to the von Frey filament was sustained in the DM+metformin or DM+ALA groups and significant difference was not observed between DM+metformin and DM+ALA groups (P>0.05) (Fig. 2A). Significant difference was also maintained in the DM+metformin and DM+ALA group compared with DM group at 24 weeks (P<0.05).
- At 12 weeks, the hind paw-licking time on the hot plate was not significantly different among the experimental groups. However, at 24 weeks, paw-licking time was significantly reduced in the all DM groups compared with the normal control group (P<0.05). However, significant differences were not observed among DM groups, irrespective of metformin or ALA treatment, although, less reduced trends were observed in DM+metformin and DM+ALA groups compared with non-treated DM group (Fig. 2B). The tail flick test showed similar results to the hot plate test, at both 12 and 24 weeks. The time of tail flick test on the hot plate was reduced significantly in the non-treated DM group compared with that of normal group (P<0.05). However, this latency time was less reduced in the DM+metformin and DM+ALA groups compared with non-treated DM group although significant differences were only observed in the DM+ALA group (Fig. 2C). At 12 weeks, there were no significant differences in pressure threshold, as assessed by the Randall-Selitto response. However, at 24 weeks, the threshold of pressure stimulus was more reduced in non-treated DM group and this reduction was blunted in the DM+metformin and DM+ALA groups significantly (P<0.05) (Fig. 2D).
- Comparison of IENFD of experimental groups
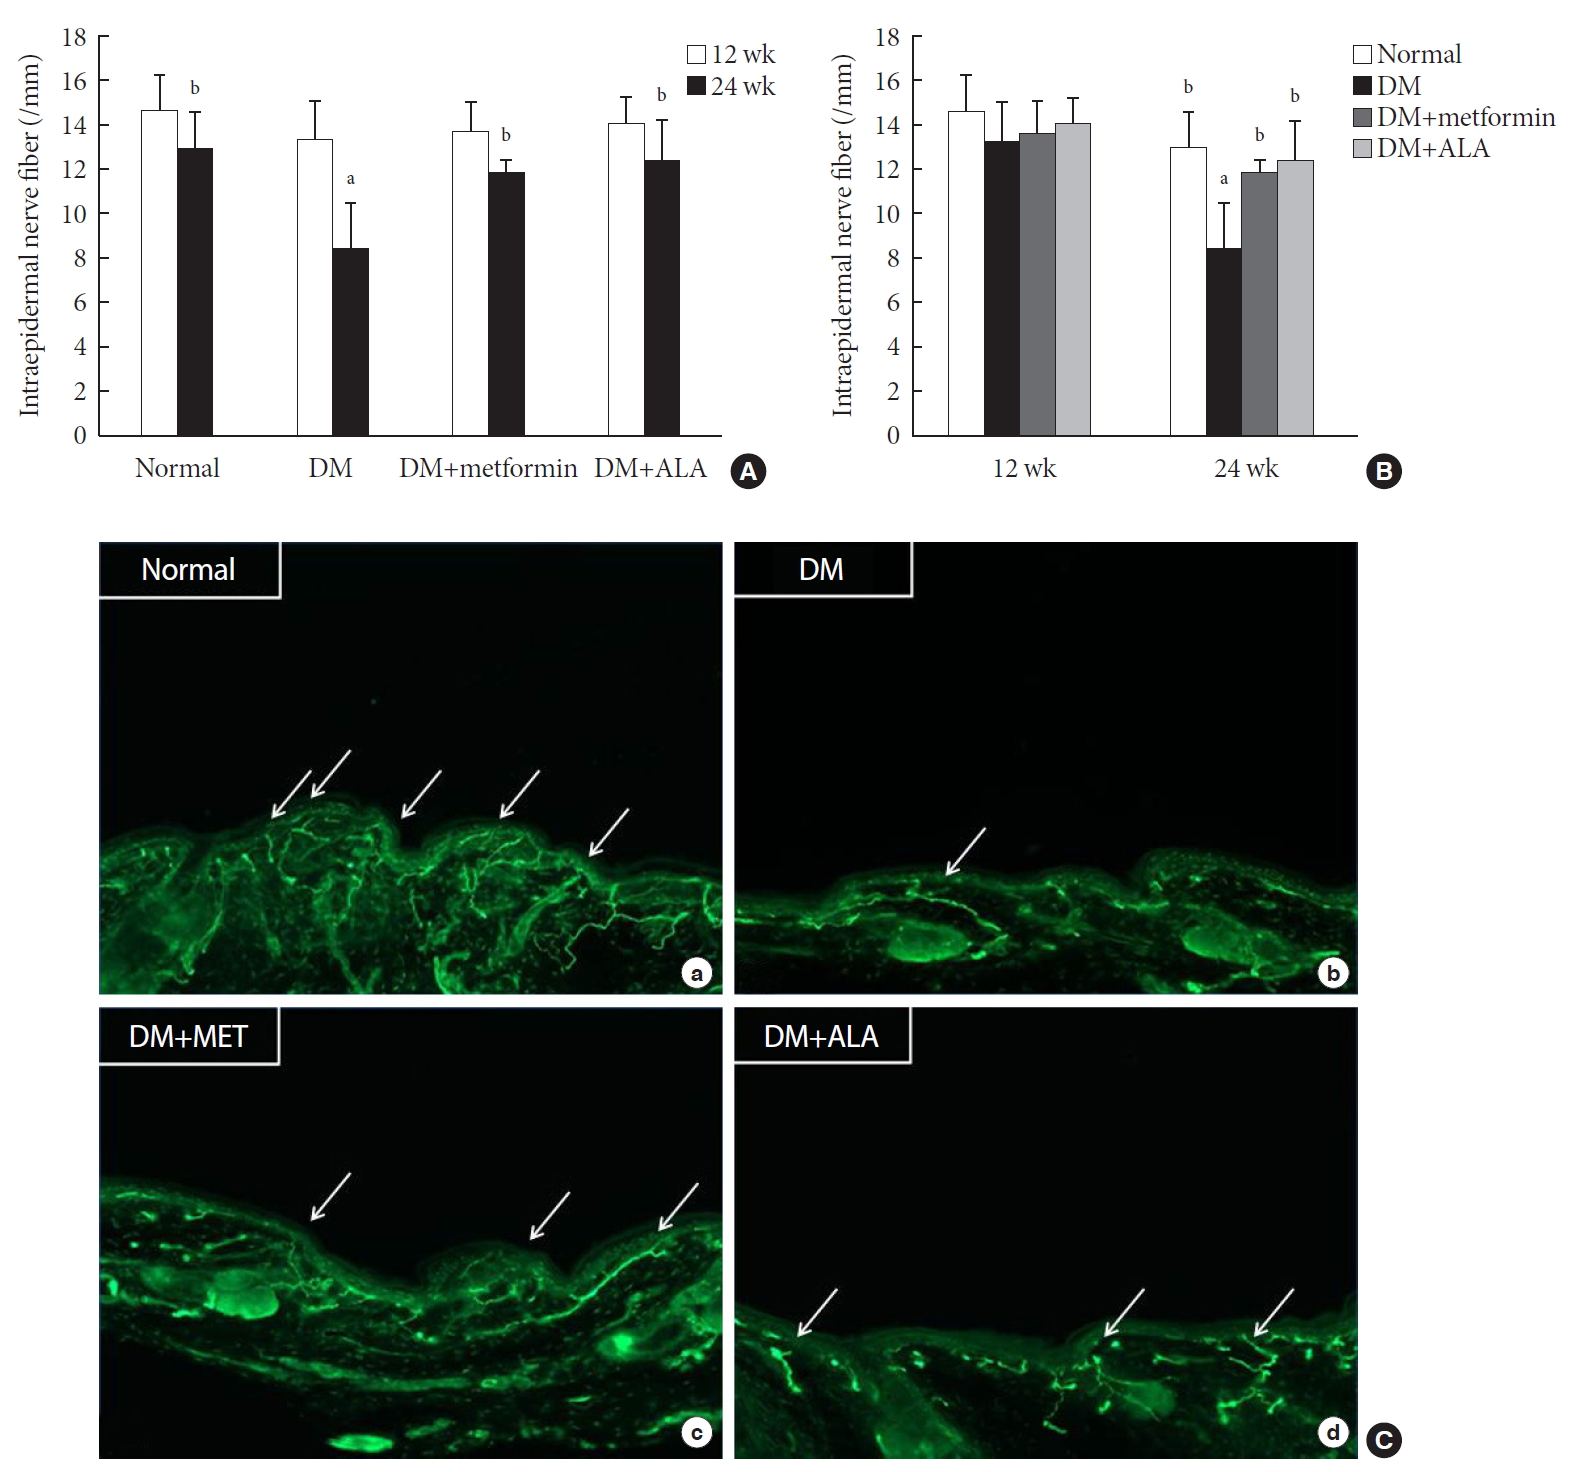
- At 24 weeks, cutaneous peripheral nerve quantity, as assessed by IENFD measurement, was markedly decreased in non-treated DM group, by approximately 35%, compared with the normal group. However, this reduction in IENFD was preserved in the DM+metformin and DM+ALA groups (11.83±0.07 fibers/mm vs. 12.37±1.82 fibers/mm) compared with the non-treated DM group (8.46±1.98 fibers/mm, P<0.05). This preservation of IENFD was not significantly different between the DM+metformin and DM+ALA groups (Fig. 3A and B). Immunostained small nerve fibers were shown as in the Fig. 3C and more decreased small nerve fibers were observed in non-treated DM group compared with the normal, DM+metformin, and DM+ALA groups.
- Morphometric and quantitative comparisons of sciatic nerves among experimental rats
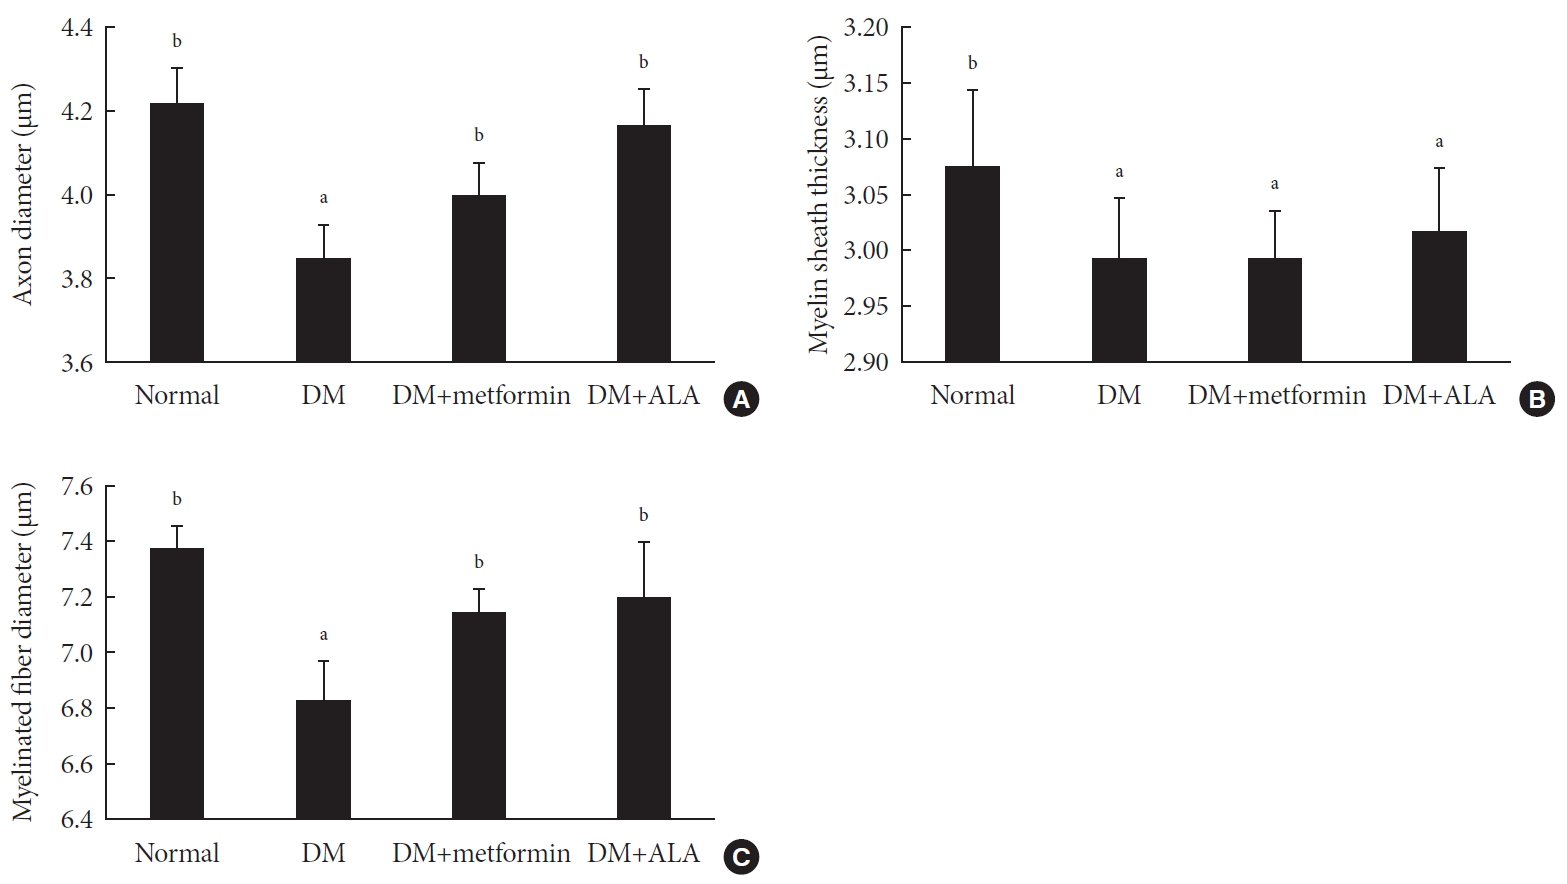
- Examinations of sciatic nerves showed a similar trend to the IENFD results. The mean axon diameter was 4.23±0.08 µm in the normal group, 3.85±0.08 µm in the DM group, 4.00±0.08 µm in the DM+metformin group, and 4.17±0.09 µm in the DM+ALA group, respectively (Fig. 4A). However, there were no significant differences in myelin sheath thickness among the DM groups (P>0.05) (Fig. 4B). The mean diameter of myelinated fibers was 7.34±0.08 µm in the normal group, 6.83±0.13 µm in the DM group, 7.16±0.08 µm in the DM+metformin group, and 7.20±0.19 µm in the DM+ALA group (Fig. 4C). Mean axon and myelinated fiber diameters were significantly reduced in the non-treated DM groups compared with the normal group (P<0.05). This reduction was significantly prevented in the DM+metformin and DM+ALA groups (P<0.05) (Fig. 4C). However, significant differences in axonal diameter or myelinated fiber diameter were not observed between DM+metformin and DM+ALA groups. Morphological findings of sciatic nerves according to the different intervention are shown in Fig. 5.
- Comparison of vitamin B12, glutathione, and TNF-α levels in blood of experimental groups
- At 24 weeks, significant difference of plasma vitamin B12 levels were not observed among experimental groups (163.84±30.4 pmol/L in the normal control group, 158.37±28.5 pmol/L in the DM group, 151.4±35.4 pmol/L in the DM+metformin group, and 139.53±29.1 pmol/L in the DM+ALA group (Fig. 6A). Plasma glutathione levels also did not show significant differences in the experimental groups (Fig. 6B). However, TNF-α level was significantly higher in the DM group compared withthe normal control group (P<0.05). This TNF-α lever was reduced in the DM+metformin and DM+ALA groups and significant difference was not observed between these DM+metformin and DM+ALA groups (Fig. 6C).
RESULTS
- Our study showed that metformin did not more worsen peripheral nerve damage of experimental diabetes during diabetes progression, but rather, gave similar benefits to ALA in the preservation of peripheral nerves. Metformin also was not associated with vitamin B12 deficiency in the experimental diabetic rats in this study.
- DPN is a common complication, affecting over 30% of diabetic patients, with an incidence of 2% per year [1318]. DPN causes a diverse range of positive and negative neuronal symptoms, including pain, parenthesis, and numbness. The basic pathogenic mechanism of DPN can be divided into metabolic and vascular etiologies. A number of mechanisms have been suggested for the pathogenesis of DPN. Various metabolites can result in increased oxidative stress in peripheral nerves and oxidative stress from hyperglycemia can cause vascular impairment, leading to nerve damage [19]. Diminished levels of nerve growth factors and various inflammatory markers are also involved in the pathogenesis of DPN [20]. Diverse therapeutic approaches have been developed based on these pathogenic mechanisms of DPN [21]. However, effective treatments focusing on the pathogenic correction of DPN are limited in the clinical practice, with the exception of strict blood glucose control. ALA, gamma linoleic acid, and aldose reductase inhibitors have been considered as pathogenic agents in DPN management [21]. However, symptomatic relief is the principle method that is commonly tried for the management of DPN.
- Metformin is the first-line glucose-lowering agent and it is widely used for the treatment of diabetic patients. However, there are inconsistent reports on the relationship between metformin treatment and vitamin B12 deficiency in patients with DPN [142223]. Therefore, whether there is a relationship between metformin-related vitamin B12 deficiency and peripheral neuropathy needs to be clarified [15]. Metformin dose used in our study did not significantly reduce vitamin B12 levels in DM rats when compared with the normal control group or the DM+ALA group. Moreover, the neuroprotective benefit of metformin via diverse effect besides glucose lowering benefit should not be overlooked in the management of diabetic patients [24]. Metformin has a direct anti-neuropathic impact on neurons via the inhibition of oxidative stress-related apoptotic cell death. Recently, neuroprotective and anti-neuropathic effects that are independent of glucose-lowering effects have been reported for metformin [25] and neuropathic symptoms, including numbness and pain from chemotherapy-induced neuropathy are relieved by metformin in mice [26]. Ethanol-induced neuronal apoptosis prevented by metformin and enhanced neurogenesis has been shown in a preclinical study [27]. Metformin also suppresses cortical neuronal apoptosis [25] and exerts neuroprotective effects in mice with Parkinson's disease [28]. These anti-neuropathic effects of metformin may be mediated by 5′ adenosine monophosphate-activated protein kinase (AMPK) activation and impaired AMPK signaling is linked to peripheral neuropathy in experimental animals [2429]. Furthermore, another retrospective clinical study reported that the use of metformin was associated with decreased lumbar radiculopathy pain, unrelated to its anti-hyperglycemic function in diabetic patients [17]. In the present study, the increase in TNF-α level in DM rats was reduced after metformin treatment. Anti-inflammatory processes mediated by TNF-α may have played a role in the peripheral nerve protection seen in the DM+metformin group. Furthermore, in this study, metformin treatment showed beneficial effects on the preservation of peripheral nerves that were with comparable to those of ALA in the assessment of sensory tests and morphometric parameter. Therefore, a positive effect of metformin on DPN should not be overlooked.
- Sensory test responses can change and be degenerated according to experimental duration irrespective of hyperglycemia or intervention besides disease state and weight differences irrespective of neuronal damage. Thus, these results were difficult to interpret. In our study, we found that DM rats were more sensitive and exhibited a more abnormal response to von Frey stimulation at 12 weeks. Similar trend of sensitive responses to von Frey stimulation were maintained until 24 weeks. Allodynia may be more prominent in the early stages of DPN and it is important to detect more vulnerable small nerve fibers. DPN can manifest with positive or negative symptoms and mixed symptoms are also possible, depending on the diabetes duration and severity. Therefore, our sensory response data need to be interpreted in association with the quantity of peripheral nerves. At 12 weeks, the hypersensitive reaction to a von Frey filament was reduced through metformin and ALA treatment. Results also showed decreased IENFD in DM rats, which suggested that the more hypersensitive reaction may have resulted from the degeneration of small nerve fibers. At 24 weeks, treatment with metformin and ALA also blunted this sensitivity in agreement with the IENFD results. These results suggested that DPN progression may be prevented by metformin or ALA treatment, which improved in the sensory response part in DM rats. However, more sensitive responses were observed in DM rats compared to other groups irrespective of more reduced IENFD. Therefore, discrepancy between sensory tests and IENFD is also carefully considered although consistent findings of blunted sensory tests to IENFD reduction according to time passage are usually expected. We thought that one of reason of this discrepancy was that our animal model was less severe state of T2DM model and diverse sensory tests can be presented at the progressive stage of DPN. Of course, dissociation of nociception and IENFD is also possible before IENFD loss [30]. In sciatic nerves, our study showed that treatment with metformin or ALA attenuated decreases of axonal diameter and myelinated fiber diameter, but myelin sheath thickness was not significantly preserved although myelin sheath composed with Schwann cells is important for axonal function and structural support [31]. Therefore, further studies targeting for myelin sheath function and morphometric analysis need to be performed in the future.
- There may be various effects of metformin, but this study did not exclude completely the glucose lowering benefit from metformin treatment, so further studies to show mechanism of neuroprotective pathways irrespective of glucose control are needed. In addition, our study used single metformin dose, and this dosage might be low dose and slightly short duration to cause metformin related vitamin B12 deficiency. Therefore, metformin treatment of different doses with long duration is warranted to show clearly whether there is a metformin-specific neuroprotective benefit or not. Previously, we reported that insulin based glucose control showed similar neuroprotective potential in the sensory tests and anti-oxidant levels compared to ALA in STZ induced diabetic rats [32]. Therefore, glucose lowering benefit in the metformin treated DM group needs to be separated for metformin-specific neuroprotective effect.
- Our study has several limitations. First, diverse doses of metformin need to be used to support the beneficial effect of metformin on the peripheral nerve protection in diabetes more strongly. The dose of metformin in our study might be relatively low and the duration was slightly short. Second, investigations of the exact mechanisms of the effects of metformin on DPN progression were not performed in this study. The measurement of diverse oxidative stress markers in the target tissue and well known pro-inflammatory and inflammatory markers including C-reactive protein, IL (interleukin) series, and nuclear factor-κB pathways, besides AMPK would provide greater support for the therapeutic mechanisms of metformin. Third, the effect of glucose control by metformin was not completely separated from the benefit of neuroprotection in metformin-treated diabetic animals. Therefore, metformin treatment with type 1 diabetes mellitus (TIDM) model or animal showing more severe hyperglycemia needs to be investigated in the future.
- In summary, this study firstly indicates that metformin can provide beneficial effects in the preservation of peripheral nerves in diabetic rats to a comparable degree as ALA. Therefore, the positive effects of metformin on peripheral nerves need to be considered in the management of patients with DPN.
DISCUSSION
-
Acknowledgements
- The authors thank the Research Institute of Clinical Medicine of Jeonbuk National University—Biomedical Research Institute of Jeonbuk National University Hospital for supporting this study partly through access to experimental facilities. This paper was supported by research funds for newly appointed professors of Jeonbuk National University in 2017.
ACKNOWLEDGMENTS
-
CONFLICTS OF INTEREST
No potential conflict of interest relevant to this article was reported.
-
AUTHOR CONTRIBUTIONS
Conception or design: T.S.P., H.Y.J.
Acquisition, analysis, or interpretation of data: S.H.K., T.S.P., H.Y.J.
Drafting the work or revising: S.H.K., H.Y.J.
Final approval of the manuscript: H.Y.J.
NOTES
- 1. Tesfaye S. Advances in the management of diabetic peripheral neuropathy. Curr Opin Support Palliat Care 2009;3:136-143.ArticlePubMed
- 2. Vinik AI, Park TS, Stansberry KB, Pittenger GL. Diabetic neuropathies. Diabetologia 2000;43:957-973.ArticlePubMedPDF
- 3. Tesfaye S, Boulton AJ, Dyck PJ, Freeman R, Horowitz M, Kempler P, Lauria G, Malik RA, Spallone V, Vinik A, Bernardi L, Valensi P. Toronto Diabetic Neuropathy Expert Group. Diabetic neuropathies: update on definitions, diagnostic criteria, estimation of severity, and treatments. Diabetes Care 2010;33:2285-2293.ArticlePubMedPMCPDF
- 4. Griggs RB, Donahue RR, Adkins BG, Anderson KL, Thibault O, Taylor BK. Pioglitazone inhibits the development of hyperalgesia and sensitization of spinal nociresponsive neurons in type 2 diabetes. J Pain 2016;17:359-373.ArticlePubMed
- 5. Perry T, Lahiri DK, Chen D, Zhou J, Shaw KT, Egan JM, Greig NH. A novel neurotrophic property of glucagon-like peptide 1: a promoter of nerve growth factor-mediated differentiation in PC12 cells. J Pharmacol Exp Ther 2002;300:958-966.ArticlePubMed
- 6. Jin HY, Liu WJ, Park JH, Baek HS, Park TS. Effect of dipeptidyl peptidase-IV (DPP-IV) inhibitor (Vildagliptin) on peripheral nerves in streptozotocin-induced diabetic rats. Arch Med Res 2009;40:536-544.ArticlePubMed
- 7. Maeda T, Kiguchi N, Kobayashi Y, Ozaki M, Kishioka S. Pioglitazone attenuates tactile allodynia and thermal hyperalgesia in mice subjected to peripheral nerve injury. J Pharmacol Sci 2008;108:341-347.ArticlePubMed
- 8. Wiggin TD, Kretzler M, Pennathur S, Sullivan KA, Brosius FC, Feldman EL. Rosiglitazone treatment reduces diabetic neuropathy in streptozotocin-treated DBA/2J mice. Endocrinology 2008;149:4928-4937.ArticlePubMedPMCPDF
- 9. Biswas SC, Buteau J, Greene LA. Glucagon-like peptide-1 (GLP-1) diminishes neuronal degeneration and death caused by NGF deprivation by suppressing Bim induction. Neurochem Res 2008;33:1845-1851.ArticlePubMedPDF
- 10. American Diabetes Association. 9. Pharmacologic approaches to glycemic treatment: standards of medical care in diabetes-2019. Diabetes Care 2019;42:S90-S102.ArticlePubMedPDF
- 11. Tomkin GH, Hadden DR, Weaver JA, Montgomery DA. Vitamin-B12 status of patients on long-term metformin therapy. Br Med J 1971;2:685-687.ArticlePubMedPMC
- 12. de Jager J, Kooy A, Lehert P, Wulffele MG, van der Kolk J, Bets D, Verburg J, Donker AJ, Stehouwer CD. Long term treatment with metformin in patients with type 2 diabetes and risk of vitamin B-12 deficiency: randomised placebo controlled trial. BMJ 2010;340:c2181.ArticlePubMedPMC
- 13. Pop-Busui R, Boulton AJ, Feldman EL, Bril V, Freeman R, Malik RA, Sosenko JM, Ziegler D. Diabetic neuropathy: a position statement by the American Diabetes Association. Diabetes Care 2017;40:136-154.ArticlePubMedPDF
- 14. Ahmed MA, Muntingh G, Rheeder P. Vitamin B12 deficiency in metformin-treated type-2 diabetes patients, prevalence and association with peripheral neuropathy. BMC Pharmacol Toxicol 2016;17:44.ArticlePubMedPMCPDF
- 15. Elhadd T, Ponirakis G, Dabbous Z, Siddique M, Chinnaiyan S, Malik RA. Metformin use is not associated with B(12) deficiency or neuropathy in patients with type 2 diabetes mellitus in Qatar. Front Endocrinol (Lausanne) 2018;9:248.ArticlePubMedPMC
- 16. Zhou W, Kavelaars A, Heijnen CJ. Metformin prevents cisplatin-induced cognitive impairment and brain damage in mice. PLoS One 2016;11:e0151890.ArticlePubMedPMC
- 17. Taylor A, Westveld AH, Szkudlinska M, Guruguri P, Annabi E, Patwardhan A, Price TJ, Yassine HN. The use of metformin is associated with decreased lumbar radiculopathy pain. J Pain Res 2013;6:755-763.PubMedPMC
- 18. Ziegler D, Papanas N, Vinik AI, Shaw JE. Epidemiology of polyneuropathy in diabetes and prediabetes. Handb Clin Neurol 2014;126:3-22.ArticlePubMed
- 19. Giugliano D, Ceriello A, Paolisso G. Oxidative stress and diabetic vascular complications. Diabetes Care 1996;19:257-267.ArticlePubMedPDF
- 20. Apfel SC. Neurotrophic factors and diabetic peripheral neuropathy. Eur Neurol 1999;41:27-34.ArticlePubMedPDF
- 21. Bonhof GJ, Herder C, Strom A, Papanas N, Roden M, Ziegler D. Emerging biomarkers, tools, and treatments for diabetic polyneuropathy. Endocr Rev 2019;40:153-192.ArticlePubMedPDF
- 22. Aroda VR, Edelstein SL, Goldberg RB, Knowler WC, Marcovina SM, Orchard TJ, Bray GA, Schade DS, Temprosa MG, White NH, Crandall JP. Diabetes Prevention Program Research Group. Long-term metformin use and vitamin B12 deficiency in the diabetes prevention program outcomes study. J Clin Endocrinol Metab 2016;101:1754-1761.ArticlePubMedPMCPDF
- 23. Gupta K, Jain A, Rohatgi A. An observational study of vitamin b12 levels and peripheral neuropathy profile in patients of diabetes mellitus on metformin therapy. Diabetes Metab Syndr 2018;12:51-58.ArticlePubMed
- 24. Ma J, Yu H, Liu J, Chen Y, Wang Q, Xiang L. Metformin attenuates hyperalgesia and allodynia in rats with painful diabetic neuropathy induced by streptozotocin. Eur J Pharmacol 2015;764:599-606.ArticlePubMed
- 25. El-Mir MY, Detaille D, R-Villanueva G, Delgado-Esteban M, Guigas B, Attia S, Fontaine E, Almeida A, Leverve X. Neuroprotective role of antidiabetic drug metformin against apoptotic cell death in primary cortical neurons. J Mol Neurosci 2008;34:77-87.ArticlePubMedPDF
- 26. Melemedjian OK, Asiedu MN, Tillu DV, Sanoja R, Yan J, Lark A, Khoutorsky A, Johnson J, Peebles KA, Lepow T, Sonenberg N, Dussor G, Price TJ. Targeting adenosine monophosphate-activated protein kinase (AMPK) in preclinical models reveals a potential mechanism for the treatment of neuropathic pain. Mol Pain 2011;7:70.ArticlePubMedPMCPDF
- 27. Ullah I, Ullah N, Naseer MI, Lee HY, Kim MO. Neuroprotection with metformin and thymoquinone against ethanol-induced apoptotic neurodegeneration in prenatal rat cortical neurons. BMC Neurosci 2012;13:11.ArticlePubMedPMCPDF
- 28. Patil SP, Jain PD, Ghumatkar PJ, Tambe R, Sathaye S. Neuroprotective effect of metformin in MPTP-induced Parkinson's disease in mice. Neuroscience 2014;277:747-754.ArticlePubMed
- 29. Roy Chowdhury SK, Smith DR, Saleh A, Schapansky J, Marquez A, Gomes S, Akude E, Morrow D, Calcutt NA, Fernyhough P. Impaired adenosine monophosphate-activated protein kinase signalling in dorsal root ganglia neurons is linked to mitochondrial dysfunction and peripheral neuropathy in diabetes. Brain 2012;135:1751-1766.ArticlePubMedPMCPDF
- 30. Beiswenger KK, Calcutt NA, Mizisin AP. Dissociation of thermal hypoalgesia and epidermal denervation in streptozotocin-diabetic mice. Neurosci Lett 2008;442:267-272.ArticlePubMedPMC
- 31. Goncalves NP, Vaegter CB, Andersen H, Ostergaard L, Calcutt NA, Jensen TS. Schwann cell interactions with axons and microvessels in diabetic neuropathy. Nat Rev Neurol 2017;13:135-147.ArticlePubMedPMCPDF
- 32. Lee KA, Lee NY, Park TS, Jin HY. Comparison of peripheral nerve protection between insulin-based glucose control and alpha lipoic acid (ALA) in the streptozotocin (STZ)-induced diabetic rat. Endocrine 2018;61:58-67.ArticlePubMedPDF
REFERENCES
(A) Body weight, (B) blood glucose levels, and (C) glycosylated hemoglobin levels in the experimental groups. Body weight was increased gradually in all experimental groups, but diabetes mellitus (DM)+alpha lipoic acid (ALA) group showed less increased trend compared with other groups although significant differences were not present. Glucose levels were significant higher in DM groups than normal group; however, DM+metformin group showed lower glucose level significantly compared with other DM group. Data are presented as mean±standard deviation (n=7 to 10 per group). aP<0.05 vs. normal controls, bP<0.05 vs. DM (n=7 to 10 per group).

Sensory test using (A) Von Frey filament, (B) hot plate, (C) tail flick, and (D) Randall-Selitto responses in the experimental groups. Mechanical allodynia, threshold to hot sense, and pressure response were more sensitive in diabetes mellitus (DM) group during experimental period and these responses were partly blunted by metformin or alpha lipoic acid (ALA) treatment although there were no significant differences between DM+metformin and DM+ALA groups. Data are presented as mean±standard deviation (n=7 to 10 per group). aP<0.05 vs. normal controls, bP<0.05 vs. DM (n=7 to 10 per group).
Intraepidermal nerve fiber density (IENFD) according to the time passage (A) and metformin (MET) or alpha lipoic acid (ALA) treatment (B) in experimental groups and immunohistochemistry images (C) of the cutaneous small nerve fibers in experimental groups (a: normal; b: diabetes mellitus [DM]; c: DM+MET; d: DM+ALA). Arrows indicate immunostained small nerve fiber. Both DM+MET and DM+ALA groups showed less reduced IENFD irrespective of experimental period compared with DM group and significant differences were not present between DM+MET and DM+ALA groups. Data are presented as mean±standard deviation (n=7 to 10 per group). aP0.05 vs. normal controls, bP<0.05 vs. DM (n=7 to 10 per group).
The comparison of sciatic nerves in the respect of (A) axon diameter, (B) myelin sheath thickness, and (C) myelinated fiber diameter of experimental groups. There were no significant differences in the three morphometric parameters between diabetes mellitus (DM)+metformin and DM+alpha lipoic acid (ALA) groups. Data are presented as mean±standard deviation (n=7 to 10 per group). aP0.05 vs. normal controls, bP<0.05 vs. DM (n=7 to 10 per group).
Stained morphological findings of sciatic nerves (×1,000) using toluidine blue in the experimental groups. (A) Normal, (B) diabetes mellitus (DM), (C) DM+metformin (MET), (D) DM+alpha lipoic acid (ALA).

Blood levels of (A) vitamin B12, (B) glutathione, and (C) tumor necrosis factor α (TNF-α) in the experimental groups at 24 weeks. Vitamin B12 and glutathione levels were not different among experimental groups; however, TNF-α was most high in diabetes mellitus (DM) group compared with other experimental groups and DM+metformin or DM+alpha lipoic acid (ALA) groups showed reduced trend significantly compared with DM group. Data are presented as mean±standard deviation (n=7 to 10 per group). aP0.05 vs. normal controls, bP<0.05 vs. DM (n=7 to 10 per group).
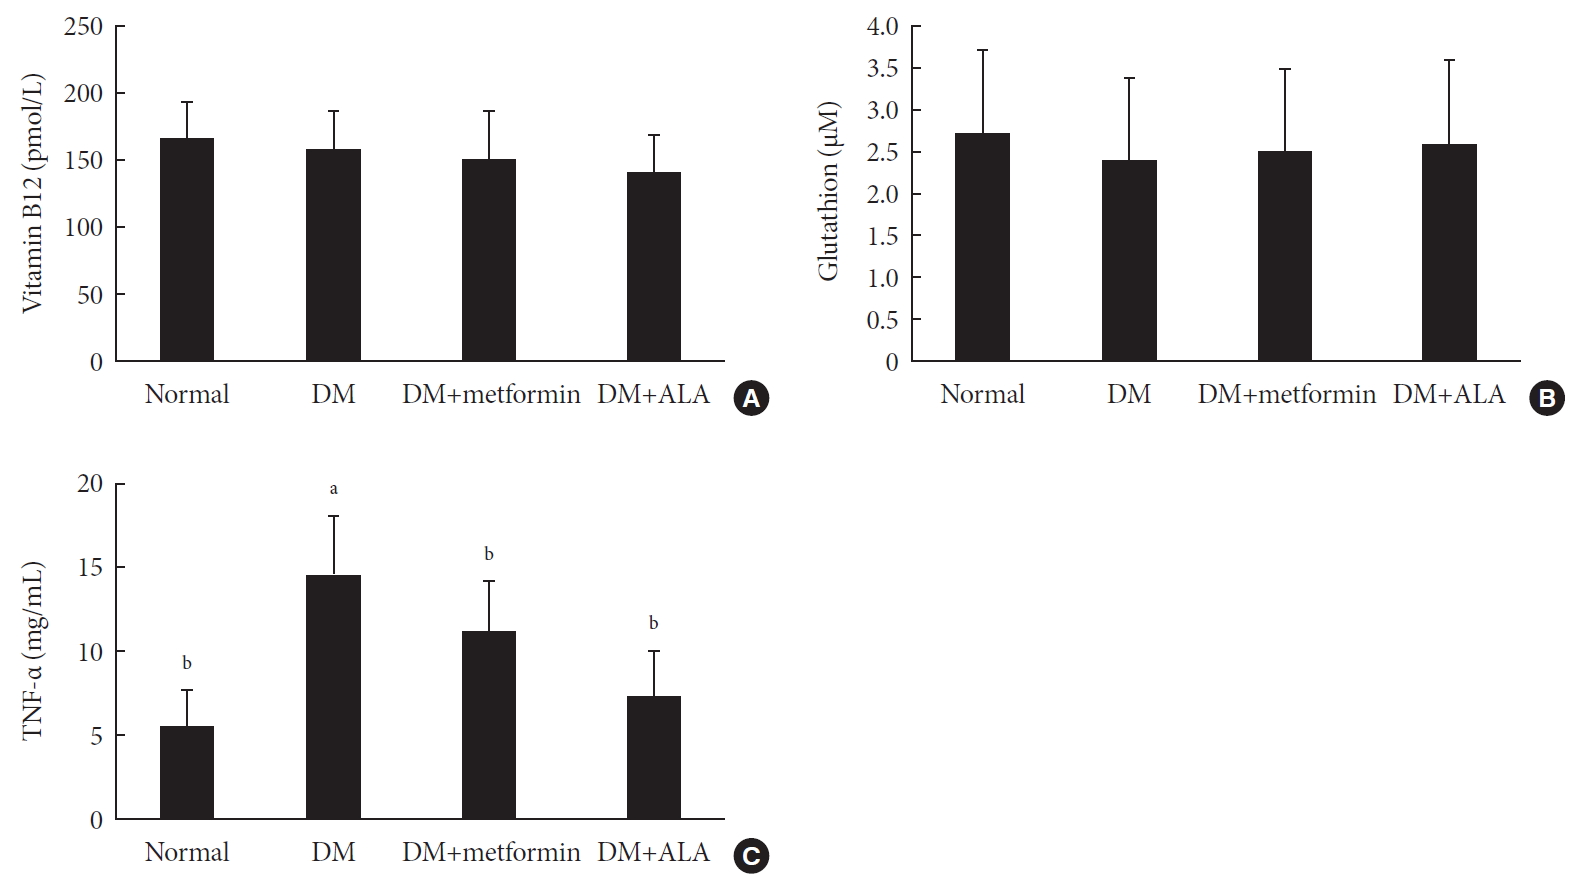
Figure & Data
References
Citations
- Metformin improves diabetic neuropathy by reducing inflammation through up-regulating the expression of miR-146a and suppressing oxidative stress
Fengmin Liu, Fangqin You, Lihang Yang, Siyun Wang, Diya Xie
Journal of Diabetes and its Complications.2024; : 108737. CrossRef - Effect of Metformin on the Functional and Electrophysiological Recovery of Crush Injury-Induced Facial Nerve Paralysis in Diabetic Rats
Kyung Hoon Sun, Cheol Hee Choi, Gwang-Won Cho, Chul Ho Jang
Journal of Personalized Medicine.2023; 13(9): 1317. CrossRef - Is metformin neuroprotective against diabetes mellitus-induced neurodegeneration? An updated graphical review of molecular basis
Fatemeh Karami, Hamidreza Jamaati, Natalie Coleman-Fuller, Maryam Shokrian Zeini, A. Wallace Hayes, Mina Gholami, Mahsa Salehirad, Mohammad Darabi, Majid Motaghinejad
Pharmacological Reports.2023; 75(3): 511. CrossRef - Early Diagnosis through Estimation of Inflammatory Biomarkers and the Neuroprotective Role of Metformin in Diabetic Peripheral Neuropathy
Laxmi Sri, Prabhakar Orsu
International Journal of Pharmaceutical Sciences and Nanotechnology(IJPSN).2023; 16(2): 6427. CrossRef - Bidirectional association between diabetic peripheral neuropathy and vitamin B12 deficiency: Two longitudinal 9-year follow-up studies using a national sample cohort
Heung Yong Jin, Kyung Ae Lee, Yu Ji Kim, In Sun Gwak, Tae Sun Park, Sang Woo Yeom, Jong Seung Kim
Primary Care Diabetes.2023; 17(5): 436. CrossRef - An overview of painful diabetic peripheral neuropathy: Diagnosis and treatment advancements
Jonathan M. Hagedorn, Alyson M. Engle, Tony K. George, Jay Karri, Newaj Abdullah, Erik Ovrom, Jhon E. Bocanegra-Becerra, Ryan S. D'Souza
Diabetes Research and Clinical Practice.2022; 188: 109928. CrossRef - The role of MicroRNA networks in tissue-specific direct and indirect effects of metformin and its application
Qinzhi Yang, Gang Wang, Dan Fang, Xiaojun Gao, Yu Liang, Liqun Wang, Jianbo Wu, Min Zeng, Mao Luo
Biomedicine & Pharmacotherapy.2022; 151: 113130. CrossRef - Is metformin a possible treatment for diabetic neuropathy?
Juechun Wei, Yanling Wei, Meiyan Huang, Peng Wang, Shushan Jia
Journal of Diabetes.2022; 14(10): 658. CrossRef - Metformin as a potential therapeutic for neurological disease: mobilizing AMPK to repair the nervous system
Sarah Demaré, Asha Kothari, Nigel A. Calcutt, Paul Fernyhough
Expert Review of Neurotherapeutics.2021; 21(1): 45. CrossRef - Metformin Preserves Peripheral Nerve Damage with Comparable Effects to Alpha Lipoic Acid in Streptozotocin/High-Fat Diet Induced Diabetic Rats (Diabetes Metab J 2020;44:842-53)
Bo Kyung Koo
Diabetes & Metabolism Journal.2021; 45(1): 125. CrossRef - Metformin Preserves Peripheral Nerve Damage with Comparable Effects to Alpha Lipoic Acid in Streptozotocin/High-Fat Diet Induced Diabetic Rats (Diabetes Metab J 2020;44:842-53)
Sun Hee Kim, Tae Sun Park, Heung Yong Jin
Diabetes & Metabolism Journal.2021; 45(1): 127. CrossRef - Impacts of statin and metformin on neuropathy in patients with type 2 diabetes mellitus: Korean Health Insurance data
Hong Ki Min, Se Hee Kim, Jong Han Choi, Kyomin Choi, Hae-Rim Kim, Sang-Heon Lee
World Journal of Clinical Cases.2021; 9(33): 10198. CrossRef
 PubReader
 ePub Link
 Cite
Cite