
- Current
- Browse
- Collections
-
For contributors
- For Authors
- Instructions to authors
- Article processing charge
- e-submission
- For Reviewers
- Instructions for reviewers
- How to become a reviewer
- Best reviewers
- For Readers
- Readership
- Subscription
- Permission guidelines
- About
- Editorial policy
Articles
- Page Path
- HOME > Diabetes Metab J > Volume 45(1); 2021 > Article
-
Original ArticleBasic Research Vimentin Deficiency Prevents High-Fat Diet-Induced Obesity and Insulin Resistance in Mice
-
SeoYeon Kim1
 , Inyeong Kim1, Wonkyoung Cho1, Goo Taeg Oh2, Young Mi Park1
 -
Diabetes & Metabolism Journal 2021;45(1):97-108.
DOI: https://doi.org/10.4093/dmj.2019.0198
Published online: June 15, 2020
1Department of Molecular Medicine, College of Medicine, Ewha Womans University, Seoul, Korea
2Immune and Vascular Cell Network Research Center, National Creative Initiatives, Department of Life Sciences, Ewha Womans University, Seoul, Korea
-
Corresponding author: Young Mi Park Department of Molecular Medicine, Ewha Womans University School of Medicine, 1071 Anyangcheon-ro, Yangcheon-gu, Seoul 07985, Korea. parkym@ewha.ac.kr
Copyright © 2021 Korean Diabetes Association
This is an Open Access article distributed under the terms of the Creative Commons Attribution Non-Commercial License (http://creativecommons.org/licenses/by-nc/4.0/) which permits unrestricted non-commercial use, distribution, and reproduction in any medium, provided the original work is properly cited.
ABSTRACT
-
Background
- Obesity and type 2 diabetes mellitus are world-wide health problems, and lack of understanding of their linking mechanism is one reason for limited treatment options. We determined if genetic deletion of vimentin, a type 3 intermediate filament, affects obesity and type 2 diabetes mellitus.
-
Methods
- We fed vimentin-null (Vim−/−) mice and wild-type mice a high-fat diet (HFD) for 10 weeks and measured weight change, adiposity, blood lipids, and glucose. We performed intraperitoneal glucose tolerance tests and measured CD36, a major fatty acid translocase, and glucose transporter type 4 (GLUT4) in adipocytes from both groups of mice.
-
Results
- Vim−/− mice fed an HFD showed less weight gain, less adiposity, improved glucose tolerance, and lower serum level of fasting glucose. However, serum triglyceride and non-esterified fatty acid levels were higher in Vim−/− mice than in wild-type mice. Vimentin-null adipocytes showed 41.1% less CD36 on plasma membranes, 27% less uptake of fatty acids, and 50.3% less GLUT4, suggesting defects in intracellular trafficking of these molecules.
-
Conclusion
- We concluded that vimentin deficiency prevents obesity and insulin resistance in mice fed an HFD and suggest vimentin as a central mediator linking obesity and type 2 diabetes mellitus.
- Recently, the Global Burden of Disease study estimated that 2 billion people—30% of the world population—are overweight or obese [1]. Obesity is associated with an increased risk of type 2 diabetes mellitus [2]. Although much research has focused on finding the mechanisms of obesity-induced insulin resistance, treatment for type 2 diabetes mellitus is still limited by insufficient knowledge of the link between the two disorders. New research revealing how obesity and insulin resistance are related should aid in development of innovative strategies for treatment of obesity-induced insulin resistance.
- Vimentin is a type 3 intermediate filament expressed in cells of mesenchymal origin, including adipocytes. Vimentin plays a key role in positioning of organelles within the cytoplasm and regulates numerous cellular processes including cell migration, autophagy, and plasticity of mesenchymal cells [345]. Recently, several studies have revealed the functions of vimentin in adipocytes. Heid et al. [6] reported that vimentin comprises lipid droplets, generating a vimentin-perilipin cortex in adipocytes. Vimentin also participates in lipolysis through direct interaction with hormone-sensitive lipase (HSL) [7]. Vimentin binds to insulin-responsive aminopeptidas , a major cargo protein of glucose transporter type 4 (GLUT4) vesicles in 3T3-L1 adipocytes [8]. These in vitro studies support the hypothesis that vimentin is involved in obesity and type 2 diabetes mellitus. A recent study reported that vimentin-null mice on a chow diet have lower body weight and less body fat compared with wild-type mice, suggesting a role of vimentin in normal accumulation of body fat [9]. However, there have been no animal studies verifying the role of vimentin in high-fat diet (HFD)-induced obesity and type 2 diabetes mellitus. In the current study, we evaluated if genetic deletion of vimentin in mice affects HFD-induced obesity and insulin resistance. We found that Vim−/− mice fed an HFD showed less adiposity and less weight gain compared with wild-type mice, resulting in improved glucose tolerance. Our data suggest that further investigation of the functions of vimentin may lead to new therapeutic strategies for treatment of obesity and type 2 diabetes mellitus.
INTRODUCTION
- Reagents
- The subcellular protein fractionation kit, preadipocyte isolation kit, and fatty acid uptake assay kit were obtained from Abcam (Cambridge, UK). CD36 antibody conjugated with allophycocyanin (APC) and appropriate control antibodies were purchased from BioLegend (San Diego, CA, USA). Antibodies for CD36, caveolin-1, GLUT4, and β-actin were obtained from Abcam. Sodium dodecyl sulfate (SDS) and CuSO4 were obtained from Duchefa Biochemie (Haarlem, the Netherlands). Rabbit immunoglobulin G (IgG) and IgM were purchased from Bethyl Laboratories (Montgomery, TX, USA).
- Mice and animal protocols
- Pathogen-free male C57BL/6 mice, 6 to 8 weeks old, were purchased from OrientBio (Seongnam, Korea). Vimentin-null (Vim−/−) mice on a 129 background were provided by Dr. John E. Eriksson (Åbo Akademi University, Turku, Finland) and backcrossed seven times to C57Bl/6. All experiments used age-matched (7 to 10 weeks old) mice that were fed a chow diet for 5 weeks and then fed an HFD for 10 weeks. The Institutional Animal Care and Use Committee (IACUC) of Ewha Womans University School of Medicine approved the experimental protocol (IACUC approval No. ESM-12-0198). Mouse serum was obtained by centrifugation of blood at 1,000 ×g for 7 minutes. Mouse serum was analyzed using a high density lipoprotein (HDL) and low density lipoprotein/very low density lipoprotein (LDL/VLDL) cholesterol assay kit (Cayman Chemical, Ann Arbor, MI, USA), triglyceride (TG), non-esterified fatty acid (NEFA) assay kit (Wako Chemicals, Richmond, VA, USA), and a free glycerol assay kit (Dogenbio, Seoul, Korea) following the manufacturers' instructions. An insulin enzyme-linked immune sorbent assay (ELISA) kit (Millipore, Temecula, CA, USA) was used to measure insulin concentration in mouse serum.
- Immunohistochemistry
- The entire epididymal fat pad, subcutaneous fat, and liver were excised from all experimental animals. Tissues were fixed in 10% formalin and paraffin-embedded. We performed hematoxylin and eosin (H&E) staining with 5 µm sections from each formalin-fixed, paraffin-embedded tissue. Antigen retrieval specific to each antibody was performed. Blocking was performed with rabbit or goat serum, and slides were incubated with the primary antibody for 1 hour at room temperature (anti-F4/80 Clone C1:A3-1 [Abcam] 1:50 dilution). Sections were incubated with secondary antibodies using the Vectastain ABC kit (Vector Laboratories Ltd., Peterborough, UK), and 3,3′-diaminobenzidine chromogenic detection was performed.
- Cell culture
- Adipocytes differentiated from stromal-vascular fraction cells were used in the current study. We collected mouse preadipocytes from epididymal fat following the preadipocyte isolation kit instructions. Confluent preadipocytes were treated for 2 days with insulin (10 µM), isobutyl-methylxanthine (IBMX) (0.5 mM), and dexamethasone (0.25 µM) in Dulbecco's Modified Eagle Medium (DMEM) containing 10% fetal bovine serum (FBS) and 1% penicillin/streptomycin (p/s) followed by treatment for another 2 days with insulin (10 µM) in DMEM containing 10% FBS and 1% p/s. Cells were replenished with DMEM containing 10% FBS and 1% p/s every other day.
- Flow cytometry
- Cells were incubated in 6-well plates with appropriate media containing 10% FBS. After rinsing twice with phosphate-buffered saline (PBS) cells were harvested gently with a scraper or trypsin solution (Welgen, Worcester, MA, USA) and moved to round-bottom glass tubes. After centrifugation at 1,000 ×g in glass tubes, cells were incubated with 5% bovine serum albumin (BSA) for 30 minutes at 4℃ and then with APC-conjugated anti-CD36 antibody or isotype control (BioLegend) diluted in PBS containing 3% BSA for 1 hour at 4℃. After three washes with PBS, cells were analyzed with flow cytometry.
- Fatty acid uptake assay
- Cells were incubated in 6-well plates with media containing 10% FBS and then incubated with TF2-C12 fatty acid 40 µg/mL for 30 minutes. Cells were harvested gently with trypsin solution and moved to round-bottom glass tubes. Cells were fixed with 4% paraformaldehyde. After rinsing twice with PBS, fluorescence intensity of the cells was measured using flow cytometry.
- Western blotting
- Cells were lysed with buffer containing 1% Triton X-100, 20 mM Tris-hydrochloric acid (pH 7.5), 150 mM sodium chloride, 1 mM EDTA, 1 mM EGTA, protease inhibitor cocktail (Roche, Mannheim, Germany), and phosphatase inhibitors (2 mM sodium vanadate, 1% sodium pyrophosphate, 10 mM sodium fluoride, and 10 mM phenylmethylsulfonyl fluoride [PMSF]). The lysates were separated by SDS–polyacrylamide gel electrophoresis, transferred to polyvinylidene fluoride membranes (Millipore), and analyzed by immunoblotting. Membranes were probed with anti-CD36, anti-Caveolin-1, and anti-β-actin antibodies. Antibodies for β-actin were used for normalization. Band intensities were quantified using the Image J program (National Institutes of Health, Bethesda, MD, USA).
- Intraperitoneal glucose tolerance test
- After 16 hours of fasting, the mice were intraperitoneally injected with 20% glucose solution (D-glucose G75; Sigma-Aldrich, St. Louis, MO, USA) at 2 g/kg. Blood glucose was measured using a glucometer. Mouse blood was collected from the tail vein just before glucose injection and at 15, 30, 60, and 120 minutes after injection. Each experiment was repeated twice with a week interval using the same mice.
- RNA isolation and real-time polymerase chain reaction
- Total RNA was extracted from macrophages using Trizol reagent (Invitrogen, Carlsbad, CA, USA) according to the manufacturer's instruction. We used the iScript cDNA synthesis kit (Bio-rad, Hercules, CA, USA) to synthesize cDNA. Quantitative real-time reverse transcriptase polymerase chain reaction (qRT-PCR) was performed with Power SYBR Green PCR Master Mix (Applied Biosystems, Foster City, CA, USA) and an ABI real-time PCR thermocycler. RNAs were analyzed by qRT-PCR with the following primers: 5′-GAT CGG AAC TGT GGG CTC AT-3′ and 5′-GGT TCC TTC TTC AAG GAC AAC TTC-3′ for CD36, 5′-TCC ATG ACA ACT TTG GCA TTG-3′ and 5′-TCA CGC CAC AGC TTT CCA-3′ for glyceraldehyde-3-phosphate dehydrogenase (GAPDH), and 5′-AGAGTCTAAAGCGCCT-3′ and 5′-CCGAGACCAACGTGAA-3′ for GLUT4. GAPDH was used as an internal control.
- Statistical analysis
- Data are expressed as mean±standard error of the mean (SEM). Student's t-test was used for comparisons of two sample means. A P value less than 0.05 was considered statistically significant. All experiments were repeated at least three times. Analyses were performed using GraphPad Prism Software version 5.00 for Windows (GraphPad Software, San Diego, CA, USA).
METHODS
- Vimentin deficiency prevented HFD-induced obesity
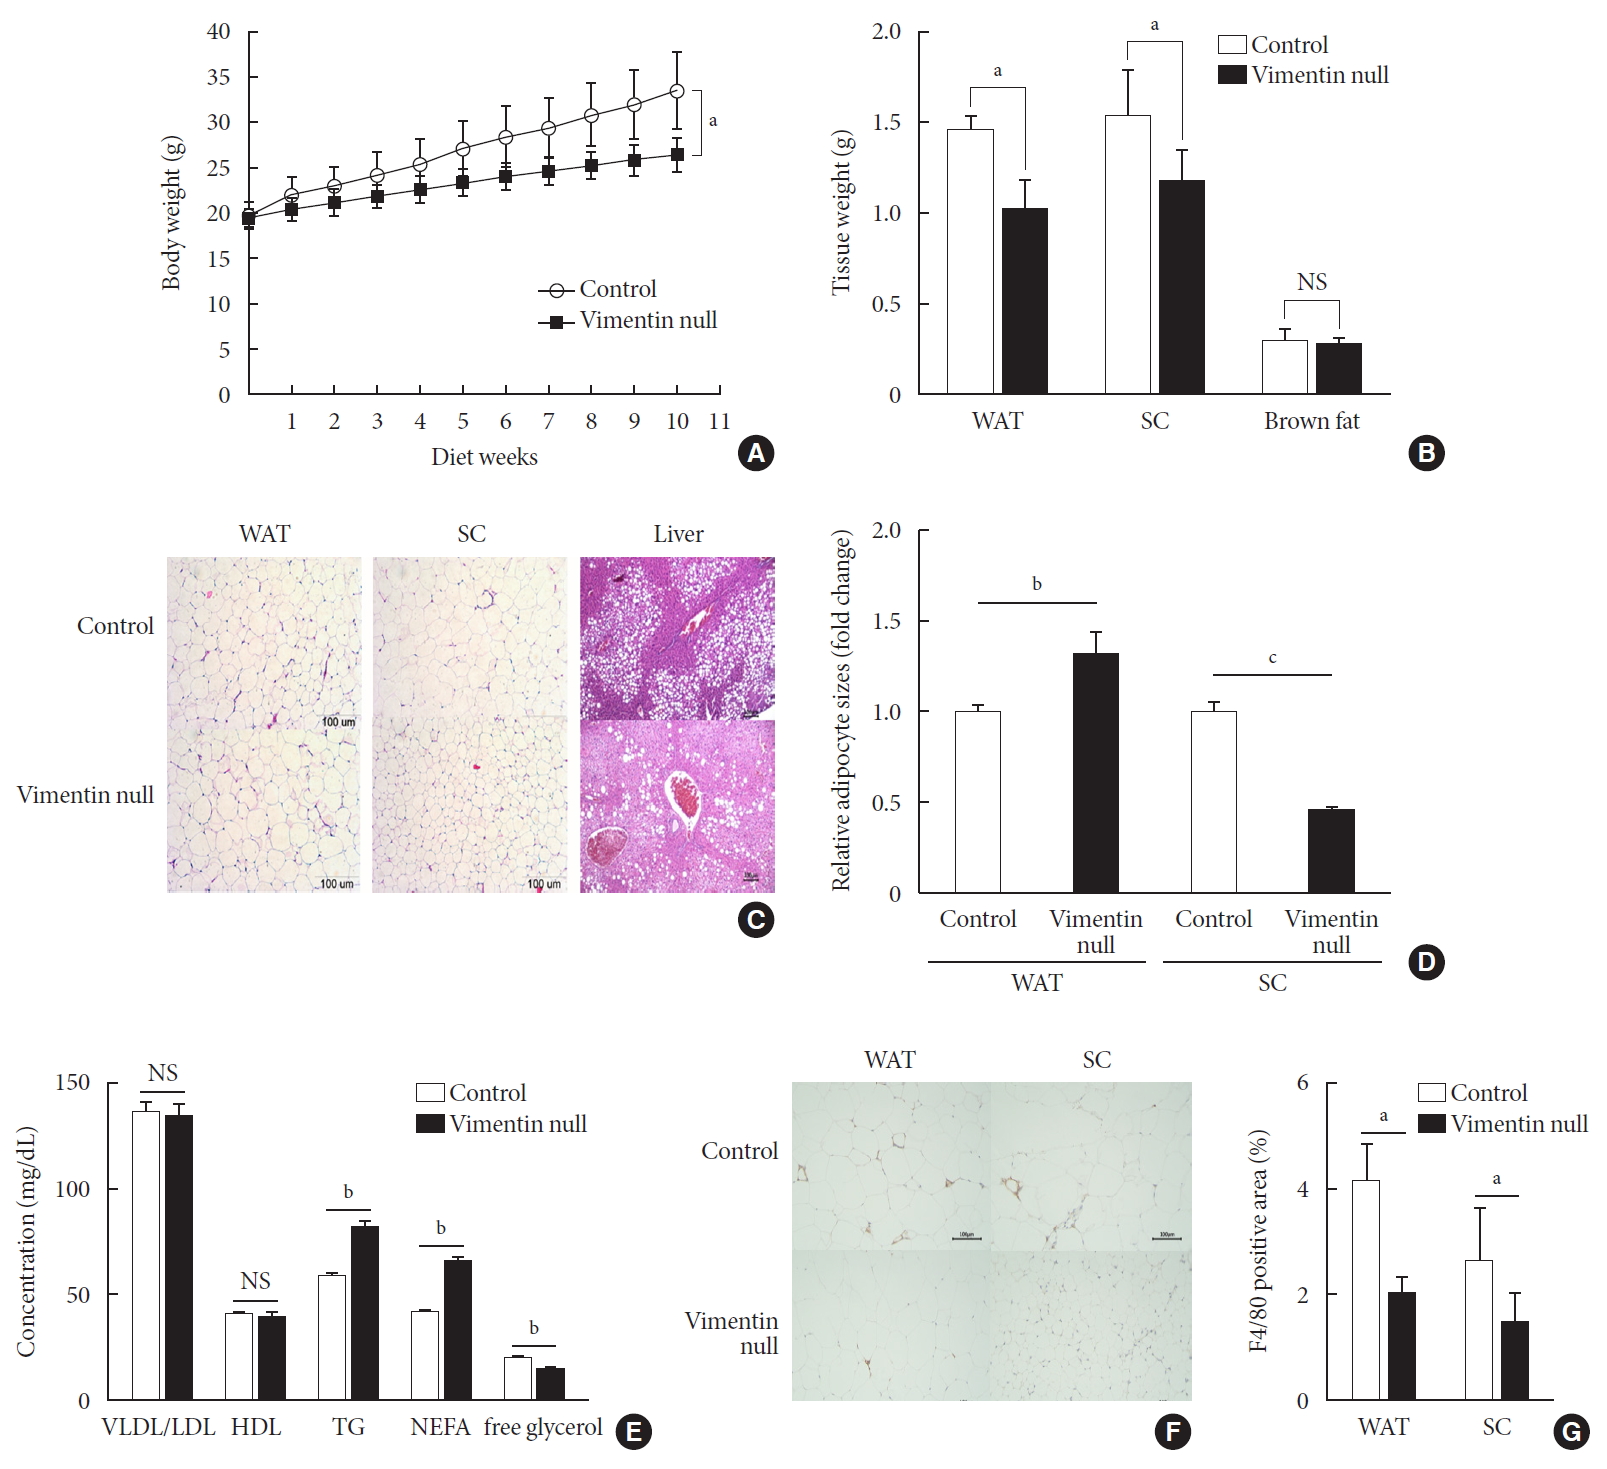
- To investigate the role of vimentin in HFD-induced obesity, we fed 5-week-old Vim−/− mice and wild-type (control) mice an HFD for 10 weeks and observed weight changes. The average weight of Vim−/− mice was 26.6±1.7 g after 10 weeks of HFD, which was 26% less than the average weight of the control group (33.7±3.8 g) (Fig. 1A). After sacrificing the mice, we separated epididymal fat, subcutaneous fat, and brown fat to measure their weights. The weight of the epididymal fat of Vim−/− mice was 30.8% less than that of the control group (1.02±0.35 g vs. 1.48±0.15 g), and the weight of the subcutaneous fat of Vim−/− mice was 23.7% less than that of the control group (1.19±0.35 g vs. 1.55±0.49 g) (Fig. 1B).
- We stained adipose tissues with H&E and measured the sizes of adipocytes. Epididymal adipocytes of Vim−/− mice were 1.28 times bigger than those of the control mice. In contrast, subcutaneous adipocytes of Vim−/− mice were 0.46 times smaller than those of the control mice (Fig. 1C and D).
- We sectioned the livers of wild-type and Vim−/− mice fed an HFD for 10 weeks (Fig. 1C). Histological assessment of the liver sections revealed that Vim−/− mice presented much lower levels of hepatic steatosis compared with wild-type mice (Fig. 1C).
- Concentrations of TG and NEFA in serum were higher in Vim−/− mice than in wild-type mice
- We analyzed blood of Vim−/− mice and control mice after 10 weeks of the HFD and found that plasma concentrations of VLDL/LDL and HDL were not significantly different between the two groups (Fig. 1E) (VLDL/LDL: 135.05±13.56 mg/dL vs. 137.14±10.81 mg/dL; HDL: 39.87±5.27 mg/dL vs. 40.42±2.21 mg/dL). However, serum TG of Vim−/− mice was 82.02±9.83 mg/dL, which was 40% higher than the control group (58.54±4.64 mg/dL) (Fig. 1E). Similarly, serum NEFA concentration was 42.1% higher in Vim−/− mice than in controls (65.58±5.43 mg/dL vs. 45.25±3.62 mg/dL). However, serum glycerol was lower in Vim−/− mice than in controls (14.43±3.01 mM vs. 19.37±3.56 mM).
- Vimentin deficiency reduced adipose tissue inflammation
- We stained the epididymal fat of control and Vim−/− mice fed a HFD for 10 weeks with F4/80 antibody, a macrophage marker (Fig. 1F). We found that total macrophage number was lower in the adipose tissues of Vim−/− mice than in those of wild-type mice (Fig. 1G).
- Vimentin deficiency improved glucose tolerance and lowered fasting glucose in HFD-induced obesity
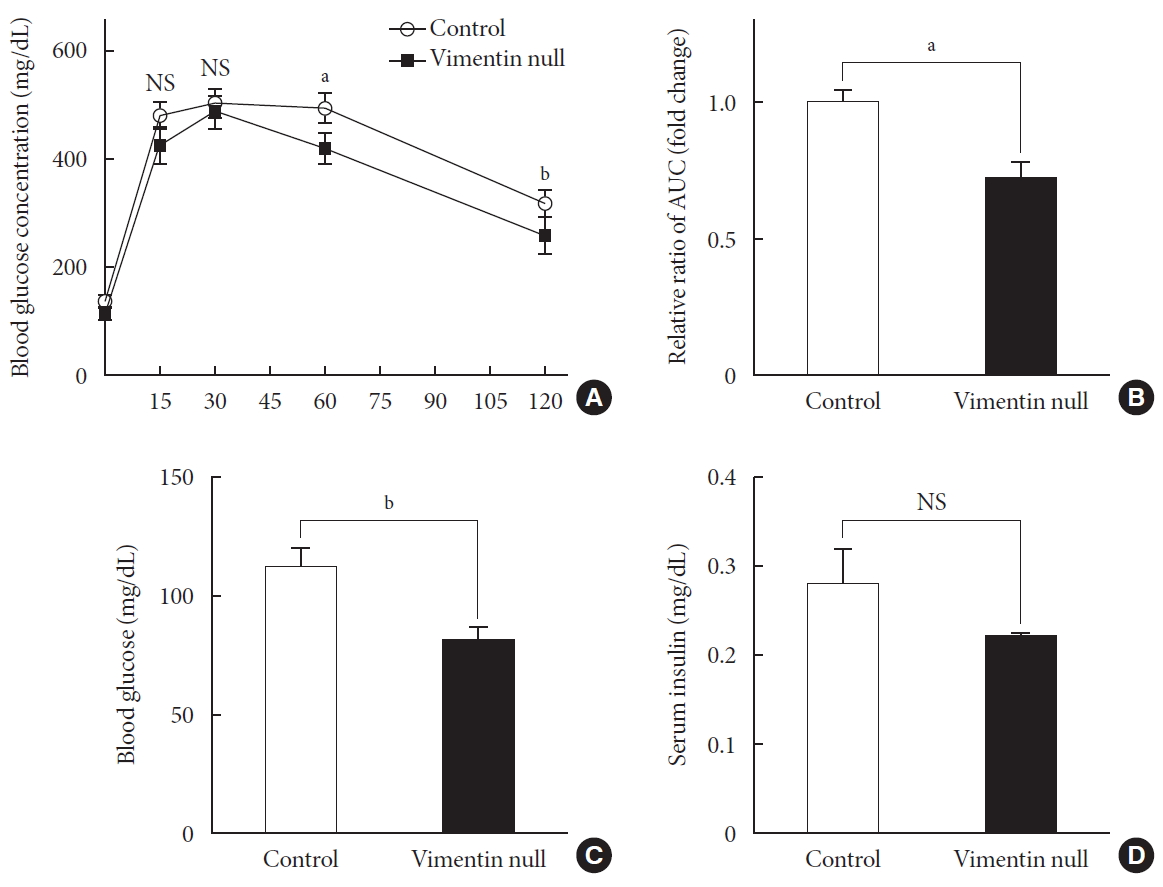
- HFD-induced obesity in mice is known to be associated with glucose intolerance [10]. To identify the effect of vimentin in glucose tolerance, we performed an intraperitoneal glucose tolerance test. In both Vim−/− and wild-type mice, plasma glucose level reached the maximum at 30 minutes after glucose challenge; thereafter, first-order kinetics activity of glucose elimination occurred until minute 120 in Vim−/− mice. In contrast, there was hardly any glucose elimination between minutes 30 and 60 in wild-type mice. The KG between minutes 30 and 60 was 1.08±0.51/min in wild-type and 2.52±1.56/min in Vim−/− mice (n=8, P=0.0186) (Fig. 2A). Analysis of the plot in Fig. 2A revealed that the glucose area under the curve (AUC) of the Vim−/− mice was 26.3% lower than that of the wild-type mice (AUC: 1,670.25±253.10 [control] vs. 1,229.75±210.20 [Vim−/− ], P=0.002), suggesting that Vim−/− mice had less impaired glucose tolerance than wild-type mice (Fig. 2B). The fasting glucose level of the Vim−/− group was 82.4±11.0 mg/dL, which was 27.6% lower than that of the control group (113.8±12.04 mg/dL) (Fig. 2C). Blood insulin levels were not significantly different between Vim−/− and control mice (Fig. 2D).
- Vimentin deficiency reduced expression of CD36 and GLUT4 in the plasma membrane of adipocytes
- Dysregulation in adipose fatty acid metabolism is a significant contributing factor to development of obesity and metabolic diseases, including type 2 diabetes mellitus [11]. To see if vimentin deficiency affects fatty acid uptake in adipocytes, we isolated preadipocytes from epididymal fats of Vim−/− and wild-type mice and experimentally induced differentiation into adipocytes. We confirmed no expression of vimentin in the adipocytes differentiated from stromal-vascular fraction cells of the Vim−/− mice with Western blot (Supplementary Fig. 1).
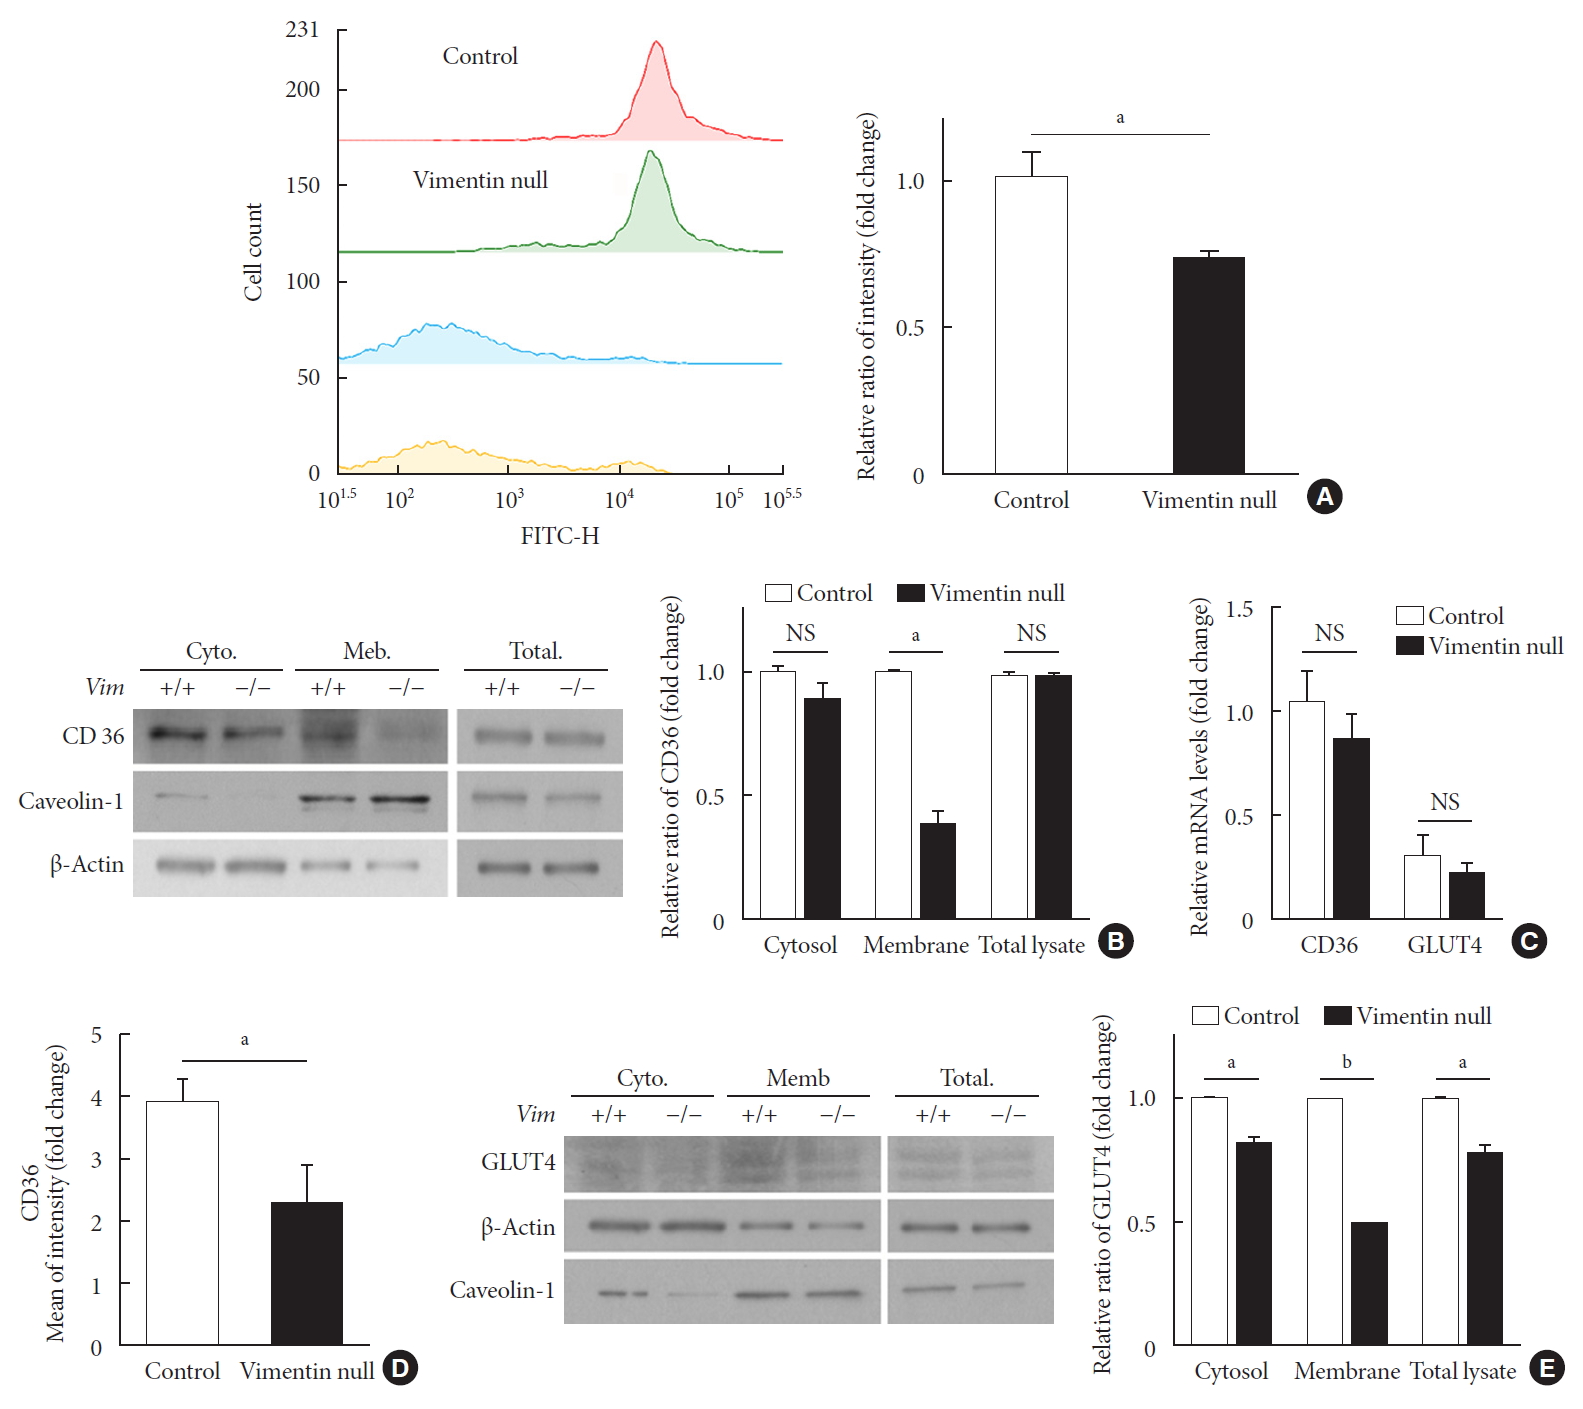
- We evaluated fatty acid uptake of these adipocytes using the fluorescence detector TF2-C12 fatty acid. Our flow cytometry data showed that the mean fluorescence intensity of macrophages representing TF2-C12 fatty acid uptake was 27% less in Vim−/− adipocytes than in control cells (Fig. 3A).
- CD36 is a fatty acid translocase in adipocytes [12]. Our Western blot for CD36 showed that CD36 protein level in cell lysates was not different between Vim−/− and control adipocytes (Fig. 3B). Analysis of gene transcriptional level using quantitative PCR also showed no difference in CD36 mRNA between Vim−/− and control adipocytes (Fig. 3C). However, expression of CD36 in the plasma membrane was significantly different. Western blots using the cytoplasmic and membrane fractions of macrophages revealed that the amount of membrane-localized CD36 in Vim−/− adipocytes was 58% smaller than in control adipocytes (Fig. 3B). In accordance, flow cytometry for plasma membrane CD36 showed 41.1% fewer in Vim−/− adipocytes than control adipocytes (Fig. 3D).
- We also observed expression of GLUT4, the insulin-regulated glucose transporter in adipocytes [13]. Western blots using total cell lysates showed that Vim−/− adipocytes had 22% less expression of GLUT4 than control adipocytes. Q-PCR using cDNA of adipocytes differentiated from the stromal-vascular fraction showed that GLUT4 expression levels of Vim−/− and control adipocytes were not significantly different (Fig. 3C). However, Western blots using the membrane faction revealed 50.3% less GLUT4 in Vim−/− adipocytes compared with control adipocytes. The cytosolic fraction of Vim−/− adipocytes had 17.8% less GLUT4 than the cytosolic fraction of control adipocytes (Fig. 3E).
- Vimentin deficiency decreased lipolysis via decreased HSL activity
- We measured expression levels of molecules important for lipogenesis and lipolysis in the epididymal fats of Vim−/− and wild-type mice fed a HFD for 10 weeks. To determine whether vimentin deficiency influences expression of HSL, we measured the expression by Western blotting. HSL expressed in adipose tissues did not differ between Vim−/− and control groups (Fig. 4A).
- HSL activity is regulated by site-specific phosphorylation on several serine residues [14]. We found smaller amounts of active forms of HSL phosphorylated on Ser563, Ser565, and Ser660 in vimentin-null adipose tissues compared with control adipose tissues (Fig. 4A). Fatty acid synthase and perilipin, which are involved in lipogenesis, were were not different in expression level between Vim−/− and control groups (Fig. 4B).
RESULTS
- Previous studies of vimentin, a type III intermediate filament, have focused on its role in maintenance of cellular structures and epithelial-mesenchymal transition. However, the biological role of vimentin in the context of living organisms has been limited [15]. A recent study revealing that both male and female Vim−/− mice on a normal chow diet had lower body weight and less fat accumulation compared with wild-type mice is inspiring since it suggests that vimentin plays a role in normal fat accumulation and metabolism [9]. In addition, there are studies showing that vimentin is a constituent of lipid droplets in human adipocytes [6], and that vimentin is linked to lipid metabolism, including stability of TG, and to insulin-sensitive translocation of GLUT4 in adipocytes [8]. These studies suggest that vimentin plays an important role in metabolic abnormalities; however, there have been no animal studies on the role of vimentin in the course of diet-induced obesity and type 2 diabetes mellitus. Our studies seek novel functions of vimentin in metabolic processes by evaluating the effects of vimentin deficiency on HFD-induced obesity and type 2 diabetes mellitus.
- Our current study is the first to report the phenotypic differences between Vim−/− and wild-type mice fed an HFD for 10 weeks. Body weights of the Vim−/− mice were lower than those of the control mice and comprised less epididymal white adipose tissue (Fig. 1). Serum TG and NEFA levels were higher in Vim−/− mice (Fig. 1). These results suggest that vimentin deficiency may influence metabolism of TG and fatty acids. Fredric B. Kraemer's group found that lipid droplets in Vim−/− adrenal cells are smaller than in control cells [16], and their proteomic research revealed that vimentin is an HSL-interacting partner. Adipose cells from Vim−/− mice show lower efficiency of lipolysis despite the same amounts of lipases and droplet-associated proteins. However, maximally stimulated lipolysis in these Vim−/− cells was not altered [7]. These experiments were conducted on mice fed a chow diet and thus with no pathological conditions. In our experiments using mice fed an HFD, epididymal Vim−/− adipocytes were bigger than wild-type cells, and Vim−/− adipocytes in subcutaneous fat tissues were smaller than wild-type cells (Fig. 1C). In obesity, adipocyte size increases to neutralize and store nutritional overload. When the adipocytes are eventually unable to store excess lipids, they increase lipolysis and redirect fatty acids to the liver [16]. Based on this, Vim−/− adipocytes in epididymal fat appear to have improved function to store lipids and decreased adipolysis (Fig. 1C and D) [7]. Adipocyte size may be dependent on the balance between fatty acid uptake and lipolysis, and contrary findings of the sizes of adipocytes between epididymal fat and subcutaneous fat suggest differential functions of different adipose depots. It has been reported that epididymal adipocytes have more mitochondria than subcutaneous adipocytes and are more prone to lipolysis [17].
- The higher TG and NEFA levels in the blood of Vim−/− mice are explained by reduced fatty acid uptake of Vim−/− adipocytes (Fig. 3A). Transcription of CD36, a major fatty acid translocase, was not affected by vimentin deficiency (Fig. 3C). However, the subcellular fractionation technique and flow cytometry revealed a 41% to 58% reduction in the amount of CD36 in the plasma membrane of vimentin-null adipocytes (Fig. 3B and D). Therefore, we posit that vimentin plays a role in trafficking of CD36 and regulates fatty acid uptake of adipocytes. Regarding the various functions of CD36 and its clinical implications in physiologic or pathological conditions including obesity [18], atherosclerosis [1519], malaria infection [20], diabetes [21], and Alzheimer's disease [22], it is important to clarify the regulatory mechanism of CD36 expression. For this, several recent reports found that CD36 transcription is regulated by activated peroxisome proliferator-activated receptors-γ [23]. In the current study, we report that Vim−/− mice fed an HFD showed a phenotype similar to that of CD36−/− mice. It has been reported that CD36−/− mice have elevated serum TG concentration and lower body weights compared with wild-type mice [242526]. According to the Furuhashi et al. [27], serum TG level is significantly elevated in CD36-deficient people. Elevated free fatty acid uptake via CD36 promotes epithelial-mesenchymal transition in hepatocellular carcinoma cells [28]. Overall, expression of CD36 and vimentin seem to be linked; thus, further studies should be performed to determine the mechanism by which vimentin is involved in membrane localization of CD36 and how CD36 expression reciprocally regulates vimentin expression.
- We also evaluated if vimentin affects insulin resistance in HFD-fed obese mice and found that Vim−/− mice had significantly lower fasting glucose level and improved glucose tolerance compared to control mice. In contrast, there was no difference in blood insulin level between the two groups (Fig. 2D). GLUT4, the predominant insulin-responsive glucose transporter isoform, plays a key role in the transport of extracellular glucose into insulin-sensitive cells in vivo [293031]. There have been several studies revealing the role of GLUT4 in diabetes in mice. Overexpression of GLUT4 in fat reversed insulin resistance in muscle-GLUT4−/− mice [32]. GLUT4 overexpression improved insulin sensitivity and fasting triglyceridemia in HFD-fed transgenic mice [33]. In our study, GLUT4 was 22% lower in total cell lysates and 50.3% lower in the membrane fraction of vimentin-null adipocytes (Fig. 3E). Our finding corresponds to a previous report that vimentin mediates insulin-sensitive GLUT4 translocation in 3T3-L1 adipocytes [8]. Therefore, it seems that improved glucose tolerance in Vim−/− mice does not depend on GLUT4 expression of adipocytes. Glucose homeostasis is controlled by various mechanisms; thus, the role of vimentin in different regulatory mechanisms should be studied. Vimentin expression in pancreatic α and β cells is related to pancreatic islet dysfunction and insulin resistance [34]. A recent study revealed that vimentin filament assembly is required for β3 adrenergic receptor (β3AR) function in adipocytes. Depletion of vimentin by small hairpin RNA (shRNA) completely inhibits β3AR-mediated extracellular-signal-regulated kinase (ERK) activation and significantly reduces lipolysis [35]. In addition, deficiency of β-adrenoceptors (β1/β2/β3-adrenoceptors) results in enhanced insulin sensitivity in mice [36]. Vimentin is involved in secretion of neurotransmitters and affects the functions of the autonomic nervous system, which regulates glucose homeostasis [37]. Therefore, further studies using tissue-specific Vim−/− mice would be beneficial to clarify the mechanism.
- Our data show that vimentin-null adipocytes have less membrane-localized CD36 and thus less uptake of fatty acid via CD36. CD36 plays an important role in modulating lipid homeostasis. Fatty acid binding to CD36 increases level of cAMP. One report showed that fatty acid binding to CD36 couples AMP-activated protein kinase (AMPK) activation to fatty acid availability [38]. In addition, CD36 deficiency in 3T3-L1 adipocytes decreased lipolysis [39]. HSL Ser563, Ser659, and Ser660 are major cyclic AMP-dependent protein kinase phosphorylation sites, and HSL Ser565 is phosphorylated by AMPK. Our data showed that HSL phosphorylation on Ser563, Ser659, and Ser660 was reduced in Vim−/− adipose tissues. Therefore, vimentin deficiency seems to affect lipolysis via reduced phosphorylation of HSL, which may be related to deficient CD36-mediated signaling.
- On the other hand, vimentin deficiency does not affect the expression of fatty acid synthase or perilipin, two major markers for lipogenesis. It is remarkable that the phenotypes of Vim−/− mice are similar to those of CD36−/− mice, and the metabolic phenotypes of Vim−/− mice seem to be related to the role of vimentin in CD36 trafficking, as focused on in this study. A recent paper revealed that the adipose tissue of CD36−/− mice showed less lipolytic activity and thus less free glycerol release when stimulated with isoproterenol (ISO) [24]. When CD36 of the plasma membrane was reduced by ISO in 3T3L1 cells, phosphorylation of HSL at Ser660 also decreased. These results suggest that CD36, which mediates uptake of fatty acid, promotes lipolysis and consequently maintains intracellular fatty acid homeostasis.
- In summary, we report that Vim−/− mice fed a HFD showed less adiposity and improved glucose tolerance with higher levels of serum TG and NEFA. We also found that adipocytes from Vim−/− mice had less plasma membrane expression of CD36 and GLUT4, suggesting that vimentin functions in intracellular trafficking of CD36 and GLUT4 in adipocytes. Our study proposes vimentin as a new therapeutic target for obesity and diabetes.
DISCUSSION
-
CONFLICTS OF INTEREST
No potential conflict of interest relevant to this article was reported.
-
AUTHOR CONTRIBUTIONS
Conception or design: G.T.O., Y.M.P.
Acquisition, analysis, or interpretation of data: S.Y. K.
Drafting the work or revising: I.K., W.C.
Final approval of the manuscript: S.Y.K., I.K., G.T.O., Y.M.P.
-
FUNDING
This work was supported by a National Research Foundation of Korea (NRF) grant funded by the Korean government (MSIP)(No. NRF-2015M3A9B6029133) and was partly supported by a grant funded by Health Fellowship Foundation.
NOTES
-
Acknowledgements
- None
ACKNOWLEDGMENTS
SUPPLEMENTARY MATERIALS
Supplementary Fig. 1
- 1. GBD 2015 Obesity Collaborators. Afshin A, Forouzanfar MH, Reitsma MB, Sur P, Estep K, et al. Health effects of overweight and obesity in 195 countries over 25 years. N Engl J Med 2017;377:13-27.ArticlePubMedPMC
- 2. Ye J. Mechanisms of insulin resistance in obesity. Front Med 2013;7:14-24.ArticlePubMedPMCPDF
- 3. Guo M, Ehrlicher AJ, Mahammad S, Fabich H, Jensen MH, Moore JR, et al. The role of vimentin intermediate filaments in cortical and cytoplasmic mechanics. Biophys J 2013;105:1562-1568.ArticlePubMedPMC
- 4. Biskou O, Casanova V, Hooper KM, Kemp S, Wright GP, Satsangi J, et al. The type III intermediate filament vimentin regulates organelle distribution and modulates autophagy. PLoS One 2019;14:e0209665.ArticlePubMedPMC
- 5. Liu CY, Lin HH, Tang MJ, Wang YK. Vimentin contributes to epithelial-mesenchymal transition cancer cell mechanics by mediating cytoskeletal organization and focal adhesion maturation. Oncotarget 2015;6:15966-15983.ArticlePubMedPMC
- 6. Heid H, Rickelt S, Zimbelmann R, Winter S, Schumacher H, Dorflinger Y, et al. On the formation of lipid droplets in human adipocytes: the organization of the perilipin-vimentin cortex. PLoS One 2014;9:e90386.ArticlePubMedPMC
- 7. Shen WJ, Patel S, Eriksson JE, Kraemer FB. Vimentin is a functional partner of hormone sensitive lipase and facilitates lipolysis. J Proteome Res 2010;9:1786-1794.ArticlePubMedPMC
- 8. Hirata Y, Hosaka T, Iwata T, Le CT, Jambaldorj B, Teshigawara K, et al. Vimentin binds IRAP and is involved in GLUT4 vesicle trafficking. Biochem Biophys Res Commun 2011;405:96-101.ArticlePubMed
- 9. Wilhelmsson U, Stillemark-Billton P, Boren J, Pekny M. Vimentin is required for normal accumulation of body fat. Biol Chem 2019;400:1157-1162.ArticlePubMedPDF
- 10. Winzell MS, Ahren B. The high-fat diet-fed mouse: a model for studying mechanisms and treatment of impaired glucose tolerance and type 2 diabetes. Diabetes 2004;53 Suppl 3:S215-S219.PubMed
- 11. Longo M, Zatterale F, Naderi J, Parrillo L, Formisano P, Raciti GA, et al. Adipose tissue dysfunction as determinant of obesity-associated metabolic complications. Int J Mol Sci 2019;20:E2358.Article
- 12. Park YM. CD36, a scavenger receptor implicated in atherosclerosis. Exp Mol Med 2014;46:e99.ArticlePubMedPMCPDF
- 13. Govers R. Molecular mechanisms of GLUT4 regulation in adipocytes. Diabetes Metab 2014;40:400-410.ArticlePubMed
- 14. Krintel C, Morgelin M, Logan DT, Holm C. Phosphorylation of hormone-sensitive lipase by protein kinase A in vitro promotes an increase in its hydrophobic surface area. FEBS J 2009;276:4752-4762.ArticlePubMed
- 15. Colucci-Guyon E, Portier MM, Dunia I, Paulin D, Pournin S, Babinet C. Mice lacking vimentin develop and reproduce without an obvious phenotype. Cell 1994;79:679-694.ArticlePubMed
- 16. Shen WJ, Zaidi SK, Patel S, Cortez Y, Ueno M, Azhar R, et al. Ablation of vimentin results in defective steroidogenesis. Endocrinology 2012;153:3249-3257.ArticlePubMedPMCPDF
- 17. Bjorndal B, Burri L, Staalesen V, Skorve J, Berge RK. Different adipose depots: their role in the development of metabolic syndrome and mitochondrial response to hypolipidemic agents. J Obes 2011;2011:490650.PubMedPMCPDF
- 18. Pepino MY, Love-Gregory L, Klein S, Abumrad NA. The fatty acid translocase gene CD36 and lingual lipase influence oral sensitivity to fat in obese subjects. J Lipid Res 2012;53:561-566.ArticlePubMedPMC
- 19. Febbraio M, Silverstein RL. CD36: implications in cardiovascular disease. Int J Biochem Cell Biol 2007;39:2012-2030.ArticlePubMedPMC
- 20. Oquendo P, Hundt E, Lawler J, Seed B. CD36 directly mediates cytoadherence of plasmodium falciparum parasitized erythrocytes. Cell 1989;58:95-101.ArticlePubMed
- 21. Griffin E, Re A, Hamel N, Fu C, Bush H, McCaffrey T, et al. A link between diabetes and atherosclerosis: glucose regulates expression of CD36 at the level of translation. Nat Med 2001;7:840-846.ArticlePubMedPDF
- 22. Rac ME, Safranow K, Poncyljusz W. Molecular basis of human CD36 gene mutations. Mol Med 2007;13:288-296.ArticlePubMedPMCPDF
- 23. Nagy L, Tontonoz P, Alvarez JG, Chen H, Evans RM. Oxidized LDL regulates macrophage gene expression through ligand activation of PPARgamma. Cell 1998;93:229-240.ArticlePubMed
- 24. Febbraio M, Abumrad NA, Hajjar DP, Sharma K, Cheng W, Pearce SF, et al. A null mutation in murine CD36 reveals an important role in fatty acid and lipoprotein metabolism. J Biol Chem 1999;274:19055-19062.ArticlePubMed
- 25. Abdoul-Azize S, Atek-Mebarki F, Bitam A, Sadou H, Koceir EA, Khan NA. Oro-gustatory perception of dietary lipids and calcium signaling in taste bud cells are altered in nutritionally obesity-prone Psammomys obesus. PLoS One 2013;8:e68532.ArticlePubMedPMC
- 26. Hajri T, Han XX, Bonen A, Abumrad NA. Defective fatty acid uptake modulates insulin responsiveness and metabolic responses to diet in CD36-null mice. J Clin Invest 2002;109:1381-1389.ArticlePubMedPMC
- 27. Furuhashi M, Ura N, Nakata T, Shimamoto K. Insulin sensitivity and lipid metabolism in human CD36 deficiency. Diabetes Care 2003;26:471-474.ArticlePubMedPDF
- 28. Nath A, Li I, Roberts LR, Chan C. Elevated free fatty acid uptake via CD36 promotes epithelial-mesenchymal transition in hepatocellular carcinoma. Sci Rep 2015;5:14752.ArticlePubMedPMCPDF
- 29. Chang L, Chiang SH, Saltiel AR. Insulin signaling and the regulation of glucose transport. Mol Med 2004;10:65-71.ArticlePubMedPMCPDF
- 30. Asano T, Fujishiro M, Kushiyama A, Nakatsu Y, Yoneda M, Kamata H, et al. Role of phosphatidylinositol 3-kinase activation on insulin action and its alteration in diabetic conditions. Biol Pharm Bull 2007;30:1610-1616.ArticlePubMed
- 31. Huang S, Czech MP. The GLUT4 glucose transporter. Cell Metab 2007;5:237-252.ArticlePubMed
- 32. Carvalho E, Kotani K, Peroni OD, Kahn BB. Adipose-specific overexpression of GLUT4 reverses insulin resistance and diabetes in mice lacking GLUT4 selectively in muscle. Am J Physiol Endocrinol Metab 2005;289:E551-E561.ArticlePubMed
- 33. Atkinson BJ, Griesel BA, King CD, Josey MA, Olson AL. Moderate GLUT4 overexpression improves insulin sensitivity and fasting triglyceridemia in high-fat diet-fed transgenic mice. Diabetes 2013;62:2249-2258.ArticlePubMedPMCPDF
- 34. Roefs MM, Carlotti F, Jones K, Wills H, Hamilton A, Verschoor M, et al. Increased vimentin in human α- and β-cells in type 2 diabetes. J Endocrinol 2017;233:217-227.ArticlePubMed
- 35. Kumar N, Robidoux J, Daniel KW, Guzman G, Floering LM, Collins S. Requirement of vimentin filament assembly for beta3-adrenergic receptor activation of ERK MAP kinase and lipolysis. J Biol Chem 2007;282:9244-9250.PubMed
- 36. Asensio C, Jimenez M, Kuhne F, Rohner-Jeanrenaud F, Muzzin P. The lack of beta-adrenoceptors results in enhanced insulin sensitivity in mice exhibiting increased adiposity and glucose intolerance. Diabetes 2005;54:3490-3495.PubMed
- 37. Potokar M, Kreft M, Li L, Daniel Andersson J, Pangrsic T, Chowdhury HH, et al. Cytoskeleton and vesicle mobility in astrocytes. Traffic 2007;8:12-20.ArticlePubMed
- 38. Samovski D, Sun J, Pietka T, Gross RW, Eckel RH, Su X, et al. Regulation of AMPK activation by CD36 links fatty acid uptake to β-oxidation. Diabetes 2015;64:353-359.ArticlePubMedPDF
- 39. Zhou D, Samovski D, Okunade AL, Stahl PD, Abumrad NA, Su X. CD36 level and trafficking are determinants of lipolysis in adipocytes. FASEB J 2012;26:4733-4742.ArticlePubMedPMCPDF
REFERENCES
Vimentin deficiency prevents diet-induced obesity. (A) Vim−/− mice (n=10) and control wild-type mice (n=10) were fed a high-fat diet (HFD) for 10 weeks. Body weight changes of control and Vim−/− mice on an HFD. Bars indicate mean±standard error of the mean (SEM). (B) Weights of adipose tissues from the experimental mice in (A). Bars indicate mean±SEM. (C) Representative images of adipose tissues and livers harvested from the experimental mice in (A) with hematoxylin-eosin staining. Scale bar: 100 µm. (D) The graph shows comparisons of adipocyte sizes between Vim−/− mice and wide-type mice. Adipocytes from three tissue sections per mouse type were measured. Each bar denotes the mean±SEM. (E) Concentrations of very low density lipoprotein/low density lipoprotein (VLDL/LDL), high density lipoprotein (HDL), triglyceride (TG), non-esterified fatty acid (NEFA), and free glycerol in the sera of the Vim−/− and control mice in Fig. 1A. The graph shows mean±SEM. (F) Representative images of adipose tissues from the experimental mice in (A), stained with antibody for the macrophage marker F4/80. Scale bar: 100 µm. (G) Measurements of the area stained with F4/80 antibody in the crown-like structures of adipose tissues from the experimental mice in (A). WAT, epididymal white adipose tissue; SC, subcutaneous fat; NS, non-significant. aP<0.05, bP<0.01, cP<0.001.
Vim−/− mice exhibit enhanced glucose tolerance and lower fasting glucose. (A) Glucose tolerance after a 10-week high-fat diet (n=8 for control, n=8 for Vim−/− mice). (B) Area under the curve (AUC) of (A). (C) Blood glucose levels after 16 hours of fasting (n=10 for control, n=10 for Vim−/− mice). (D) Serum insulin concentrations after 16 hours of fasting (n=6 for control, n=6 for Vim−/− mice). The graph shows mean±standard error of the mean). NS, non-significant. aP<0.01, bP<0.001.
Vimentin deficiency reduces CD36 and glucose transporter type 4 (GLUT4) trafficking to the plasma membrane in adipocytes. (A) Representative flow cytometry data of control and Vim−/− mouse adipocytes (left panel). Adipocytes were exposed to TF2-C12 fatty acid 40 µg/mL for 30 minutes. Fluorescence intensity of these cells was measured using flow cytometry (red: control+TF2-C12, green: Vim−/−+TF2-C12, light blue: untreated control adipocytes, yellow: untreated vimentin-null adipocytes). Geometric mean fluorescence intensity (right panel). (B) Western blot analysis for CD36 using the fractionated lysate from control and Vim−/− murine adipocytes. Cytosolic and membrane fractions were separated using a buffer-based protocol. Caveolin-1 was used as a marker for the plasma membrane fraction, and β-actin was used as a marker for the cytosolic fraction. (C) Quantitative real-time polymerase chain reaction to measure CD36 and GLUT4 expression in control and Vim−/− murine adipocytes. The values are normalized to the expression level of glyceraldehyde-3-phosphate dehydrogenase (GAPDH). (D) Plasma membrane-localized CD36 was measured by flow cytometry using allophycocyanin (APC)-conjugated CD36 antibody. Mean fluorescence intensities representing CD36 expression were compared between control and Vim−/− adipocytes. (E) Western blot analysis for GLUT4 using the fractionated lysates from control and Vim−/− murine adipocytes. Cytosolic and membrane fractions were separated using a buffer-based protocol. Caveolin-1 was used as a marker for the membrane fraction, and β-actin was used as a marker for the cytosolic fraction. Quantitation of band intensities (right graph). Cyto, cytosol fraction; Mem., membrane fraction; NS, non-significant. aP<0.01, bP<0.001.
Vimentin deficiency decreased lipolysis via hormone-sensitive lipase (HSL) activity. (A) Western blot analyses for HSL and phosphorylated HSL (p-HSL; Ser563, Ser660, Ser565) using homogenized epididymal fat lysates from the experimental mice in Fig. 1A (control, n=3; Vim−/−, n=3). Quantitation of the band intensities in Western blots (graphs below). (B) Western blot analyses for fatty acid synthase and perilipin using fat lysates from the experimental mice in Fig. 1A (control, n=3; Vim−/−, n=3). Quantitation of the band intensities in Western blots (graphs below). The graph shows mean±standard error of the mean. FAS, fatty acid synthase; NS, non-significant. aP<0.05.
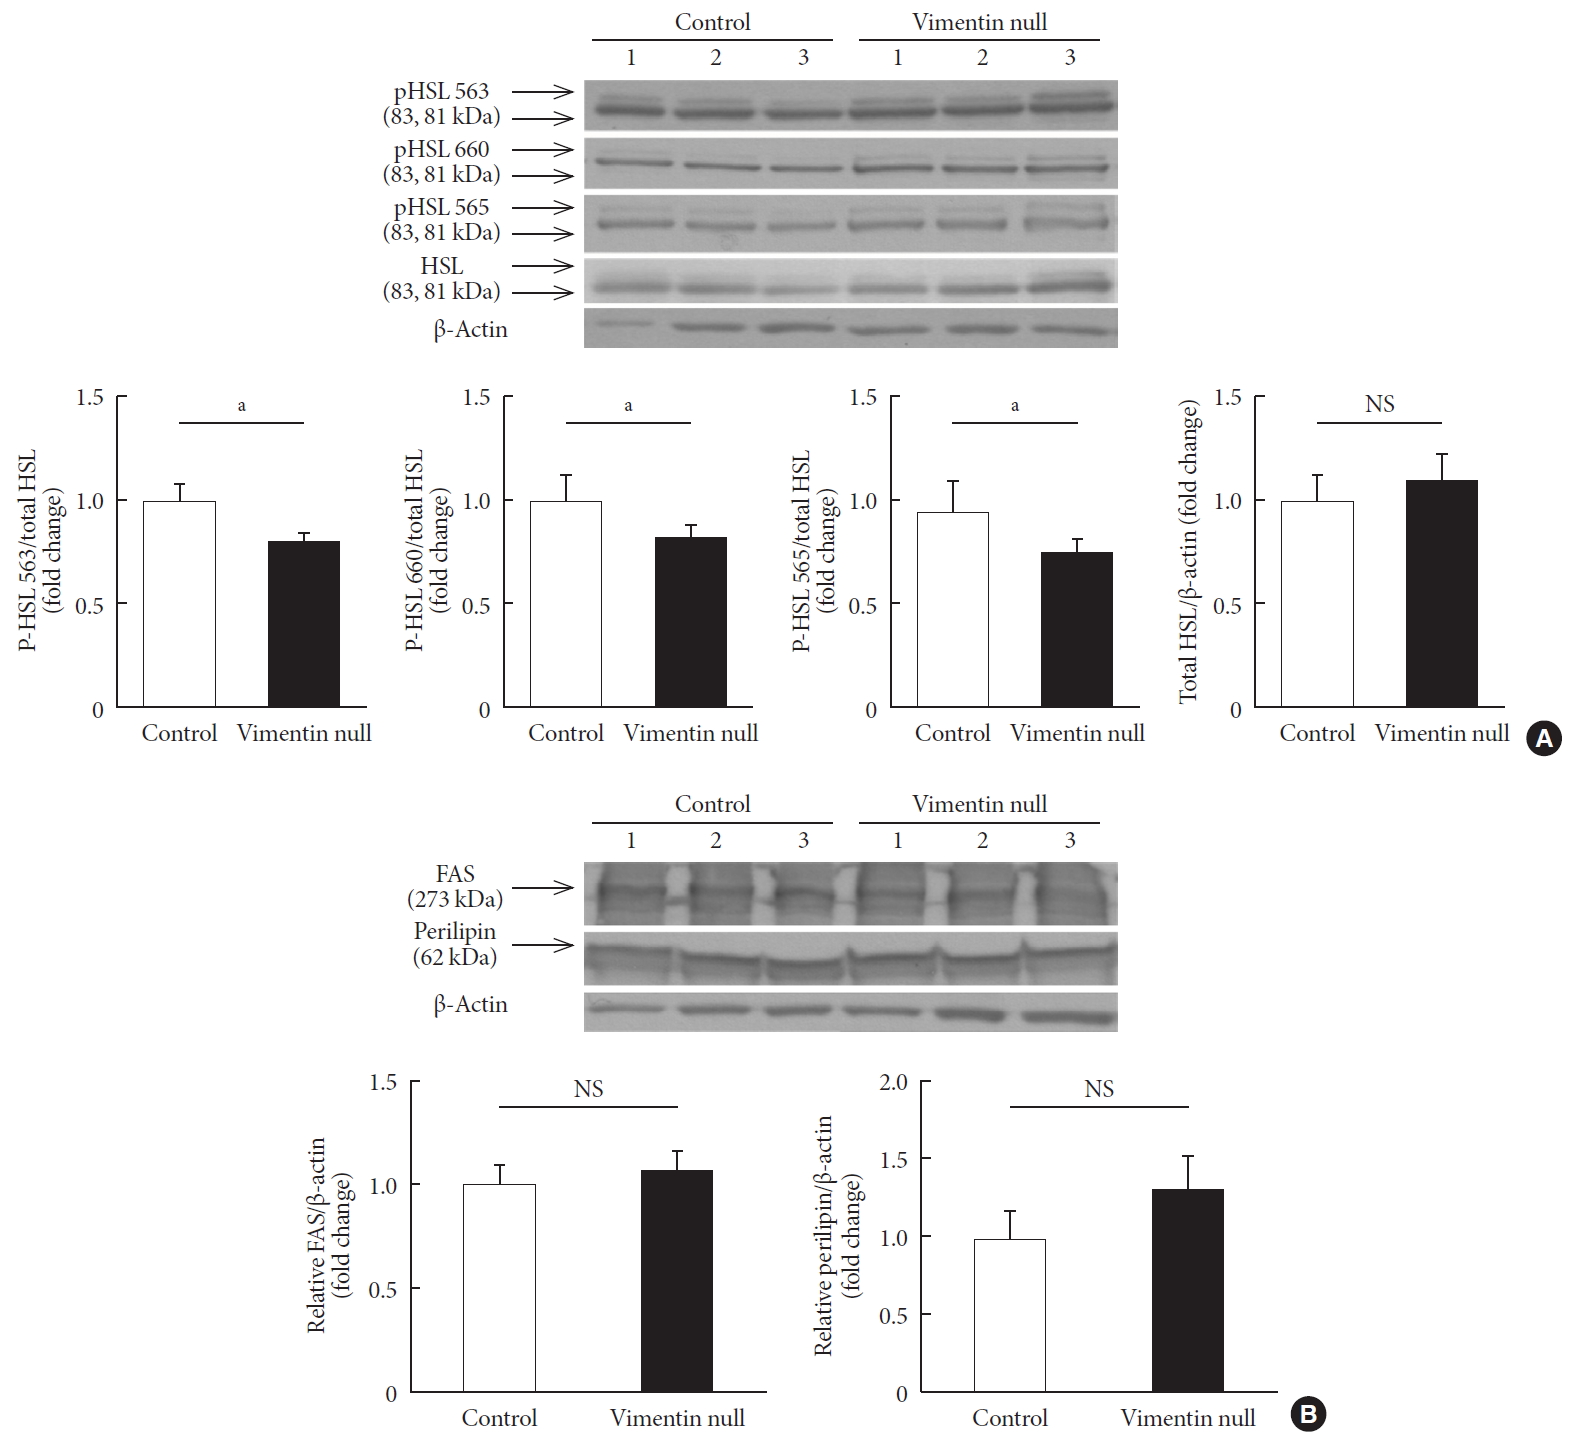
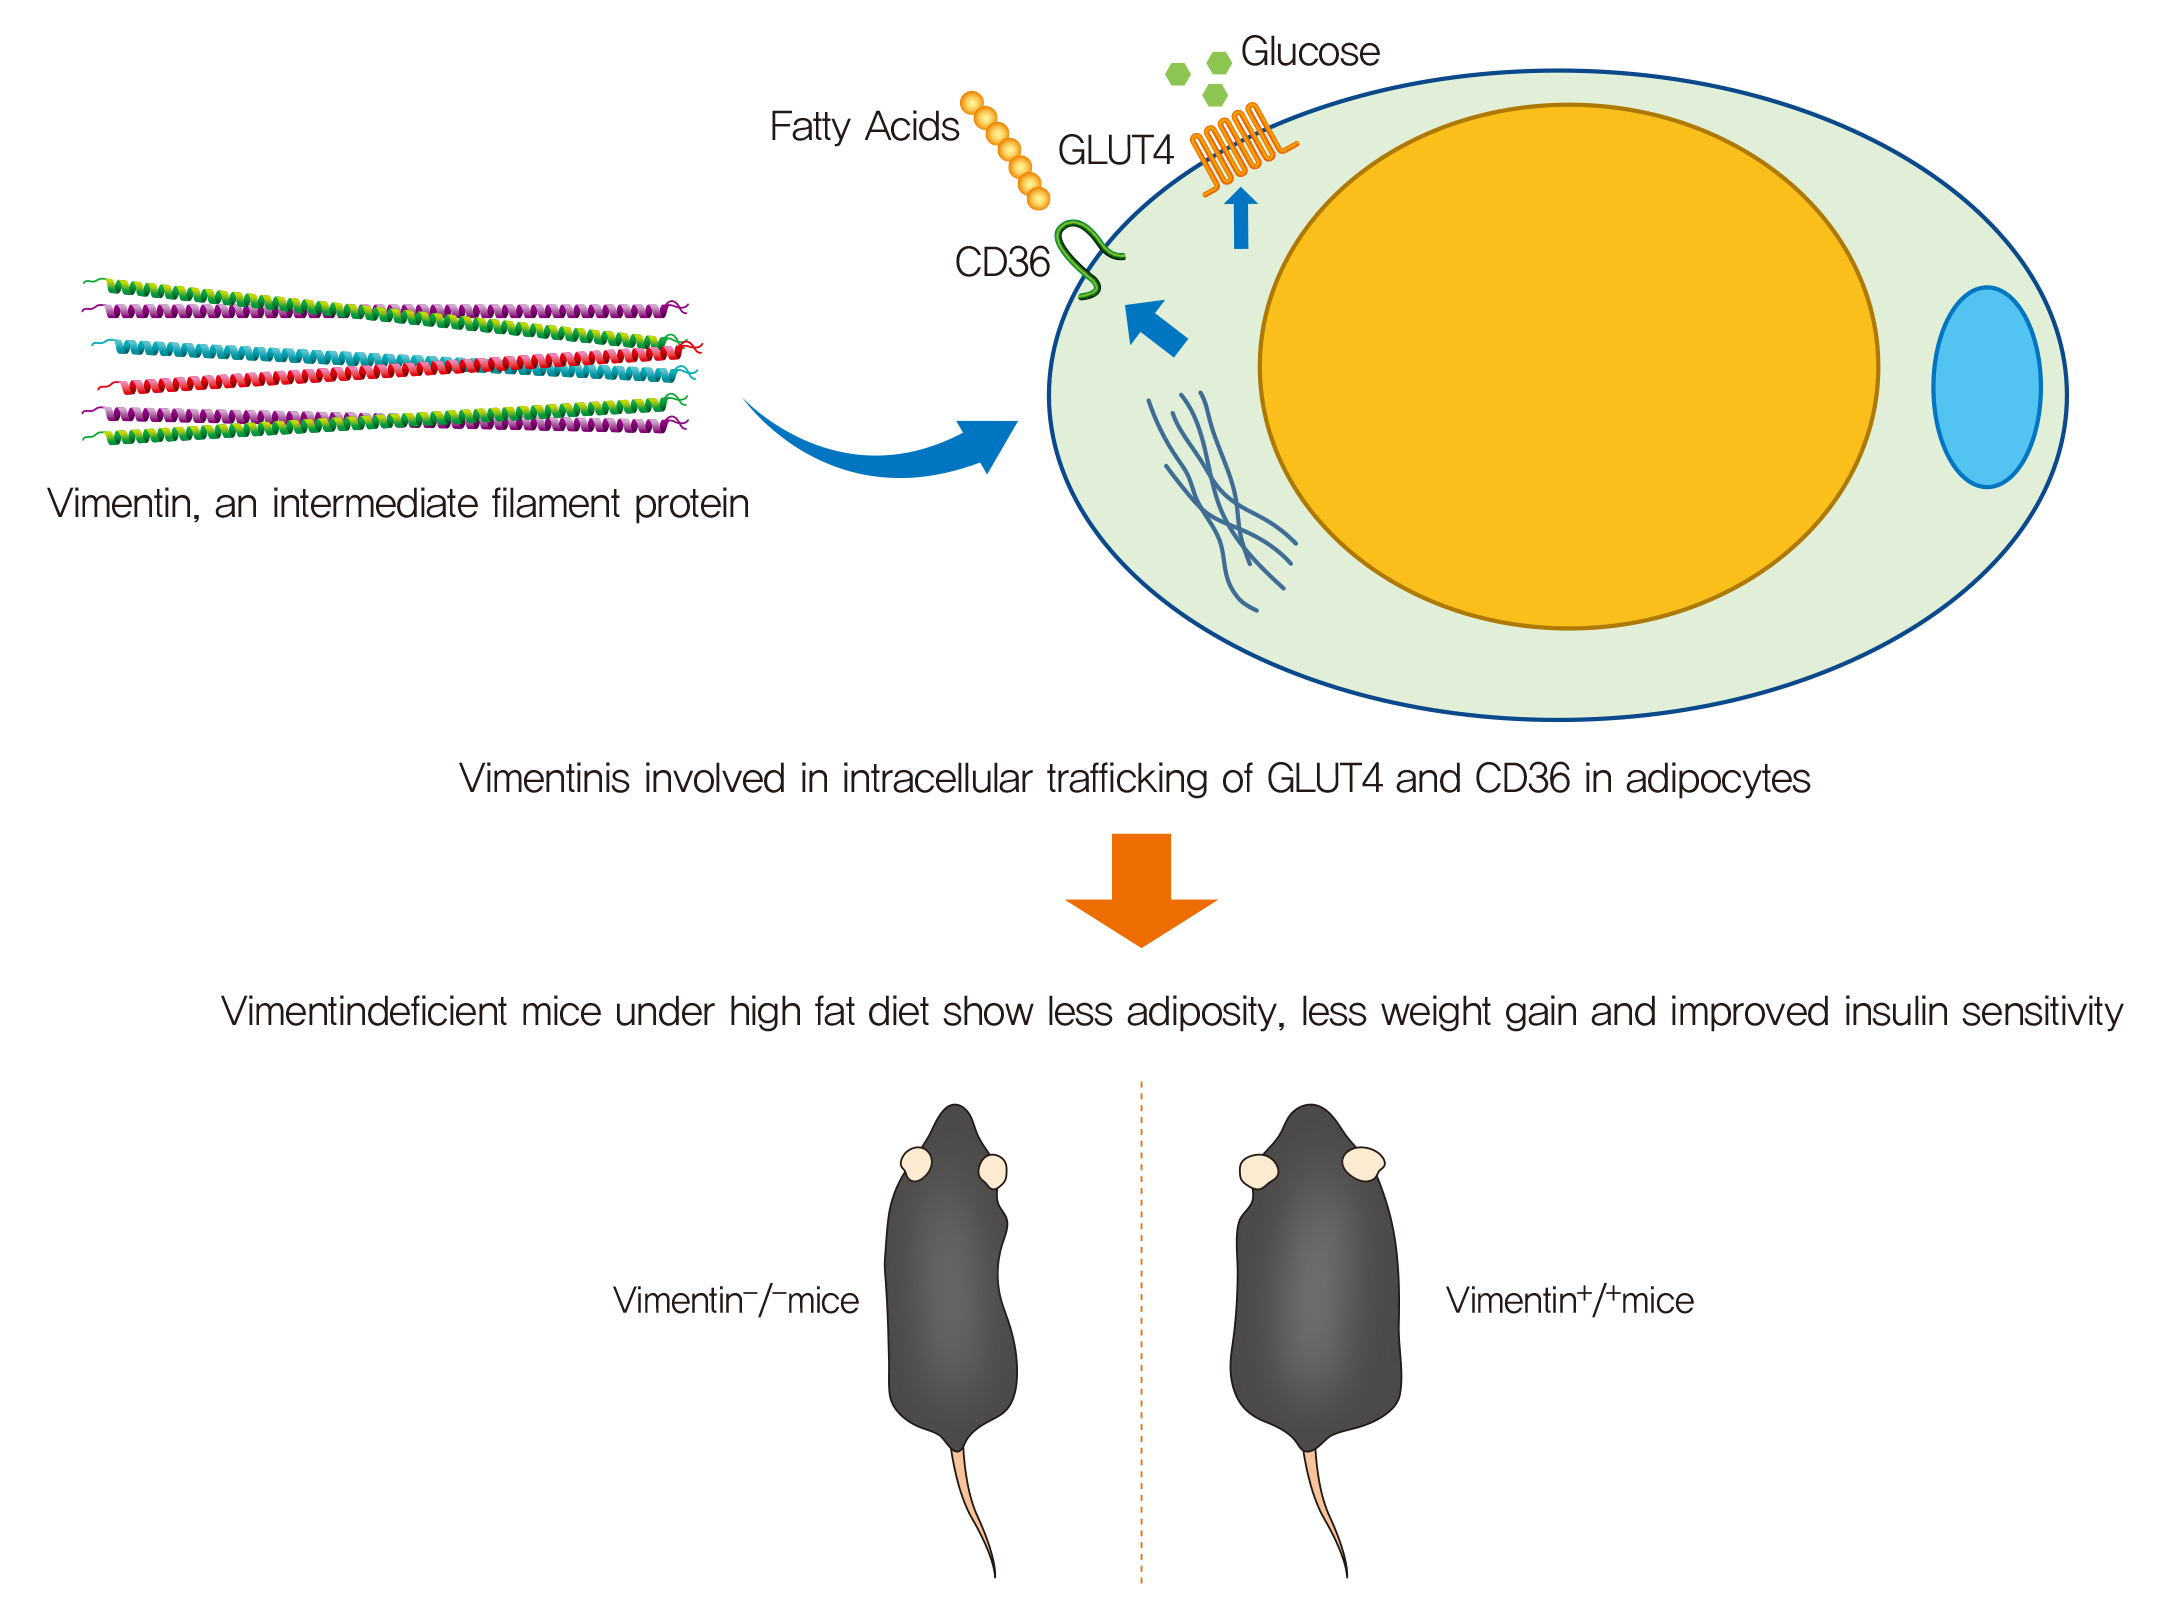
Figure & Data
References
Citations
- Extracellular Vimentin Alters Energy Metabolism And Induces Adipocyte Hypertrophy
Ji-Hae Park, Soyeon Kwon, Young Mi Park
Diabetes & Metabolism Journal.2024; 48(2): 215. CrossRef - Neutrophils display distinct post-translational modifications in response to varied pathological stimuli
Pooja Yedehalli Thimmappa, Aswathy S Nair, Sian D'silva, Anjana Aravind, Sandeep Mallya, Sreelakshmi Pathappillil Soman, Kanive Parashiva Guruprasad, Shamee Shastry, Rajesh Raju, Thottethodi Subrahmanya Keshava Prasad, Manjunath B Joshi
International Immunopharmacology.2024; 132: 111950. CrossRef - Extracellular Vesicles as Carriers of Adipokines and Their Role in Obesity
Tamara Camino, Nerea Lago-Baameiro, María Pardo
Biomedicines.2023; 11(2): 422. CrossRef - Bioinformatics and Next-Generation Data Analysis for Identification of Genes and Molecular Pathways Involved in Subjects with Diabetes and Obesity
Prashanth Ganekal, Basavaraj Vastrad, Satish Kavatagimath, Chanabasayya Vastrad, Shivakumar Kotrashetti
Medicina.2023; 59(2): 309. CrossRef - Modified Signaling of Membrane Formyl Peptide Receptors in NADPH-Oxidase Regulation in Obesity-Resistant Mice
Irina Tikhonova, Alsu Dyukina, Elvira Shaykhutdinova, Valentina Safronova
Membranes.2023; 13(3): 306. CrossRef - Plasma Cytokeratin-18 Fragment Level Reflects the Metabolic Phenotype in Obesity
Joanna Goralska, Urszula Razny, Anna Gruca, Anna Zdzienicka, Agnieszka Micek, Aldona Dembinska-Kiec, Bogdan Solnica, Malgorzata Malczewska-Malec
Biomolecules.2023; 13(4): 675. CrossRef - Blueberry and Blackberry Anthocyanins Ameliorate Metabolic Syndrome by Modulating Gut Microbiota and Short-Chain Fatty Acids Metabolism in High-Fat Diet-Fed C57BL/6J Mice
Lanlan Du, Han Lü, Yan Chen, Xiaohua Yu, Tunyu Jian, Huifang Zhao, Wenlong Wu, Xiaoqin Ding, Jian Chen, Weilin Li
Journal of Agricultural and Food Chemistry.2023; 71(40): 14649. CrossRef - An analogue of the Prolactin Releasing Peptide reduces obesity and promotes adult neurogenesis
Sara KM Jörgensen, Alena Karnošová, Simone Mazzaferro, Oliver Rowley, Hsiao-Jou Cortina Chen, Sarah J Robbins, Sarah Christofides, Florian T Merkle, Lenka Maletínská, David Petrik
EMBO Reports.2023; 25(1): 351. CrossRef - Cytoskeleton alterations in non-alcoholic fatty liver disease
João Pessoa, José Teixeira
Metabolism.2022; 128: 155115. CrossRef - Recent Advances in the Treatment of Insulin Resistance Targeting Molecular and Metabolic Pathways: Fighting a Losing Battle?
Marta Wolosowicz, Slawomir Prokopiuk, Tomasz W. Kaminski
Medicina.2022; 58(4): 472. CrossRef - Roles of vimentin in health and disease
Karen M. Ridge, John E. Eriksson, Milos Pekny, Robert D. Goldman
Genes & Development.2022; 36(7-8): 391. CrossRef - Plasma Membrane Localization of CD36 Requires Vimentin Phosphorylation; A Mechanism by Which Macrophage Vimentin Promotes Atherosclerosis
Seo Yeon Kim, Se-Jin Jeong, Ji-Hae Park, Wonkyoung Cho, Young-Ho Ahn, Youn-Hee Choi, Goo Taeg Oh, Roy L. Silverstein, Young Mi Park
Frontiers in Cardiovascular Medicine.2022;[Epub] CrossRef - Camel Proteins and Enzymes: A Growing Resource for Functional Evolution and Environmental Adaptation
Mahmoud Kandeel, Abdulla Al-Taher, Katharigatta N. Venugopala, Mohamed Marzok, Mohamed Morsy, Sreeharsha Nagaraja
Frontiers in Veterinary Science.2022;[Epub] CrossRef - Brown Adipose Tissue Sheds Extracellular Vesicles That Carry Potential Biomarkers of Metabolic and Thermogenesis Activity Which Are Affected by High Fat Diet Intervention
Tamara Camino, Nerea Lago-Baameiro, Aurelio Sueiro, Susana Belén Bravo, Iván Couto, Francisco Fernando Santos, Javier Baltar, Felipe F. Casanueva, María Pardo
International Journal of Molecular Sciences.2022; 23(18): 10826. CrossRef - Dietary tea seed saponin combined with aerobic exercise attenuated lipid metabolism and oxidative stress in mice fed a high‐fat diet (HFD)
Wenjing Cao, Keying Wang, Chanhua Liang, Yanming Su, Shuang Liu, Jiali Li, Huishan Qing, Zhen Zeng, Ling Dai, Jia‐Le Song
Journal of Food Biochemistry.2022;[Epub] CrossRef - Influence of Protein Carbonylation on Human Adipose Tissue Dysfunction in Obesity and Insulin Resistance
M. Carmen Navarro-Ruiz, M. Carmen Soler-Vázquez, Alberto Díaz-Ruiz, Juan R. Peinado, Andrea Nieto Calonge, Julia Sánchez-Ceinos, Carmen Tercero-Alcázar, Jaime López-Alcalá, Oriol A. Rangel-Zuñiga, Antonio Membrives, José López-Miranda, María M. Malagón, R
Biomedicines.2022; 10(12): 3032. CrossRef - The Role of Adipose Tissue Lipolysis in Diet-Induced Obesity: Focus on Vimentin
Eun Roh, Hye Jin Yoo
Diabetes & Metabolism Journal.2021; 45(1): 43. CrossRef
 PubReader
 ePub Link
 Cite
Cite


