- Current
- Browse
- Collections
-
For contributors
- For Authors
- Instructions to authors
- Article processing charge
- e-submission
- For Reviewers
- Instructions for reviewers
- How to become a reviewer
- Best reviewers
- For Readers
- Readership
- Subscription
- Permission guidelines
- About
- Editorial policy
Articles
- Page Path
- HOME > Diabetes Metab J > Volume 45(2); 2021 > Article
-
Original ArticleMetabolic Risk/Epidemiology Age- and Sex-Related Differential Associations between Body Composition and Diabetes Mellitus
-
Eun Roh1
 , Soon Young Hwang2, Jung A Kim1, You-Bin Lee1, So-hyeon Hong1, Nam Hoon Kim1, Ji A Seo1, Sin Gon Kim1, Nan Hee Kim1, Kyung Mook Choi1, Sei Hyun Baik1, Hye Jin Yoo1
 -
Diabetes & Metabolism Journal 2021;45(2):183-194.
DOI: https://doi.org/10.4093/dmj.2019.0171
Published online: June 16, 2020
1Division of Endocrinology and Metabolism, Department of Internal Medicine, Korea University College of Medicine, Seoul, Korea
2Department of Biostatistics, Korea University College of Medicine, Seoul, Korea
-
Corresponding author: Hye Jin Yoo Division of Endocrinology and Metabolism, Department of Internal Medicine, Korea University Guro Hospital, Korea University College of Medicine, 148 Gurodong-ro, Guro-gu, Seoul 08308, Korea. deisy21@naver.com
Copyright © 2021 Korean Diabetes Association
This is an Open Access article distributed under the terms of the Creative Commons Attribution Non-Commercial License (http://creativecommons.org/licenses/by-nc/4.0/) which permits unrestricted non-commercial use, distribution, and reproduction in any medium, provided the original work is properly cited.
ABSTRACT
-
Background
- The age- and sex-related differences on the impacts of body composition on diabetes mellitus (DM) remain uncertain.
-
Methods
- The fourth and fifth Korea National Health and Nutrition Examination Survey included 15,586 subjects over 30 years of age who completed dual-energy X-ray absorptiometry. We conducted a cross-sectional study to investigate whether muscle mass index (MMI), defined as appendicular skeletal muscle divided by body mass index (BMI), and fat mass index (FMI), defined as trunk fat mass divided by BMI, were differently associated with DM according to age and sex.
-
Results
- In multivariate logistic regression, the risk for DM significantly increased across quartiles of FMI in men aged ≥70. Meanwhile, MMI showed a protective association with DM in men of the same age. The odds ratios (ORs) for the highest quartile versus the lowest quartile of FMI and MMI were 3.116 (95% confidence interval [CI], 1.405 to 6.914) and 0.295 (95% CI, 0.157 to 0.554), respectively. In women, the ORs of DM was significantly different across FMI quartiles in those over age 50. The highest quartile of FMI exhibited increased ORs of DM in subjects aged 50 to 69 (OR, 1.891; 95% CI, 1.229 to 2.908) and ≥70 (OR, 2.275; 95% CI, 1.103 to 4.69) compared to lowest quartile. However, MMI was not significantly associated with DM in women of all age groups.
-
Conclusion
- Both FMI and MMI were independent risk factors for DM in men aged 70 years or more. In women over 50 years, FMI was independently associated with DM. There was no significant association between MMI and DM in women.
- The increase in visceral fat mass and the loss of muscle mass with aging has been well documented [123]. Age-dependent changes in body fat distribution are risk factors for the development of type 2 diabetes mellitus (DM). Visceral fat accumulation has been associated with the development of type 2 DM through peripheral insulin resistance, increased hepatic glucose production [4], hypoadiponectinemia [5], and systemic inflammation [6]. In animal studies, surgical removal of abdominal fat prevents the onset of age-dependent insulin resistance and delays the onset of DM [7]. The physiologic role of low muscle mass in insulin resistance and DM has recently been studied. Low muscle mass was strongly associated with insulin resistance, prediabetes, and the development of type 2 DM independent of general obesity [8910].
- The patterns and rates of age-related changes in body composition vary by sex, ethnicity, and physical activity. Several studies have demonstrated that men lose greater skeletal muscle mass with aging even though they have a greater skeletal muscle mass than that in women [1112]. Furthermore, men accumulated more central adiposity than women throughout the entire life span, although women generally have higher total adiposity relative to that in men [1314]. As a result, men have a relatively higher risk of cardiovascular diseases compared to that in age-matched women, whereas by age 70, the incidence of cardiovascular diseases is similar between sexes [15]. In women, the transition into menopause leads to a critical shift to metabolic disturbances. The protective effect of favorable body fat distribution in women rapidly disappears after menopause [16]. After menopause, adipose distribution shifts from gluteofemoral subcutaneous adipose tissue to abdominal visceral adipose tissue [17]. Therefore, the relative importance of body composition on the incidence of type 2 DM might be quite different according to age and sex. However, few studies have simultaneously compared the differential association between body composition and type 2 DM according to age and sex.
- In this study, we evaluated the association of fat mass index (FMI), calculated as trunk fat mass divided by body mass index (BMI), and muscle mass index (MMI), defined as appendicular muscle mass divided by BMI, with the presence of DM in different age groups (30 to 49, 50 to 69, and ≥70 years) in men and women based on data from the Korean National Health and Nutrition Examination Survey (KNHANES), a nationally representative cross-sectional survey.
INTRODUCTION
- Study population
- This study was performed using data from KNHANES IV and V (2008 to 2011). The KNHANES is a nationwide, community-based cross-sectional survey conducted by the Division of Health and Nutritional Survey under the Korean Centers for Disease Control and Prevention (KCDCP). The survey was composed of a health interview, health examination, and nutrition surveys. The KNHANES used a stratified, multistage, clustered probability sampling method to select a representative sample of the noninstitutionalized, civilian Korean population. The survey was conducted according to the guidelines in the Declaration of Helsinki and all procedures were approved by the Institutional Review Board of the KCDCP (IRB: 2008-04EXP-01-C, 2009-01CON-03-2C, 2010-02CON-21-C, and 2011-02CON-06-C). All participants in this survey signed an informed consent form.
- Among those who participated in the KNHANES 2008 to 2011, we included 16,893 individuals aged ≥30 years who completed dual-energy X-ray absorptiometry (DXA) (QDR 4500A; Hologic Inc., Bedford, MA, USA) measurements in the mobile examination centers. DXA is a widely used method of measuring muscle and fat mass for its reasonable cost and convenience of examination. Individuals who had missing data on BMI, trunk fat mass, or appendicular skeletal muscle mass, or who had missing data on fasting plasma glucose or self-reported information on diagnosis of DM or antidiabetic medication were excluded.
- Measurements
- The BMI was calculated as the weight in kilograms divided by the square of the height in meters (kg/m2). Blood samples were obtained from each participant in the morning after overnight fasting. The fasting plasma concentrations of glucose and lipids were measured enzymatically in a central laboratory. Low-density lipoprotein cholesterol (LDL-C) levels were calculated using the Friedewald's formula [18] in individuals with triglyceride (TG) concentrations ≤400 mg/dL in 2008. LDL-C level has been directly measured using automated enzymatic techniques since 2009.
- Fat and muscle masses were obtained using the value of DXA. Appendicular skeletal muscle mass (ASM), the sum of the muscle masses of both arms and legs, was defined by excluding the bone mass from the lean mass of the extremities. We then adjusted the absolute level of ASM for body size using BMI as ASM/BMI. ASM/BMI was introduced as an indicator of MMI by the Foundation for the National Institutes of Health (FNIH) Sarcopenia Project in 2014 [19]. The abdominal fat index used trunk fat/BMI as the FMI.
- Definition of DM and covariates
- DM was defined according to the American Diabetes Association guidelines [20] as subjects with fasting plasma glucose levels over 126 mg/dL or who responded to health interview survey as having had a previous diagnosis of DM by a physician or treated with antidiabetic agents or insulin. Information concerning smoking and drinking status was obtained from a questionnaire in the health interview survey. Regular exercise was defined as strenuous physical activity for at least 20 minutes and ≥3 time/week. Income levels were dichotomized at the lower 25%.
- Statistical analysis
- Statistical analyses were performed using SAS version 9.4 (SAS Institute Inc., Cary, NC, USA). All analyses were conducted using sampling weights of KNHANES complex sample survey design. The results were presented as mean±standard error for nominal data and as counts (percentage, %) for continuous variables. To investigate age-related differences in the impacts of muscle mass and fat mass on DM, we grouped the participants into three age categories; 30 to 49, 50 to 69, and more than 70 years. We examined the baseline characteristics of the study population according to different age categories and the presence of DM. We then performed logistic regression to examine the impact of body composition on the risk of DM. Body composition was classified and expressed as quartiles of trunk fat/BMI and ASM/BMI. Next, we evaluated risk of DM according to quartiles of FMI and MMI after adjusting only for age and BMI, or by adding various metabolic parameters including age, BMI, systolic and diastolic BP, high-density lipoprotein cholesterol (HDL-C), TG, aspartate aminotransferase (AST), alanine aminotransferase (ALT), and lifestyle factors such as low income, current smoking, drinking, and regular exercise. Statistical significance was assumed at P<0.05. All statistical analyses were performed by an experienced professional statistician who was also one of the authors.
METHODS
- Baseline characteristics of the study population
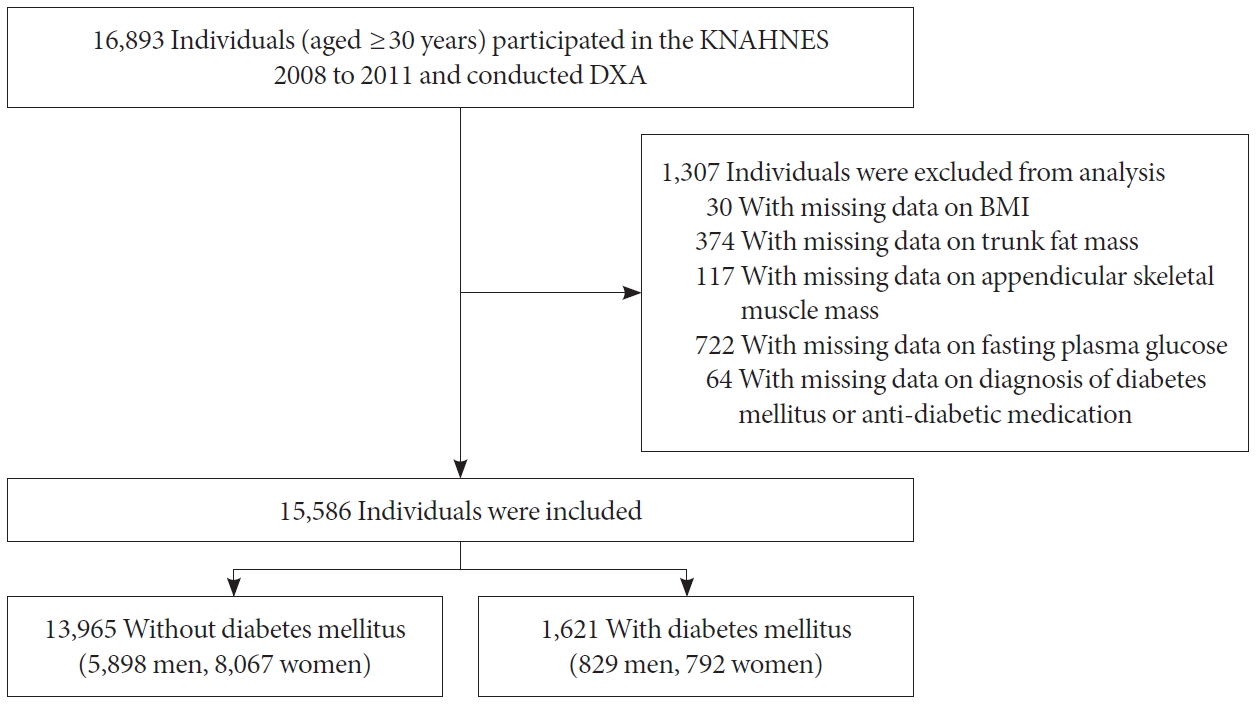
- Among 16,893 individuals aged ≥30 years who completed DXA measurement, a total of 1,307 individuals with missing data on BMI (n=30), trunk fat mass (n=374), or ASM (n= 117), or who missing data on fasting plasma glucose (n=722) or self-reported information on diagnosis of DM or antidiabetic medication (n=64) were excluded (Fig. 1). The baseline characteristics of the study participants according to age categories and the presence of DM are described in Table 1. A total of 829 men with DM and 5,898 men without DM were included in this study. The proportion of subjects of DM was about 5%, 18.4%, and 18.5% in men aged 30 to 49, 50 to 69, and more than 70 years, respectively. In all age groups, subjects with DM had higher body weight, BMI, and waist circumference. Subjects with DM also had higher trunk fat and FMI and lower MMI although ASM did not differ according to the presence or absence of DM. Systolic BP was higher in subjects with DM in all age groups. Subjects with DM also had lower HDL-C and higher TG, AST, and ALT in all age groups. The percentage of subjects with low income was higher in subjects with DM aged 30 to 49 and 50 to 69 years.
- A total of 792 women with DM and 8,067 women without DM were included in this study. The proportion of subjects of DM was about 2.4%, 12.4%, and 19.8% in women aged 30 to 49, 50 to 69, and more than 70 years, respectively. In women, patterns of anthropometric parameters, systolic BP, lipid levels, liver function tests and lifestyle according to the presence of DM were similar to those of men.
- Age-related associations between body composition and DM in men and women after adjusting for age and BMI
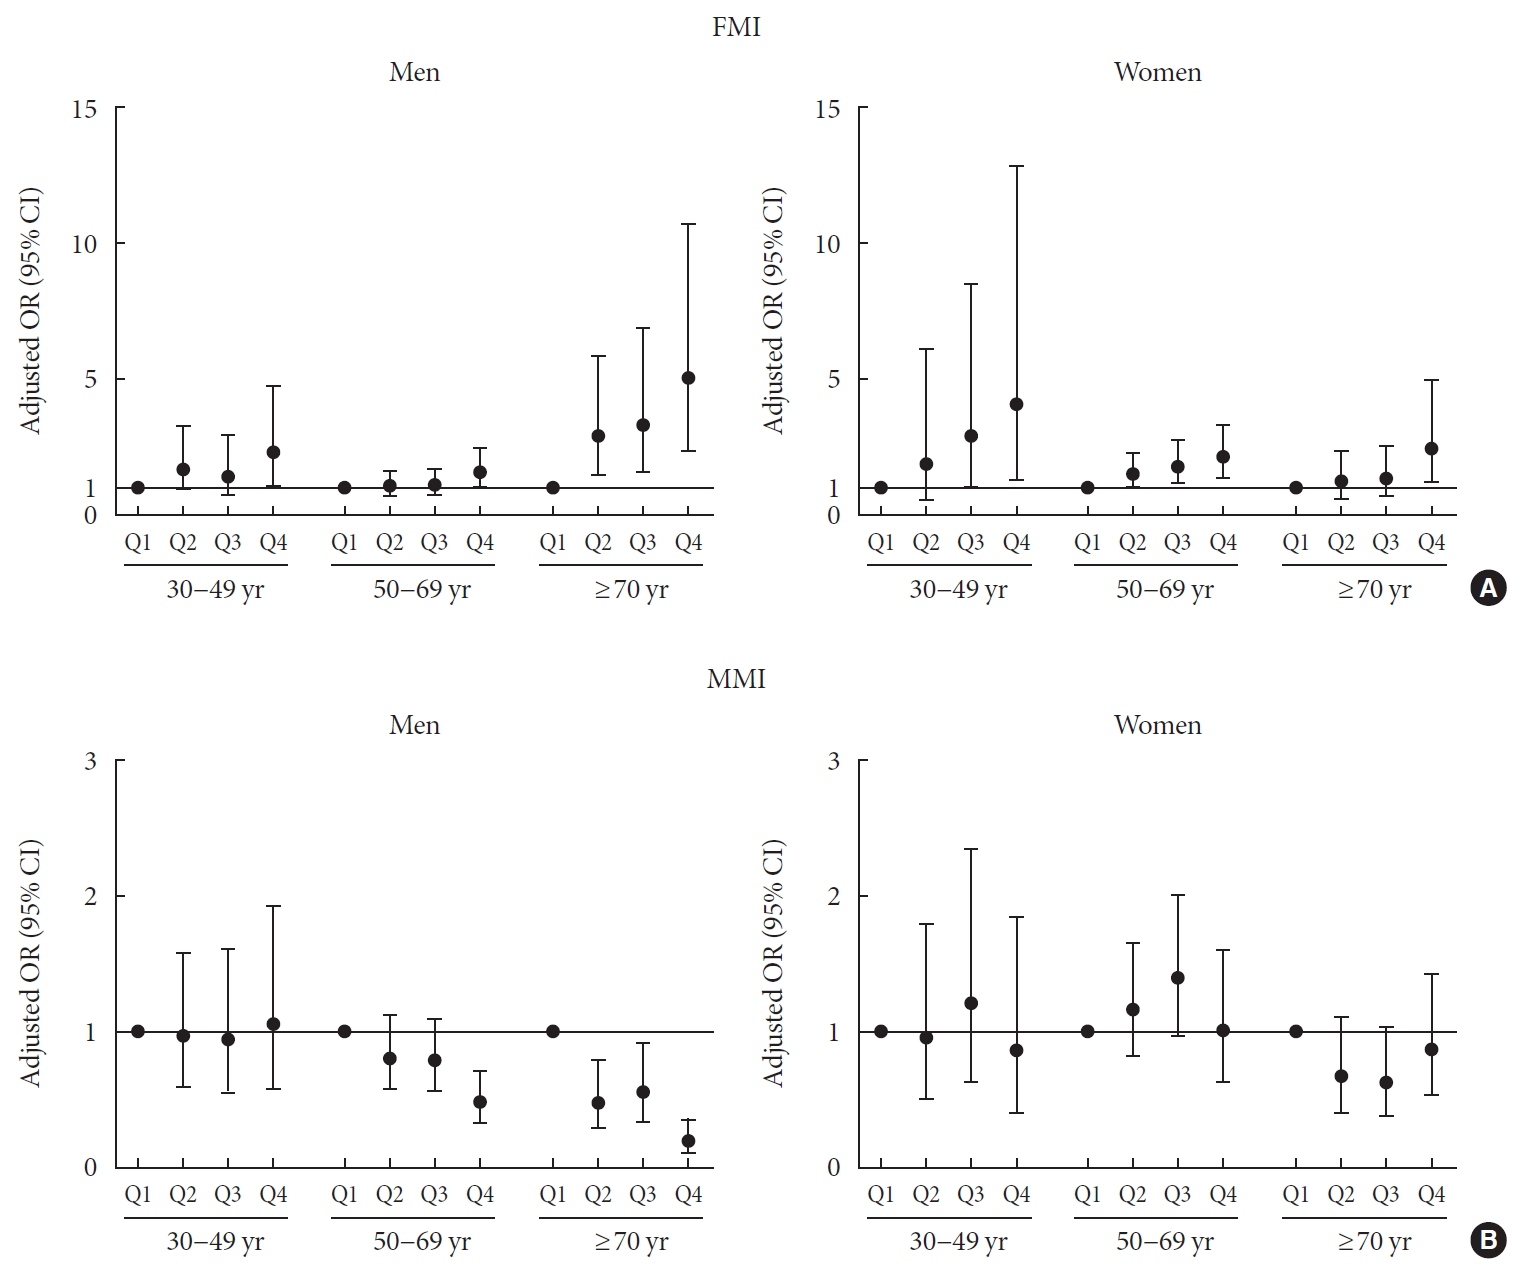
- The age and BMI-adjusted odds ratios (ORs) and 95% confidence intervals (CIs) for the association of the quartiles of FMI and MMI with DM were analyzed by logistic regression and stratified by age (Fig. 2, Supplementary Table 1). In 30 to 69-year-old men, the subjects with the FMI Q4 showed a significantly increased risk for DM (OR, 2.311; 95% CI, 1.121 to 4.764 for 30 to 49-year-old men) (OR, 1.579; 95% CI, 1.010 to 2.468 for 50 to 69-year-old men) compared with those with FMI Q1, while those with FMI Q2 and Q3 exhibited no definite increased risk. However, in elderly men (more than 70 years), there was a sequentially increased risk for DM according to the quartiles of FMI (P=0.001). The ORs were 2.947 (95% CI, 1.481 to 5.864), 3.325 (95% CI, 1.600 to 6.910) and 5.063 (95% CI, 2.391 to 10.722) for Q2, Q3, and Q4 of FMI, respectively. In contrast, the quartiles of MMI had no significant association with DM in 30 to 49-year-old men. In 50 to 69-year-old men, there was a statistically significant association between MMI quartiles and DM (P=0.004) after adjusting age and BMI without considering other metabolic risk factor; those with MMI Q4 showed a significant negative association with DM (OR, 0.481; 95% CI, 0.326 to 0.71) compared those with MMI Q1. Elderly men (≥70 years) exhibited a graded decreased risk of DM according to increasing MMI quartiles (P<0.001). The ORs were 0.476 (95% CI, 0.288 to 0.787), 0.557 (95% CI, 0.339 to 0.916) and 0.190 (95% CI, 0.102 to 0.355) for Q2, Q3, and Q4 of MMI, respectively. These results suggested that elderly men were more vulnerable to unfavorable body composition such as high visceral fat and low muscle mass than were middle-aged men.
- In 30 to 49-year-old women, although there was no statistically significant association between FMI quartiles and DM (P=0.083), subjects with FMI Q3 and Q4 had increased risk for DM (OR, 2.949; 95% CI, 1.020 to 8.532 for Q3) (OR, 4.111; 95% CI, 1.319 to 12.813 for Q4) compared to those with FMI Q1. On the other hand, in 50 to 69-year-old women, there was a sequentially increased risk for DM according to the quartiles of FMI (P=0.003). The ORs were 1.517 (95% CI, 1.014 to 2.270), 1.813 (95% CI, 1.205 to 2.729) and 2.169 (95% CI, 1.433 to 3.285) for Q2, Q3, and Q4 of FMI, respectively. In elderly women (≥70 years), the subjects with FMI Q4 showed a significantly increased risk for DM (OR, 2.493; 95% CI, 1.253 to 4.960) compared to those with FMI Q1 and FMI quartiles were significantly associated with DM (P=0.017). In contrast, there was no statistically significant association between MMI and DM in any age group, although subjects with MMI Q3 had increased risk for DM (OR, 1.515; 95% CI, 1.036 to 2.217) compared to those with MMI Q1 in women aged 50 to 69 years.
- Age-related associations between body composition and DM in men and women after adjusting for other metabolic parameters
- We performed univariate and multivariate logistic regression analyses to evaluate the association of body composition and other metabolic parameters with DM (Tables 2 and 3). In men, FMI remained significantly associated with DM only in age over 70 years in multivariate analysis after adjusting for other metabolic risk factors (P=0.049). In that age group, as the quartile of FMI increased, the risk of DM increased. The OR of subjects with FMI Q4 was 3.116 (95% CI, 1.405 to 6.914). Similarly, MMI had a significant negative association with DM only in age over 70 years in multivariate analysis (P=0.001). The OR in subjects with MMI Q4 was 0.295 (95% CI, 0.157 to 0.554). However, in men aged 50 to 69 years, the significant association between the quartile of MMI and DM (P=0.004) (Supplementary Table 1) was disappeared after adjusting other metabolic risk factors (P=0.12), although subjects with MMI Q4 had decreased risk for DM (OR, 0.621; 95% CI, 0.411 to 0.937) compared to those with MMI Q1. In that age group, metabolic parameters such as BMI, systolic and diastolic BP, HDL-C, and ALT and lifestyle parameters including low income and current smoking were statistically significant risk factors for DM. Finally, in men aged less than 50 years, age, TG level, and low income were significant factors related to DM (Table 2).
- In women, FMI had a significant positive association with DM in univariate analysis in all age groups and remained significantly associated with DM only in subjects more than 50 years old after adjusting for other metabolic risk factors (P= 0.036 for women aged 50 to 69 and P=0.045 for women aged ≥70 years). The ORs in subjects with the FMI Q4 were 1.891 (95% CI, 1.229 to 2.908) and 2.275 (95% CI, 1.103 to 4.69) in age group 50 to 69 and ≥70 years, respectively. In women aged 30 to 49 years, there was no statistical significant association between FMI quartiles and DM (P=0.102), although subjects with FMI Q4 had increased risk for DM (OR, 3.997; 95% CI, 1.184 to 13.493) compared with those with FMI Q1. BMI itself was a statistically significant risk factor for DM in women aged 30 to 49 years (OR, 1.113; 95% CI, 1.03 to 1.203). In contrast, MMI had a significant negative association with DM in univariate analysis in all age groups; however, these associations all disappeared in multivariate analysis (Table 3).
RESULTS
- The results of the present study revealed age-related differential associations between body composition and DM in both men and women. In men, after excluding the influence of other metabolic parameters, FMI and MMI were significant independent risk factors for DM especially in those over 70 years of age. In women, the impact of FMI on the presence of DM remained significant at age over 50 years but there was no significant association between MMI and DM in all ages of women in fully adjusted model.
- In addition to general obesity, the distribution of body fat is independently associated with metabolic syndrome and DM [2122]. Visceral adipose tissue, as measured using computed tomography, increased the risk of metabolic syndrome in elderly men and women, particularly among those of normal body weight [21]. Moreover, visceral adipose tissue mass was higher in men and women with type 2 DM and was associated with higher fasting insulin levels in normal-weight men and women [22]. DXA is a simple tool to measure regional fat and lean masses in individuals. Using DXA, several studies showed that higher levels of trunk fat were associated with insulin resistance and metabolic abnormalities related with cardiovascular diseases [233425]. The rate of lipolysis is accelerated in trunk fat and circulating free fatty acids released from trunk fat contribute to disturbances in glucose metabolism [2627]. In contrast, leg fat may play a protective role as adipocytes in these regions are less sensitive to lipolytic stimuli and more likely to take up free fatty acids from the circulation [2829]. Actually, higher leg fat mass was associated with a lower risk of DM in Korean adults aged 50 years or older [30]. As a result, body fat distribution critically mediates metabolic disturbances rather than simple obesity.
- Recent and growing evidence has focused on the reciprocal negative cycle between the accumulation of visceral fat and muscle atrophy. Skeletal muscle mass comprises a large portion of body mass and is the major site for disposal of ingested glucose in individuals with normal glucose tolerance [3132]. Previous epidemiologic studies showed that skeletal muscle mass was inversely associated with insulin resistance and the risk of developing type 2 DM. A cross-sectional study by Srikanthan et al. [9] based on the third National Health and Nutrition Examination Survey (NHANES) showed that muscle mass was inversely associated with insulin resistance and the prevalence of prediabetes in middle-aged adults]. A recent cohort study of young and middle-aged Korean men and women reported that muscle mass was negatively associated with the development of type 2 DM [33]. These two studies estimated the ratio of total skeletal muscle mass to total body weight as MMI using bioelectrical impedance. Using DXA, we used ASM/BMI as an indicator of muscle mass. Recently, ASM/BMI was proposed as an operational method for calculating muscle mass by the FNIH Sarcopenia Project [19]. By performing statistical classification and regression tree analysis, they reported the MMI to be the most strongly and directly correlated index of weakness and slowness combined with sarcopenia [19].
- As the changes in patterns of body composition according to age differ between men and women, it is critical to examine the differential relationships between body composition and DM by age and sex. Our study examined the age-related association of body composition with DM in both men and women aged 30 years and more. We compared the impact of body composition and other metabolic parameters as determinants of DM in three age groups; 30 to 49, 50 to 69, and ≥70 years. Metabolic parameters such as BMI, BP, HDL-C, ALT and lifestyle factors such as low income and current smoking are risk factors for DM in men in their 50s and 60s. The 50 to 69-year-old men in the highest quartile of MMI showed lower risk of DM compared to those in the lowest quartile of MMI, although there was no grossly significant difference in the risk of DM across MMI quartiles. Meanwhile, both FMI and MMI quartiles remain independent risk factors for DM in men aged 70 years or more. In elderly men, DM risk decreased significantly as MMI quartiles increased; however, in women, MMI did not impact the presence of DM despite the risk of DM was increased in 50 to 69-year-old women with Q3 versus Q1 of MMI. Since MMI had a significant negative association with DM in univariate analysis in all age groups of women and the amount of muscle mass is a well-known protective factor for glucose intolerance, the significant increase in DM in 50 to 69-year-old women with MMI Q3 versus Q1 was unexpected. The reason for this finding remains unclear and there are no biological explanations for this finding. Therefore, we thought that it might be the incidental finding with a trivial clinical meaning. Similar to our study results, Kim et al. [34] reported that a high ASM significantly decreased the risk of incident DM regardless of obesity status in men but was not protective in women. Tatsukawa et al. [35] also reported that percentage of trunk fat was positively associated with the development of DM in both men and women, whereas appendicular lean mass was negatively associated with DM risk only in normal-weight men.
- Although we were unable to clarify the underlying mechanism of these sex-based differences in this study, the difference could arise from the differential influence of sex hormones on the shifting of body composition in men and women. In men, a decline in the circulating level of testosterone according to age deteriorates muscle mass and function, consequently leading to visceral obesity [36], whereas in postmenopausal women, the lack of estrogen leads directly to visceral fat accumulation [37]. In the present study, BMI, not FMI, was an important determinant for DM in women younger than 50 years of age; however, FMI was a significant independent risk factor for DM in women over 50 years old. When we further divided women according to menopause to exam the effects of estrogen, there was a statistically significant association between FMI quartiles and DM only in postmenopausal women (P= 0.004) but not in premenopausal women (P=0.213). In contrast, BMI was significantly associated with DM in premenopausal women (P=0.015) but not in postmenopausal women (P=0.063). These results suggested the greater importance of body fat distribution on the incidence of DM especially in postmenopausal women, whereas the imbalance between visceral and lower extremity subcutaneous fat was less critical for DM in premenopausal women. Similar to these results, we previously published that waist-to-hip ratio (WHR), a representative simple indicator for body fat distribution, had a superior predictive value for subclinical atherosclerosis compared to BMI in postmenopausal women, whereas WHR and BMI showed a same power to predict subclinical atherosclerosis in premenopausal women [38]. Nevertheless, we must consider the possibility that the lack of statistical significance in the association between FMI quartiles and DM for women aged 30 to 49 years might have been influenced by the low incidence of DM in this age group. In this study, 30 to 49-year-old women in the highest quartile of FMI showed higher risk of DM compared to those in the lowest quartile of FMI, although there was no grossly significant difference in the risk of DM across FMI quartiles. To clarify the association between abdominal fat accumulation and development of DM in this age women, a larger scaled cohort study should be followed.
- This study has several limitations. First, we could not adjust for individual family history of DM due to lack of information. The health interview survey in the KNHANES IV (2008 and 2009) did not include this information. However, the impact of a family history of DM on type 2 DM is stronger in young adults and mediates changes in metabolic traits [39]; thus, it is unlikely to have affected our study results that the impacts of metabolic parameters are important determinants for DM in young age groups in both sexes. Second, each KNHANES was conducted with different subjects and since they were based on self-administered questionnaires, the potential for recall bias, residual or unmeasured confounding factors, and unintentional errors should be considered. Third, despite the potential impacts of anti-hypertensive agents and lipid-lowering agents on the development of DM, we could not adjust the medication history of these drugs as covariates duet to high prevalence of both hypertension and hyperlipidemia in patients with DM. Moreover, the prescription rate of those medications is naturally high in the elderly, which can mask the significant association between body composition and DM in older people. Furthermore, KNHANES does not have data on the specific drug classes or types, duration of treatment and the drug doses; we are not able analyze accurately the effects of anti-hypertensive and lipid-lowering agents on the development of DM. Fourth, due to the cross-sectional nature of the study, we could not investigate causal relationships or their underlying mechanism. Finally, because of ethnic differences in body fat distridistribution and lean mass volume [40], further study is needed to investigate whether age-related impacts of body composition on DM have similar tendencies in other ethnic groups. Despite the limitations in the study design and data, the strength of our study was the assessment of the association between the DXA scan-measured muscle and fat mass and DM in a nationally representative sample.
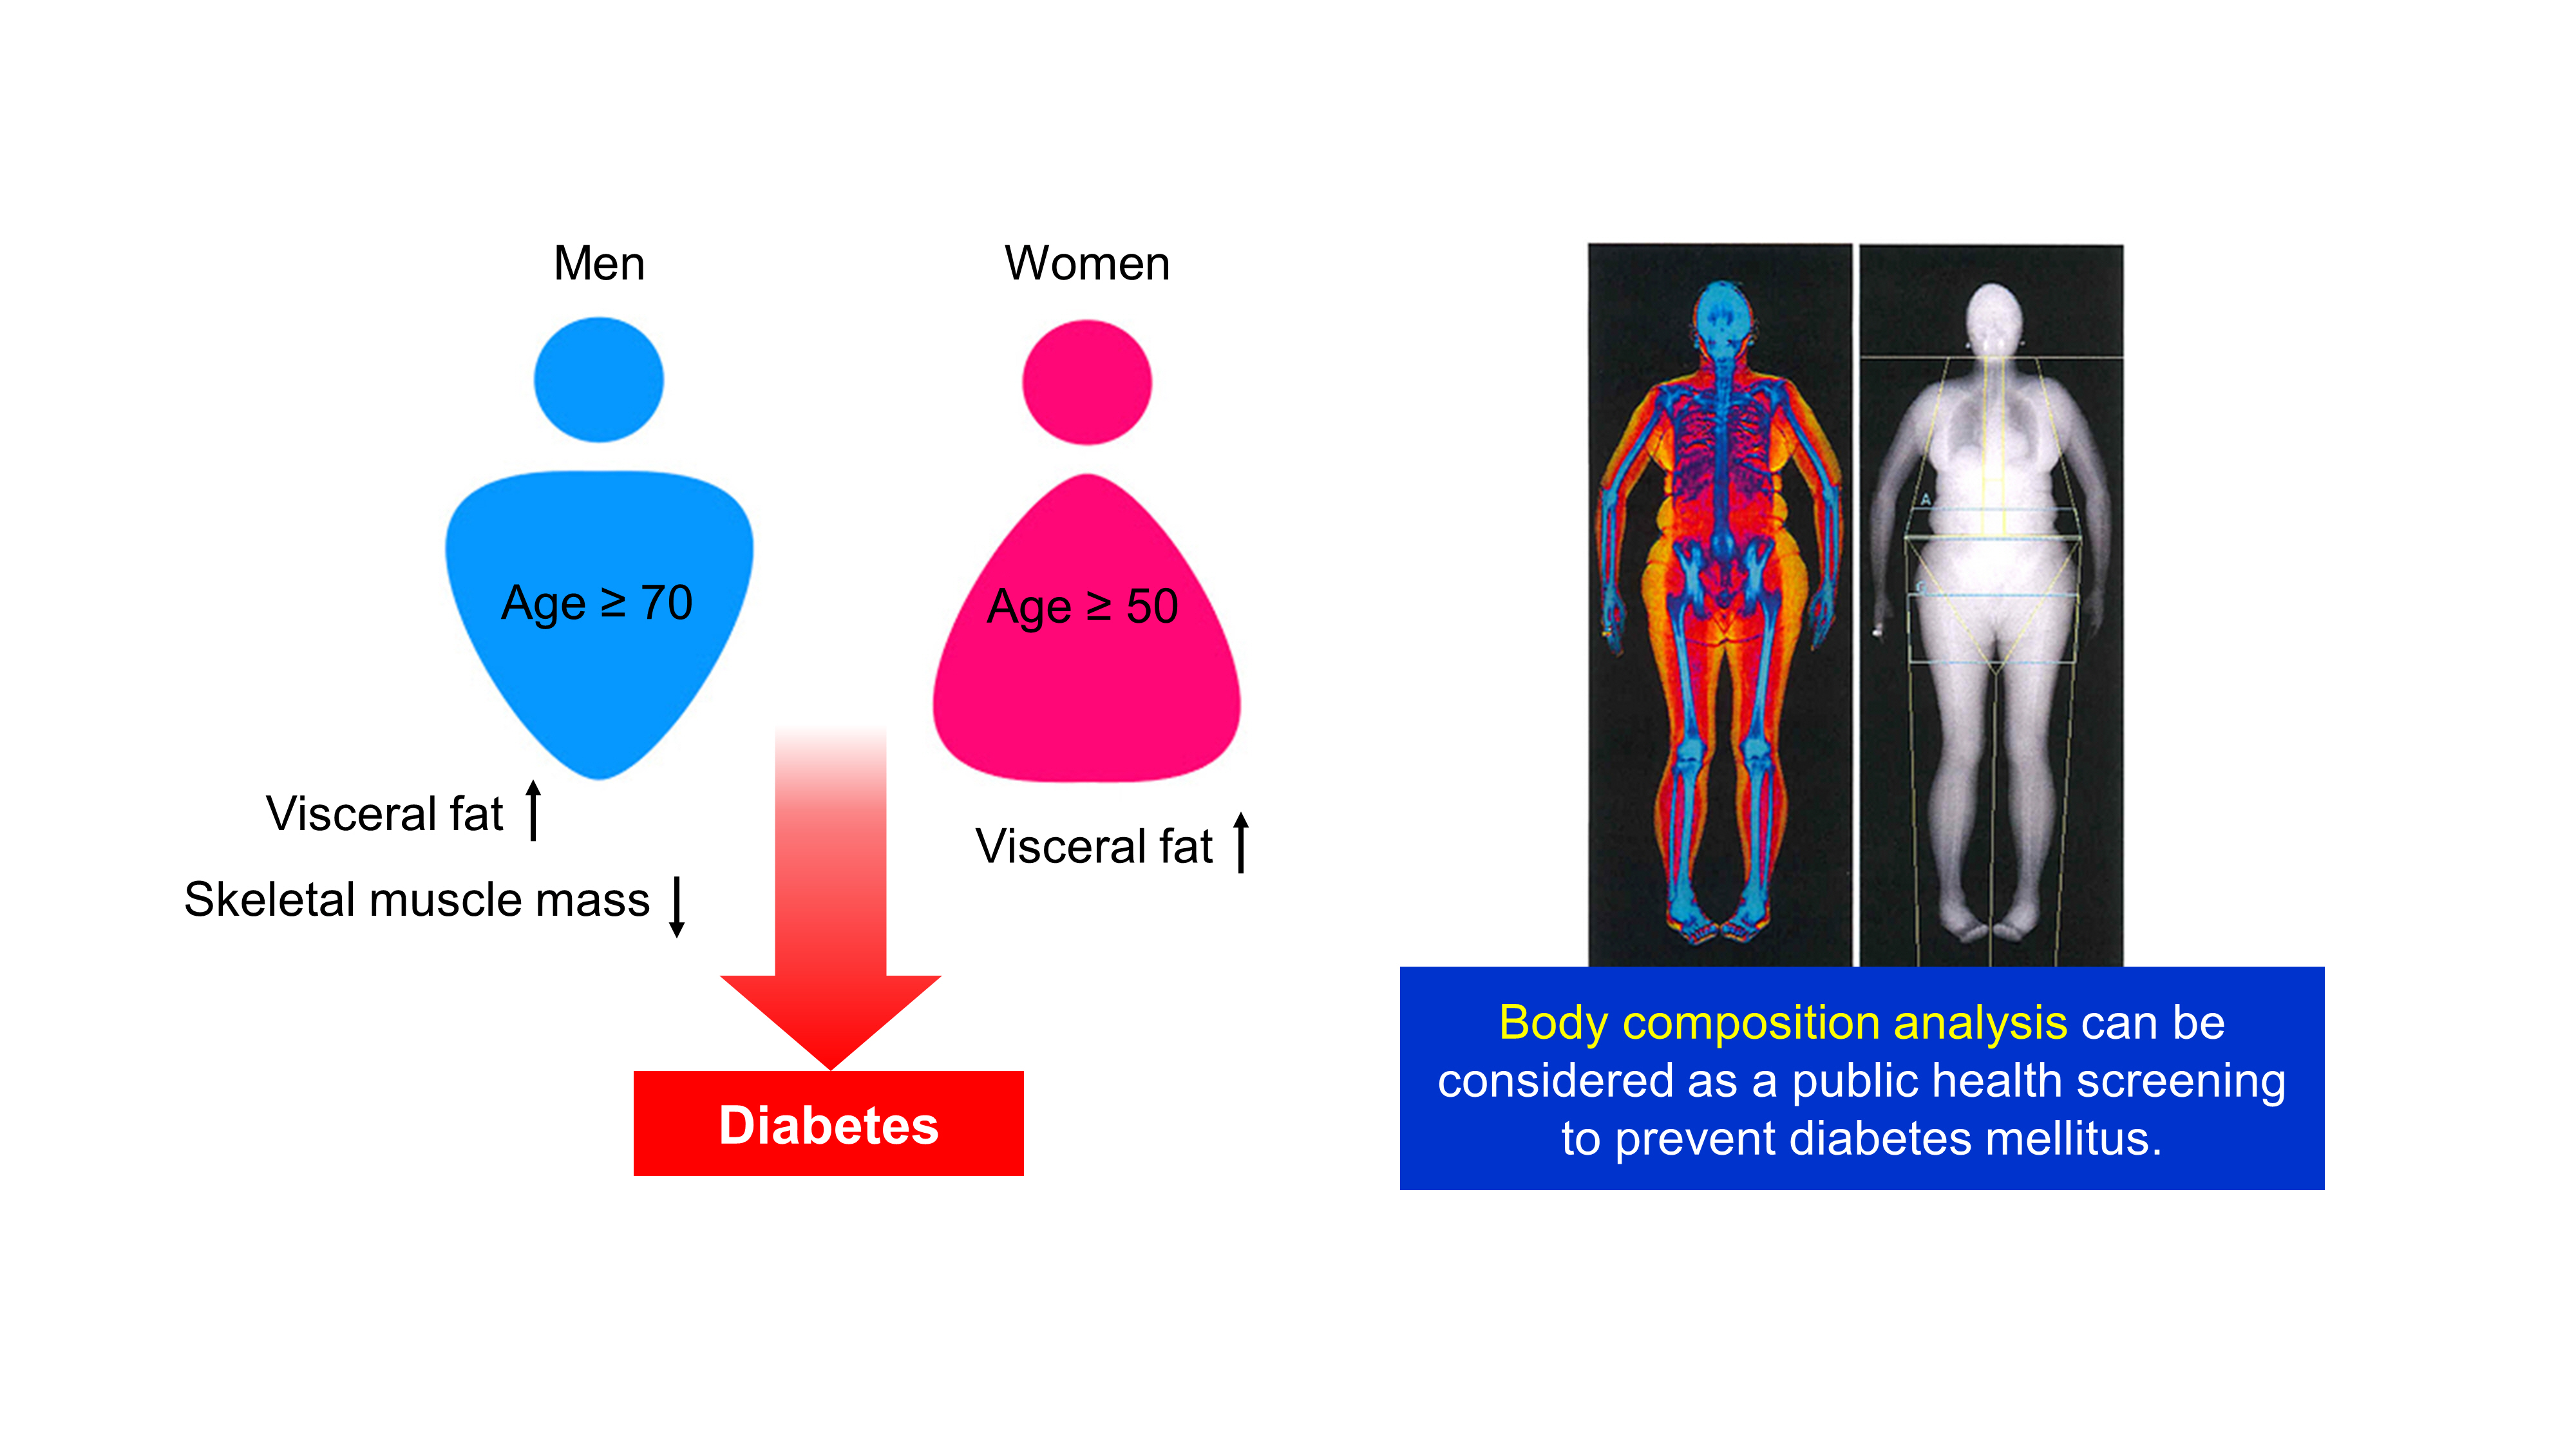
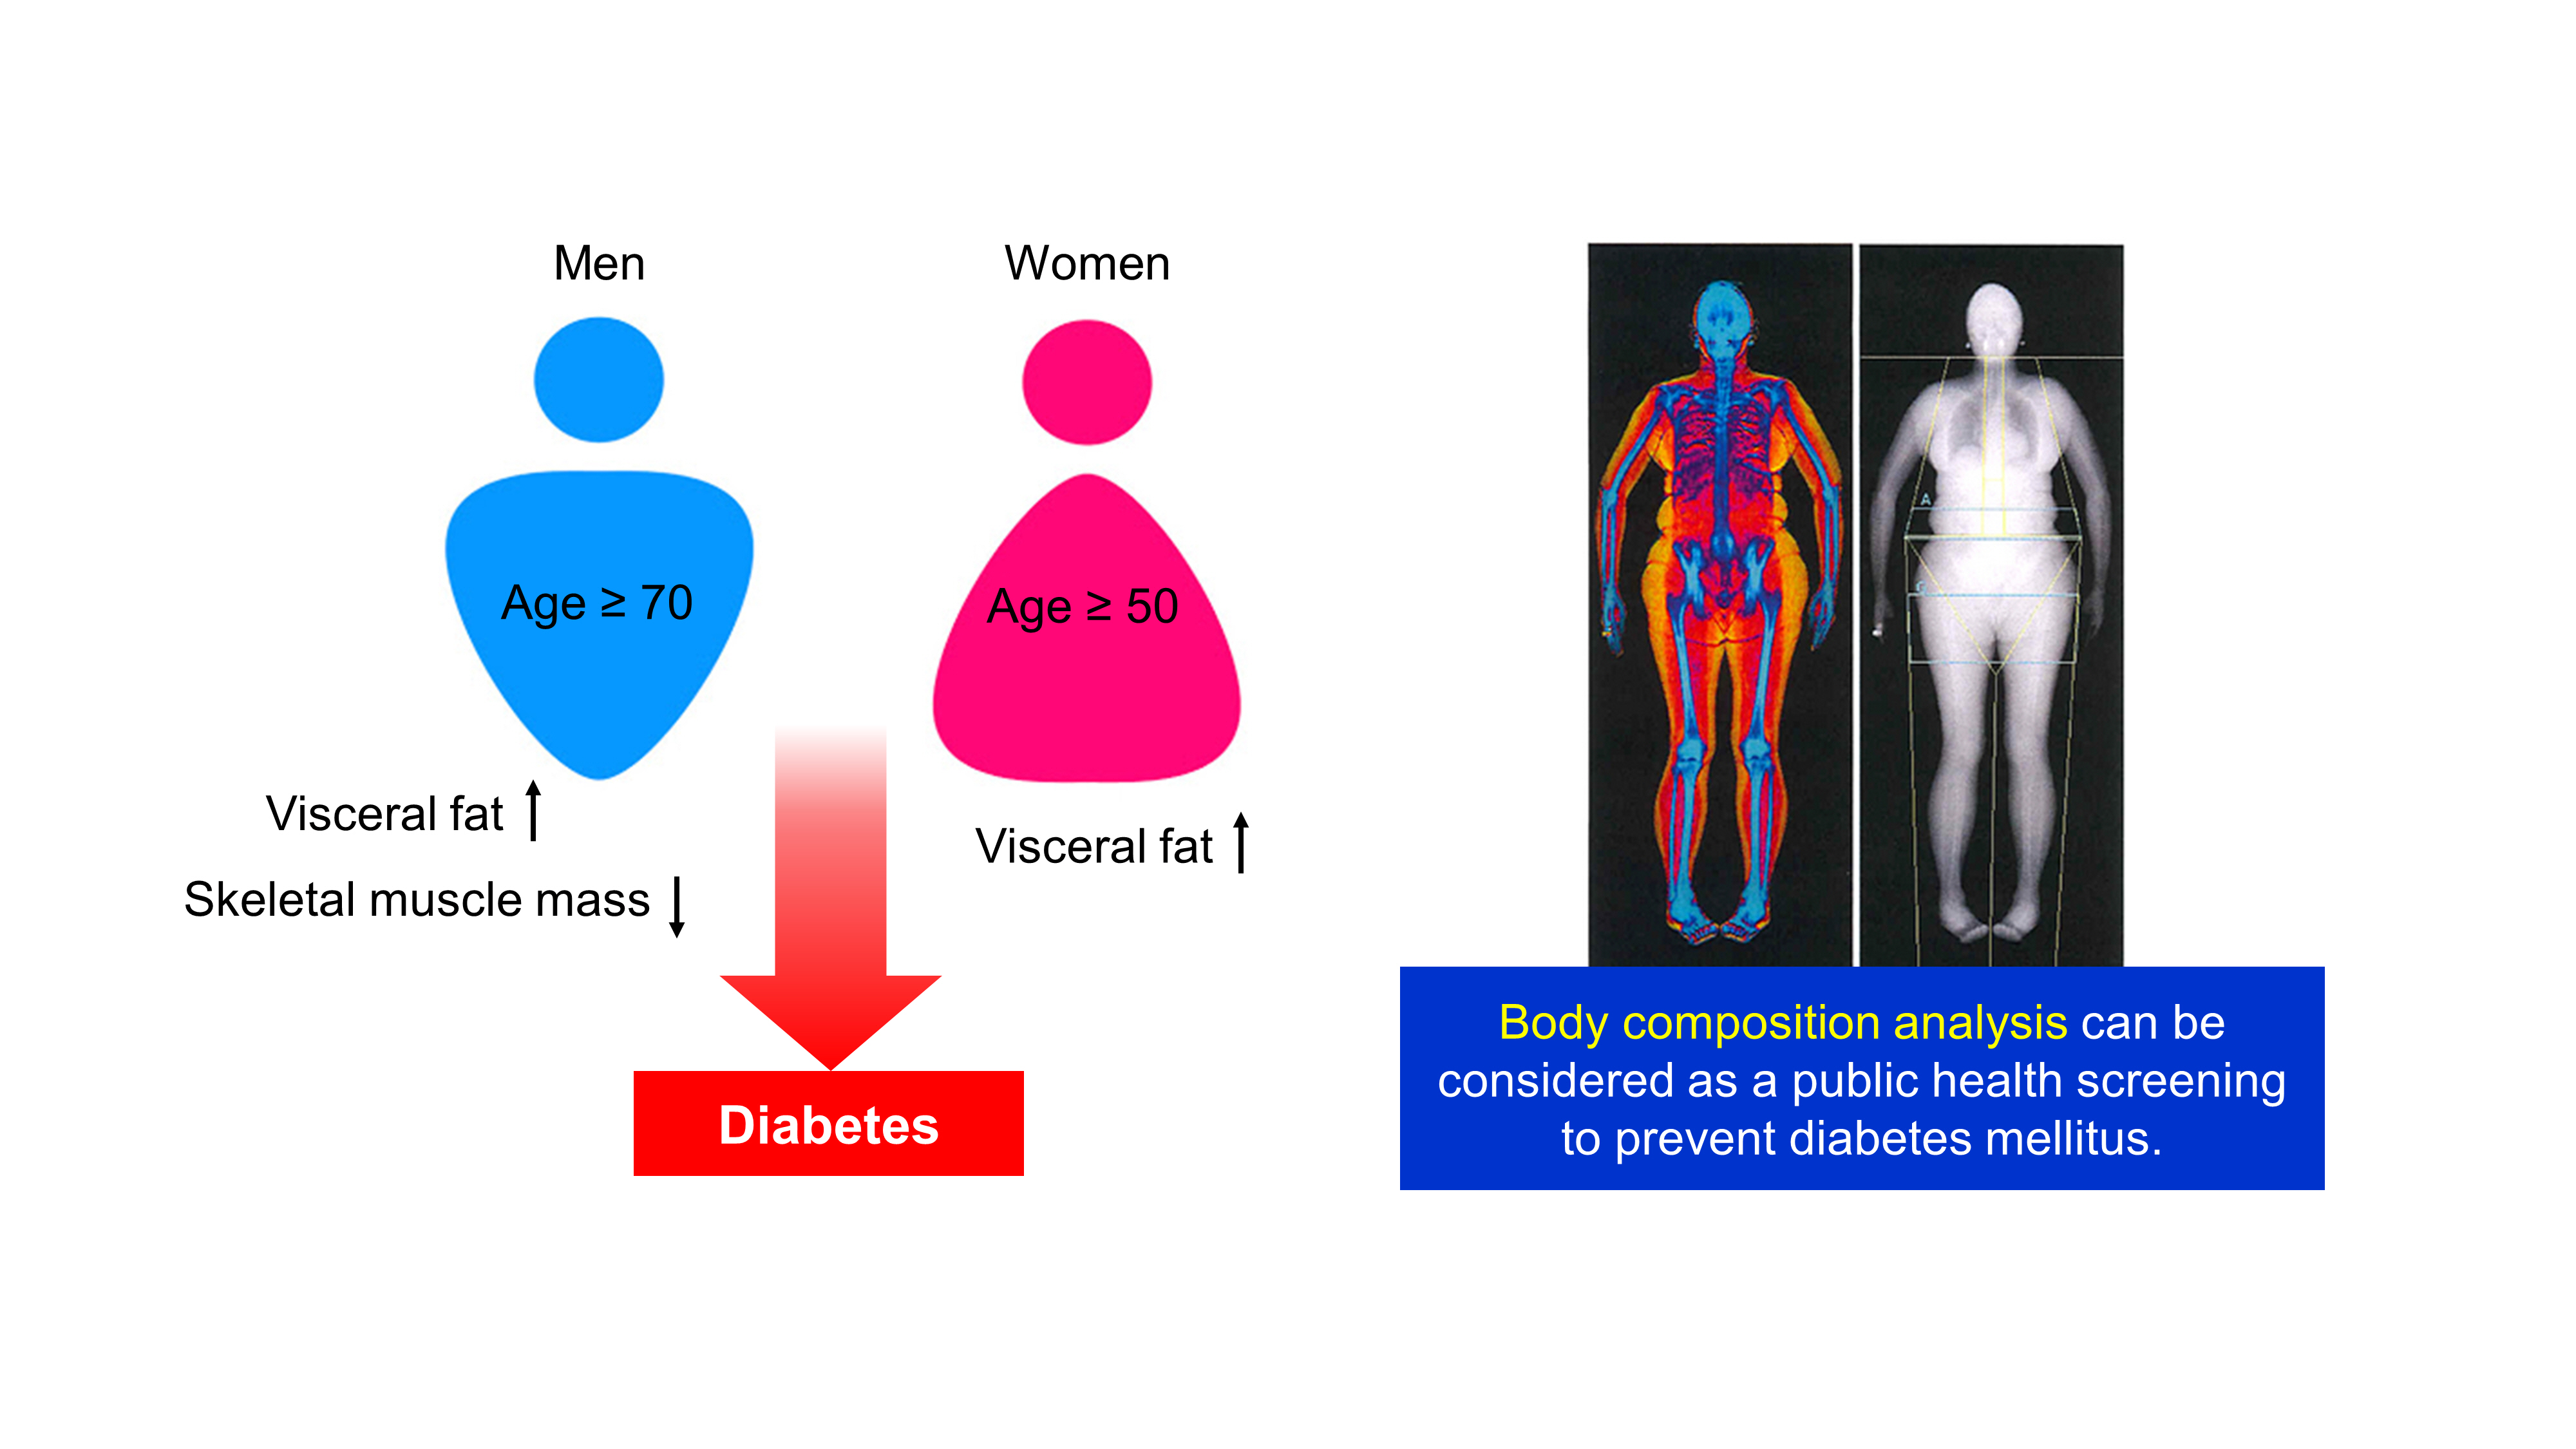
- By assessing the nationwide survey data representing the Korean population, we found the clinical significance of muscle mass and fat mass with DM, especially in older adults. After adjusting for multiple metabolic parameters, both FMI and MMI remained independent risk factors for DM in men aged 70 years or more. In women over 50 years, FMI, not MMI, was independently associated with DM. Therefore, different body composition according to sex; that is, abdominal fat and muscle mass in elderly men ≥70 years old and abdominal fat in women ≥50 years old, should be included as a public health screening tool and preventive target for DM.
DISCUSSION
SUPPLEMENTARY MATERIALS
Supplementary Table 1
-
CONFLICTS OF INTEREST
No potential conflict of interest relevant to this article was reported.
-
AUTHOR CONTRIBUTIONS
Conception or design: E.R., J.A.K., Y.B.L., S.H., H.J.Y.
Acquisition, analysis, or interpretation of data: E.R., S.Y.H., H.J.Y.
Drafting the work or revising: E.R., N.H.K., J.A.S., S.G.K., N.H.K., K.M.C., S.H.B., H.J.Y.
Final approval of the manuscript: E.R., S.Y.H., J.A.K., Y.B.L., S.H., N.H.K., J.A.S., S.G.K., N.H.K., K.M.C., S.H.B., H.J.Y.
-
FUNDING
None
NOTES
-
Acknowledgements
- The authors would like to thank all subjects and researchers who participate in KNHANES IV and V.
- This work was supported by Basic Science Research Program through the National Research Foundation of Korea (NRF) funded by the Ministry of Education (Grant No. 2018R1D1A1B07047587 and 2018R1D1A1B07050991). The funders had no role in the study design, data collection, analysis, and interpretation, decision to publish, or preparation of the manuscript.
ACKNOWLEDGMENTS
- 1. Baumgartner RN, Stauber PM, McHugh D, Koehler KM, Garry PJ. Cross-sectional age differences in body composition in persons 60+ years of age. J Gerontol A Biol Sci Med Sci 1995;50:M307-M316.ArticlePubMedPDF
- 2. Kyle UG, Genton L, Hans D, Karsegard L, Slosman DO, Pichard C. Age-related differences in fat-free mass, skeletal muscle, body cell mass and fat mass between 18 and 94 years. Eur J Clin Nutr 2001;55:663-672.ArticlePubMedPDF
- 3. Yamada M, Moriguch Y, Mitani T, Aoyama T, Arai H. Age-dependent changes in skeletal muscle mass and visceral fat area in Japanese adults from 40 to 79 years-of-age. Geriatr Gerontol Int 2014;14 Suppl 1:8-14.PubMed
- 4. Gastaldelli A, Miyazaki Y, Pettiti M, Matsuda M, Mahankali S, Santini E, et al. Metabolic effects of visceral fat accumulation in type 2 diabetes. J Clin Endocrinol Metab 2002;87:5098-5103.ArticlePubMed
- 5. Yatagai T, Nagasaka S, Taniguchi A, Fukushima M, Nakamura T, Kuroe A, et al. Hypoadiponectinemia is associated with visceral fat accumulation and insulin resistance in Japanese men with type 2 diabetes mellitus. Metabolism 2003;52:1274-1278.ArticlePubMed
- 6. Fontana L, Eagon JC, Trujillo ME, Scherer PE, Klein S. Visceral fat adipokine secretion is associated with systemic inflammation in obese humans. Diabetes 2007;56:1010-1013.ArticlePubMedPDF
- 7. Gabriely I, Ma XH, Yang XM, Atzmon G, Rajala MW, Berg AH, et al. Removal of visceral fat prevents insulin resistance and glucose intolerance of aging: an adipokine-mediated process? Diabetes 2002;51:2951-2958.PubMed
- 8. Srikanthan P, Hevener AL, Karlamangla AS. Sarcopenia exacerbates obesity-associated insulin resistance and dysglycemia: findings from the National Health and Nutrition Examination Survey III. PLoS One 2010;5:e10805.ArticlePubMedPMC
- 9. Srikanthan P, Karlamangla AS. Relative muscle mass is inversely associated with insulin resistance and prediabetes. Findings from the third National Health and Nutrition Examination Survey. J Clin Endocrinol Metab 2011;96:2898-2903.ArticlePubMed
- 10. Son JW, Lee SS, Kim SR, Yoo SJ, Cha BY, Son HY, et al. Low muscle mass and risk of type 2 diabetes in middle-aged and older adults: findings from the KoGES. Diabetologia 2017;60:865-872.ArticlePubMedPDF
- 11. Janssen I, Heymsfield SB, Wang ZM, Ross R. Skeletal muscle mass and distribution in 468 men and women aged 18–88 yr. J Appl Physiol (1985) 2000;89:81-88.ArticlePubMed
- 12. Fantin F, Di Francesco V, Fontana G, Zivelonghi A, Bissoli L, Zoico E, et al. Longitudinal body composition changes in old men and women: interrelationships with worsening disability. J Gerontol A Biol Sci Med Sci 2007;62:1375-1381.ArticlePubMedPDF
- 13. Fan B, Shepherd JA, Levine MA, Steinberg D, Wacker W, Barden HS, et al. National Health and Nutrition Examination Survey whole-body dual-energy X-ray absorptiometry reference data for GE Lunar systems. J Clin Densitom 2014;17:344-377.ArticlePubMed
- 14. Hong S, Oh HJ, Choi H, Kim JG, Lim SK, Kim EK, et al. Characteristics of body fat, body fat percentage and other body composition for Koreans from KNHANES IV. J Korean Med Sci 2011;26:1599-1605.ArticlePubMedPMCPDF
- 15. Carr MC. The emergence of the metabolic syndrome with menopause. J Clin Endocrinol Metab 2003;88:2404-2411.ArticlePubMed
- 16. Auro K, Joensuu A, Fischer K, Kettunen J, Salo P, Mattsson H, et al. A metabolic view on menopause and ageing. Nat Commun 2014;5:4708.ArticlePubMedPDF
- 17. Lim S, Meigs JB. Ectopic fat and cardiometabolic and vascular risk. Int J Cardiol 2013;169:166-176.ArticlePubMed
- 18. Friedewald WT, Levy RI, Fredrickson DS. Estimation of the concentration of low-density lipoprotein cholesterol in plasma, without use of the preparative ultracentrifuge. Clin Chem 1972;18:499-502.ArticlePubMedPDF
- 19. Cawthon PM, Peters KW, Shardell MD, McLean RR, Dam TT, Kenny AM, et al. Cutpoints for low appendicular lean mass that identify older adults with clinically significant weakness. J Gerontol A Biol Sci Med Sci 2014;69:567-575.ArticlePubMedPMCPDF
- 20. American Diabetes Association. 15. Diabetes care in the hospital: standards of medical care in diabetes-2019. Diabetes Care 2019;42(Suppl 1):S173-S181.ArticlePubMedPDF
- 21. Goodpaster BH, Krishnaswami S, Harris TB, Katsiaras A, Kritchevsky SB, Simonsick EM, et al. Obesity, regional body fat distribution, and the metabolic syndrome in older men and women. Arch Intern Med 2005;165:777-783.ArticlePubMed
- 22. Goodpaster BH, Krishnaswami S, Resnick H, Kelley DE, Haggerty C, Harris TB, et al. Association between regional adipose tissue distribution and both type 2 diabetes and impaired glucose tolerance in elderly men and women. Diabetes Care 2003;26:372-379.ArticlePubMedPDF
- 23. Snijder MB, Dekker JM, Visser M, Bouter LM, Stehouwer CD, Yudkin JS, et al. Hoorn study. Trunk fat and leg fat have independent and opposite associations with fasting and postload glucose levels: the Hoorn study. Diabetes Care 2004;27:372-377.PubMed
- 24. Van Pelt RE, Evans EM, Schechtman KB, Ehsani AA, Kohrt WM. Contributions of total and regional fat mass to risk for cardiovascular disease in older women. Am J Physiol Endocrinol Metab 2002;282:E1023-E1028.ArticlePubMed
- 25. Tanko LB, Bagger YZ, Alexandersen P, Larsen PJ, Christiansen C. Peripheral adiposity exhibits an independent dominant antiatherogenic effect in elderly women. Circulation 2003;107:1626-1631.ArticlePubMed
- 26. Arner P. Insulin resistance in type 2 diabetes: role of fatty acids. Diabetes Metab Res Rev 2002;18 Suppl 2:S5-S9.ArticlePubMed
- 27. Bjorntorp P. Metabolic implications of body fat distribution. Diabetes Care 1991;14:1132-1143.ArticlePubMedPDF
- 28. Frayn KN. Adipose tissue as a buffer for daily lipid flux. Diabetologia 2002;45:1201-1210.ArticlePubMedPDF
- 29. Arner P. Differences in lipolysis between human subcutaneous and omental adipose tissues. Ann Med 1995;27:435-438.ArticlePubMed
- 30. Choi SI, Chung D, Lim JS, Lee MY, Shin JY, Chung CH, et al. Relationship between regional body fat distribution and diabetes mellitus: 2008 to 2010 Korean National Health and Nutrition Examination Surveys. Diabetes Metab J 2017;41:51-59.ArticlePubMedPDF
- 31. DeFronzo RA. Pathogenesis of type 2 diabetes mellitus. Med Clin North Am 2004;88:787-835.ArticlePubMed
- 32. Abdul-Ghani MA, DeFronzo RA. Pathogenesis of insulin resistance in skeletal muscle. J Biomed Biotechnol 2010;2010:476279.ArticlePubMedPMCPDF
- 33. Hong S, Chang Y, Jung HS, Yun KE, Shin H, Ryu S. Relative muscle mass and the risk of incident type 2 diabetes: a cohort study. PLoS One 2017;12:e0188650.ArticlePubMedPMC
- 34. Kim HK, Lee MJ, Kim EH, Bae SJ, Choe J, Kim CH, et al. Longitudinal changes of body composition phenotypes and their association with incident type 2 diabetes mellitus during a 5-year follow-up in Koreans. Diabetes Metab J 2019;43:627-639.ArticlePubMedPMCPDF
- 35. Tatsukawa Y, Misumi M, Kim YM, Yamada M, Ohishi W, Fujiwara S, et al. Body composition and development of diabetes: a 15-year follow-up study in a Japanese population. Eur J Clin Nutr 2018;72:374-380.ArticlePubMedPDF
- 36. Saad F, Rohrig G, von Haehling S, Traish A. Testosterone deficiency and testosterone treatment in older men. Gerontology 2017;63:144-156.ArticlePubMedPDF
- 37. O'Reilly MW, House PJ, Tomlinson JW. Understanding androgen action in adipose tissue. J Steroid Biochem Mol Biol 2014;143:277-284.ArticlePubMed
- 38. Lee HJ, Hwang SY, Hong HC, Ryu JY, Seo JA, Kim SG, et al. Waist-to-hip ratio is better at predicting subclinical atherosclerosis than body mass index and waist circumference in postmenopausal women. Maturitas 2015;80:323-328.ArticlePubMed
- 39. Moon JH, Roh E, Oh TJ, Kim KM, Moon JH, Lim S, et al. Increased risk of metabolic disorders in healthy young adults with family history of diabetes: from the Korea National Health and Nutrition Survey. Diabetol Metab Syndr 2017;9:16.ArticlePubMedPMCPDF
- 40. Lear SA, Kohli S, Bondy GP, Tchernof A, Sniderman AD. Ethnic variation in fat and lean body mass and the association with insulin resistance. J Clin Endocrinol Metab 2009;94:4696-4702.ArticlePubMedPDF
REFERENCES
Flowchart of the study population. KNHANES, Korean National Health and Nutrition Examination Survey; DXA, dual-energy X-ray absorptiometry; BMI, body mass index.
Age and body mass index, adjusted odds ratio (ORs) (95% confidence intervals [CIs]) for diabetes mellitus by quartiles of (A) fat mass index (FMI) and (B) muscle mass index (MMI) stratified by age groups (30 to 49, 50 to 69, and ≥70 years) in men and women.

| Variable |
Men |
Women |
||||||||||
|---|---|---|---|---|---|---|---|---|---|---|---|---|
|
30–49 yr |
50–69 yr |
≥70 yr |
30–49 yr |
50–69 yr |
≥70 yr |
|||||||
| No DM | DM | No DM | DM | No DM | DM | No DM | DM | No DM | DM | No DM | DM | |
| Number | 2,896 | 152 | 2,209 | 497 | 793 | 180 | 3,950 | 99 | 3,079 | 437 | 1,038 | 256 |
| Age, yr | 39.3±0.16 | 42.9±0.45c | 57.5±0.14 | 58.5±0.28b | 74.9±0.17 | 74.6±0.42 | 57.8±0.18 | 65.8±1.10c | 58.2±0.17 | 60.9±0.52c | 52.8±0.36 | 57.4±0.66c |
| WC, cm | 84.1±0.21 | 88.1±0.84c | 85.1±0.22 | 88.7±0.45c | 83.5±0.42 | 88.0±0.78c | 76.1±0.20 | 87.1±1.17c | 81.6±0.22 | 87.2±0.56c | 81.8±0.37 | 87.1±0.76c |
| BMI, kg/m2 | 24.3±0.07 | 25.6±0.33b | 23.9±0.07 | 24.9±0.18c | 22.7±0.13 | 23.9±0.27c | 22.9±0.07 | 26.5±0.41c | 24.2±0.06 | 25.5±0.19c | 23.6±0.13 | 25.2±0.25c |
| Trunk fat mass, kg | 16.0±0.13 | 17.6±0.52b | 14.8±0.14 | 16.0±0.28c | 13.9±0.23 | 16.4±0.45c | 18.7±0.12 | 23.0±0.76c | 20.0±0.12 | 21.2±0.29b | 17.9±0.24 | 20.4±0.44c |
| FMI, m2 | 0.35±0.003 | 0.39±0.01c | 0.34±0.003 | 0.37±0.005c | 0.33±0.005 | 0.39±0.009c | 0.39±0.002 | 0.48±0.013c | 0.43±0.003 | 0.47±0.005c | 0.40±0.004 | 0.46±0.008c |
| ASM, kg | 23.3±0.07 | 23.5±0.36 | 21.5±0.08 | 21.5±0.17 | 19.1±0.12 | 18.8±0.21 | 14.8±0.05 | 16.1±0.26c | 14.4±0.05 | 14.7±0.13b | 13.1±0.07 | 13.5±0.15b |
| MMI, m2 | 0.96±0.003 | 0.93±0.012b | 0.90±0.003 | 0.87±0.005c | 0.85±0.004 | 0.79±0.008c | 0.65±0.002 | 0.61±0.009c | 0.60±0.002 | 0.58±0.004c | 0.56±0.003 | 0.54±0.006b |
| SBP, mm Hg | 115.2±0.33 | 121.4±1.27c | 122.9±0.48 | 125.8±1.05a | 128.4±0.77 | 129.0±1.49 | 108.2±0.26 | 117.0±1.56c | 122.7±0.42 | 129.5±0.94c | 132.1±0.70 | 135.6±1.25a |
| DBP, mm Hg | 78.2±0.27 | 82.8±0.91c | 79.4±0.32 | 78.0±0.55a | 73.7±0.43 | 71.6±0.83a | 71.2±0.20 | 75.9±0.97c | 77.2±0.24 | 77.0±0.51 | 74.8±0.36 | 74.0±0.77 |
| Fasting glucose, mg/dL | 93.7±0.21 | 167.8±5.59c | 97.0±0.25 | 144.9±2.37c | 96.1±0.45 | 136.0±3.73c | 90.7±0.16 | 164.7±6.33c | 94.4±0.2 | 141.1±2.26c | 95.7±0.40 | 140.3±3.33c |
| TC, mg/dL | 192.4±0.73 | 196.3±3.76 | 190.7±0.89 | 180.0±2.16c | 180.2±1.34 | 181.3±3.72 | 180.9±0.62 | 195.7±4.82b | 202.3±0.86 | 195.6±2.30b | 200.0±1.31 | 198.3±2.94 |
| LDL-C, mg/dL | 115.9±0.65 | 110.6±3.44 | 114.7±0.86 | 101.1±1.87c | 109.2±1.24 | 109.6±3.40 | 109.7±0.55 | 116.0±4.54 | 126.8±0.73 | 117.2±2.12c | 125.7±1.17 | 120.4±2.53 |
| HDL-C, mg/dL | 45.8±0.25 | 43.3±0.98a | 45.8±0.30 | 42.4±0.56c | 45.6±0.49 | 42.0±0.94b | 51.8±0.21 | 47.0±0.99c | 49.9±0.27 | 46.1±0.69c | 46.2±0.41 | 44.9±0.81 |
| TG, mg/dL | 168.7±3.22 | 241.7±21.43b | 163.9±3.73 | 203.6±8.41c | 129.5±3.33 | 149.9±7.38a | 98.7±1.32 | 175.2±15.1c | 130.4±2.02 | 165.3±5.17c | 141.3±2.96 | 167.0±6.56b |
| AST, IU/L | 24.7±0.33 | 30.9±1.86b | 26.2±0.38 | 28.0±0.93 | 24.8±0.52 | 26.1±1.62 | 18.4±0.12 | 25.8±2.34b | 22.6±0.20 | 24.5±0.62b | 22.6±0.27 | 23.8±0.64 |
| ALT, IU/L | 29.4±0.54 | 40.2±2.47c | 25.2±0.40 | 29.5±0.97c | 19.5±0.45 | 23.9±1.28b | 15.8±0.20 | 29.7±4.00b | 20.3±0.30 | 25.5±0.86c | 17.0±0.30 | 21.1±0.76c |
| Low income | 695 (25.1) | 43 (33.3)a | 506 (23.1) | 139 (32.3)b | 184 (23.4) | 42 (22.8) | 982 (27) | 35 (41.2)b | 734 (24.7) | 110 (24.9) | 271 (26.3) | 52 (21.9) |
| Current smoker | 1,534 (54.1) | 85 (56.8) | 805 (38.6) | 177 (40.3) | 193 (24.6) | 41 (24.3) | 232 (6.6) | 3 (2.5) | 111 (4.1) | 14 (1.9)a | 65 (7.3) | 16 (7.7) |
| Drinking | 2,322 (80.1) | 117 (78.5) | 1,605 (74.2) | 347 (72.4) | 438 (56.5) | 90 (51.2) | 1,934 (49.2) | 46 (48) | 903 (31.8) | 93 (24.2)a | 168 (16.1) | 37 (16) |
| Regular exercise | 554 (19.6) | 35 (22.2) | 439 (20.9) | 88 (19.2) | 88 (11.1) | 20 (9.7) | 584 (15.2) | 13 (12.4) | 451 (15.1) | 44 (12.6) | 82 (7.7) | 22 (8.3) |
Values are presented as mean±standard error or number (%).
DM, diabetes mellitus; WC, waist circumference; BMI, body mass index; FMI, fat mass index; ASM, appendicular skeletal muscle; MMI, muscle mass index; SBP, systolic blood pressure; DBP, diastolic blood pressure; TC, total cholesterol; LDL-C, low-density lipoprotein cholesterol; HDL-C, high-density lipoprotein cholesterol; TG, triglyceride; AST, aspartate aminotransferase; ALT, alanine aminotransferase.
a P<0.05,
b P<0.01,
c P<0.001 in t-test for continuous variables and chi-square test for categorical variables comparing non-diabetics with subjects with diabetes mellitus.
| Variable |
30–49 yr |
50–69 yr |
≥70 yr |
|||||||||
|---|---|---|---|---|---|---|---|---|---|---|---|---|
| Univariate | P value | Multivariate | P value | Univariate | P value | Multivariate | P value | Univariate | P value | Multivariate | P value | |
| Age, yr | 1.128 (1.09–1.168) | <0.001a | 1.123 (1.081–1.166) | <0.001a | 1.032 (1.014–1.051) | 0.001a | 1.007 (0.985–1.03) | 0.517 | 0.979 (0.925–1.037) | 0.473 | ||
| BMI, kg/m2 | 1.126 (1.064–1.192) | <0.001a | 1.049 (0.963–1.142) | 0.27 | 1.134 (1.085–1.186) | <0.001a | 1.094 (1.029–1.163) | 0.004a | 1.157 (1.085–1.234) | <0.001a | 1.03 (0.946–1.121) | 0.497 |
| FMI, m2 | 0.001a | 0.208 | <0.001a | 0.202 | <0.001a | 0.049a | ||||||
| Q1 | 1 | 1 | 1 | 1 | 1 | |||||||
| Q2 | 2.156 (1.135–4.099) | 0.019 | 1.436 (0.738–2.797) | 0.286 | 1.314 (0.911–1.895) | 0.144 | 0.987 (0.655–1.489) | 0.951 | 3.27 (1.693–6.318) | 0.001 | 2.216 (1.098–4.47) | 0.026 |
| Q3 | 2.086 (1.069–4.07) | 0.031 | 1.298 (0.643–2.623) | 0.466 | 1.52 (1.059–2.181) | 0.023 | 1.007 (0.651–1.56) | 0.973 | 3.876 (1.972–7.62) | <0.001 | 2.297 (1.062–4.965) | 0.035 |
| Q4 | 3.358 (1.818–6.206) | 0.001 | 1.993 (0.978–4.062) | 0.058 | 2.409 (1.721–3.372) | <0.001 | 1.394 (0.863–2.251) | 0.174 | 6.302 (3.234–12.282) | <0.001 | 3.116 (1.405–6.914) | 0.005 |
| MMI, m2 | 0.09 | <0.001a | 0.12 | <0.001a | 0.001a | |||||||
| Q1 | 1 | 1 | 1 | 1 | 1 | |||||||
| Q2 | 0.739 (0.46–1.187) | 0.21 | 0.695 (0.505–0.956) | 0.026 | 0.849 (0.607–1.187) | 0.337 | 0.468 (0.286–0.765) | 0.003 | 0.521 (0.312–0.868) | 0.012 | ||
| Q3 | 0.649 (0.392–1.074) | 0.093 | 0.65 (0.481–0.878) | 0.005 | 0.938 (0.665–1.323) | 0.713 | 0.497 (0.303–0.815) | 0.006 | 0.665 (0.393–1.126) | 0.128 | ||
| Q4 | 0.515 (0.3–0.882) | 0.016 | 0.346 (0.241–0.497) < | 0.001 | 0.621 (0.411–0.937) | 0.024 | 0.162 (0.089–0.294) | <0.001 | 0.295 (0.157–0.554) | 0.001 | ||
| SBP, mm Hg | 1.027 (1.017–1.038) < | 0.001a | 1.007 (0.98–1.034) | 0.63 | 1.01 (1.002–1.017) | 0.009a | 1.032 (1.02–1.044) < | 0.001a | 1.002 (0.992–1.012) | 0.71 | ||
| DBP, mm Hg | 1.036 (1.022–1.05) < | 0.001a | 1.011 (0.976–1.047) | 0.543 | 0.987 (0.976–0.998) | 0.02a | 0.944 (0.927–0.961) < | 0.001a | 0.978 (0.959–0.997) | 0.024a | 0.968 (0.948–0.989) | 0.003a |
| HDL-C, mg/dL | 0.975 (0.953–0.997) | 0.029a | 0.992 (0.969–1.016) | 0.515 | 0.97 (0.958–0.982) < | 0.001a | 0.983 (0.971–0.995) | 0.005a | 0.97 (0.95–0.99) | 0.003a | 0.983 (0.961–1.005) | 0.122 |
| TG, mg/dL | 1.002 (1.001–1.003) < | 0.001a | 1.001 (1–1.002) | 0.026a | 1.002 (1.001–1.002) | 0.001a | 1.001 (1–1.002) | 0.066 | 1.003 (1.001–1.005) | 0.01 | 1 (0.997–1.002) | 0.983 |
| AST, IU/L | 1.009 (1.002–1.016) | 0.016a | 1.005 (1–1.011) | 0.063 | 1.006 (0.999–1.013) | 0.071 | 1.005 (0.995–1.016) | 0.328 | ||||
| ALT, IU/L | 1.006 (0.997–1.015) | 0.191 | 1.014 (1.007–1.02) < | 0.001a | 1.01 (1.003–1.017) | 0.006a | 1.025 (1.011–1.039) | 0.001a | 1.023 (1.009–1.038) | 0.002a | ||
| Low income | 1.491 (1–2.222) | 0.049a | 1.548 (1.022–2.344) | 0.039a | 1.588 (1.195–2.109) | 0.002a | 1.631 (1.209–2.201) | 0.001a | 0.967 (0.629–1.487) | 0.879 | ||
| Current smoking | 1.114 (0.791–1.568) | 0.535 | 1.076 (0.849–1.363) | 0.545 | 0.981 (0.632–1.522) | 0.931 | ||||||
| Drinking | 0.905 (0.573–1.429) | 0.669 | 0.913 (0.713–1.168) | 0.466 | 0.81 (0.56–1.172) | 0.263 | ||||||
| Regular exercise | 1.167 (0.776–1.754) | 0.458 | 0.899 (0.669–1.207) | 0.477 | 0.859 (0.463–1.592) | 0.628 | ||||||
ORs of diabetes mellitus per one-unit increase in age, BMI, SBP, DBP, HDL-C, TG, AST, ALT or one quartile of FMI/MMI or presence of low income, current smoking, drinking, or regular exercise.
OR, odds ratio; CI, confidence interval; BMI, body mass index; FMI, fat mass index; MMI, muscle mass index; SBP, systolic blood pressure; DBP, diastolic blood pressure; HDL-C, high-density lipoprotein cholesterol; TG, triglyceride; AST, aspartate aminotransferase; ALT, alanine aminotransferase.
a Values denote statistical significance at the P<0.05 level.
| Variable |
30–49 yr |
50–69 yr |
≥70 yr |
|||||||||
|---|---|---|---|---|---|---|---|---|---|---|---|---|
| Univariate | P value | Multivariate | P value | Univariate | P value | Multivariate | P value | Univariate | P value | Multivariate | P value | |
| Age, yr | 1.12 (1.072–1.171) | <0.001a | 1.097 (1.044–1.152) | 0.001a | 1.086 (1.066–1.107) | <0.001a | 1.078 (1.054–1.102) | <0.001a | 0.98 (0.946–1.016) | 0.272 | ||
| BMI, kg/m2 | 1.234 (1.177–1.295) | <0.001a | 1.113 (1.03–1.203) | 0.007a | 1.142 (1.1–1.185) | <0.001a | 1.067 (1.011–1.127) | 0.019 | 1.143 (1.09–1.198) | <0.001a | 1.059 (0.991–1.133) | 0.091 |
| FMI, m2 | <0.001a | 0.102 | <0.001a | 0.036a | <0.001a | 0.045a | ||||||
| Q1 | 1 | 1 | 1 | 1 | 1 | 1 | ||||||
| Q2 | 3.053 (0.91–10.248) | 0.071 | 1.498 (0.433–5.185) | 0.523 | 1.827 (1.225–2.725) | 0.003 | 1.41 (0.927–2.146) | 0.108 | 1.57 (0.884–2.79) | 0.124 | 1.248 (0.651–2.396) | 0.504 |
| Q3 | 6.418 (2.158–19.09) | 0.001 | 2.881 (0.917–9.049) | 0.07 | 2.53 (1.71–3.744) | <0.001 | 1.631 (1.064–2.501) | 0.025 | 1.905 (1.097–3.311) | 0.022 | 1.256 (0.649–2.431) | 0.499 |
| Q4 | 14.441 (5.109–40.819) | <0.001 | 3.997 (1.184–13.493) | 0.026 | 3.387 (2.324–4.936) | <0.001 | 1.891 (1.229–2.908) | 0.004 | 3.939 (2.324–6.676) | <0.001 | 2.275 (1.103–4.69) | 0.026 |
| MMI, m2 | 0.002a | 0.956 | 0.003a | 0.16 | 0.004a | 0.119 | ||||||
| Q1 | 1 | 1 | 1 | 1 | 1 | 1 | ||||||
| Q2 | 0.62 (0.344–1.119) | 0.112 | 0.95 (0.507–1.78) | 0.872 | 0.849 (0.617–1.169) | 0.316 | 1.209 (0.836–1.749) | 0.312 | 0.574 (0.35–0.942) | 0.028 | 0.688 (0.407–1.162) | 0.162 |
| Q3 | 0.526 (0.29–0.955) | 0.035 | 1.163 (0.585–2.31) | 0.666 | 0.92 (0.668–1.266) | 0.607 | 1.515 (1.036–2.217) | 0.032 | 0.467 (0.289–0.755) | 0.002 | 0.651 (0.386–1.098) | 0.108 |
| Q4 | 0.259 (0.129–0.521) | 0.001 | 1.048 (0.501–2.192) | 0.902 | 0.497 (0.339–0.731) | 0.001 | 1.146 (0.712–1.843) | 0.575 | 0.517 (0.338–0.793) | 0.003 | 1.09 (0.646–1.838) | 0.747 |
| SBP, mm Hg | 1.035 (1.024–1.046) | <0.001a | 1.024 (0.995–1.053) | 0.105 | 1.021 (1.002–1.005) | <0.001a | 1.012 (1.005–1.019) | 0.001a | 1.011 (1.003–1.02) | 0.009a | 1.011 (1.001–1.021) | 0.031a |
| DBP, mm Hg | 1.043 (1.027–1.057) | <0.001a | 0.973 (0.933–1.015) | 0.2 | 0.997 (0.987–1.008) | 0.615 | 0.991 (0.973–1.01) | 0.347 | ||||
| HDL-C, mg/dL | 0.956 (0.935–0.976) | <0.001a | 0.992 (0.969– 1.016) | 0.52 | 0.968 (0.955–0.981) | <0.001a | 0.986 (0.971– 1.002) | 0.082 | 0.987 (0.971–1.003) | 0.123 | ||
| TG, mg/dL | 1.006 (1.004–1.009) | <0.001a | 1.003 (1.001–1.006) | 0.006a | 1.004 (1.002–1.005) | <0.001a | 1.002 (1–1.003) | 0.015a | 1.003 (1.001–1.005) | 0.001a | 1.002 (1–1.004) | 0.023a |
| AST, IU/L | 1.056 (1.032–1.081) | <0.001a | 1.019 (0.954–1.089) | 0.579 | 1.015 (1.006–1.024) | 0.002a | 0.974 (0.946–1.003) | 0.075 | 1.018 (1–1.037) | 0.046a | 0.958 (0.924–0.992) | 0.017a |
| ALT, IU/L | 1.031 (1.176–3.072) | <0.001a | 1.01 (0.979– 1.042) | 0.538 | 1.019 (1.01–1.029) | <0.001a | 1.029 (1.009–1.05) | 0.005a | 1.041 (1.025–1.057) | <0.001a | 1.061 (1.03–1.092) | <0.001a |
| Low income | 1.901 (0.097–1.379) | 0.009a | 1.604 (0.962– 2.673) | 0.07 | 1.006 (0.753–1.345) | 0.965 | 0.784 (0.549–1.121) | 0.183 | ||||
| Current smoking | 0.366 (0.097–1.379) | 0.137 | 0.465 (0.229–0.946) | 0.035a | 0.492 (0.237.1.02) | 0.057 | 1.058 (0.534–2.097) | 0.87 | ||||
| Drinking | 0.954 (0.592–1.537) | 0.847 | 0.683 (0.51–0.915) | 0.011a | 0.847 (0.612–1.171) | 0.313 | 0.991 (0.619–1.586) | 0.969 | ||||
| Regular exercise | 0.788 (0.39–1.595) | 0.508 | 0.809 (0.538–1.217) | 0.309 | 1.088 (0.589–2.011) | 0.787 | ||||||
ORs of diabetes mellitus per one-unit increase in age, BMI, SBP, DBP, HDL-C, TG, AST, ALT or one quartile of FMI/MMI or presence of low income, current smoking, drinking, or regular exercise.
OR, odds ratio; CI, confidence interval; BMI, body mass index; FMI, fat mass index; MMI, muscle mass index; SBP, systolic blood pressure; DBP, diastolic blood pressure; HDL-C, high-density lipoprotein cholesterol; TG, triglyceride; AST, aspartate aminotransferase; ALT, alanine aminotransferase.
a Values denote statistical significance at the P<0.05 level.
Figure & Data
References
Citations
- Research Progress on Correlation between Body Composition Changes and Disease Pro-gression of Type 2 Diabetes
敏 张
Advances in Clinical Medicine.2024; 14(03): 936. CrossRef - Low Skeletal Muscle Mass Accompanied by Abdominal Obesity Additively Increases the Risk of Incident Type 2 Diabetes
Ji Eun Jun, Seung-Eun Lee, You-Bin Lee, Gyuri Kim, Sang-Man Jin, Jae Hwan Jee, Jae Hyeon Kim
The Journal of Clinical Endocrinology & Metabolism.2023; 108(5): 1173. CrossRef - Is imaging-based muscle quantity associated with risk of diabetes? A meta-analysis of cohort studies
Shanhu Qiu, Xue Cai, Yang Yuan, Bo Xie, Zilin Sun, Tongzhi Wu
Diabetes Research and Clinical Practice.2022; 189: 109939. CrossRef - Whole and segmental body composition changes during mid-follicular and mid-luteal phases of the menstrual cycle in recreationally active young women
Şükran Nazan Koşar, Yasemin Güzel, Mehmet Gören Köse, Ayşe Kin İşler, Tahir Hazır
Annals of Human Biology.2022; 49(2): 124. CrossRef - Body Composition and Diabetes
Hye Jin Yoo
The Journal of Korean Diabetes.2021; 22(4): 238. CrossRef
 PubReader
 ePub Link
 Cite
Cite