- Current
- Browse
- Collections
-
For contributors
- For Authors
- Instructions to authors
- Article processing charge
- e-submission
- For Reviewers
- Instructions for reviewers
- How to become a reviewer
- Best reviewers
- For Readers
- Readership
- Subscription
- Permission guidelines
- About
- Editorial policy
Articles
- Page Path
- HOME > Diabetes Metab J > Volume 42(2); 2018 > Article
-
Original ArticleEpidemiology Clinical Characteristics of People with Newly Diagnosed Type 2 Diabetes between 2015 and 2016: Difference by Age and Body Mass Index
-
Kyoung Hwa Ha1,2, Cheol Young Park3, In Kyung Jeong4, Hyun Jin Kim5, Sang-Yong Kim6, Won Jun Kim7, Ji Sung Yoon8, In Joo Kim9, Dae Jung Kim1,2
 , Sungrae Kim10
 -
Diabetes & Metabolism Journal 2018;42(2):137-146.
DOI: https://doi.org/10.4093/dmj.2018.42.2.137
Published online: February 14, 2018
1Department of Endocrinology and Metabolism, Ajou University School of Medicine, Suwon, Korea.
2Cardiovascular and Metabolic Disease Etiology Research Center, Ajou University School of Medicine, Suwon, Korea.
3Department of Endocrinology and Metabolism, Kangbuk Samsung Hospital, Sungkyunkwan University School of Medicine, Seoul, Korea.
4Department of Endocrinology and Metabolism, Kyung Hee University School of Medicine, Seoul, Korea.
5Department of Internal Medicine, Chungnam National University School of Medicine, Daejeon, Korea.
6Department of Endocrinology and Metabolism, Chosun University Hospital, Chosun University College of Medicine, Gwangju, Korea.
7Department of Endocrinology and Metabolism, Gangneung Asan Hospital, University of Ulsan College of Medicine, Gangneung, Korea.
8Department of Endocrinology and Metabolism, Yeungnam University College of Medicine, Daegu, Korea.
9Department of Endocrinology and Metabolism, Pusan National University Hospital, Pusan National University School of Medicine, Busan, Korea.
10Division of Endocrinology and Metabolism, Department of Internal Medicine, Bucheon St. Mary's Hospital, College of Medicine, The Catholic University of Korea, Bucheon, Korea.
- Corresponding author: Dae Jung Kim. Department of Endocrinology and Metabolism, Ajou University School of Medicine, 164 World cup-ro, Yeongtong-gu, Suwon 16499, Korea. djkim@ajou.ac.kr
- Corresponding author: Sungrae Kim. Division of Endocrinology and Metabolism, Department of Internal Medicine, Bucheon St. Mary's Hospital, College of Medicine, The Catholic University of Korea, 327 Sosa-ro, Wonmi-gu, Bucheon 14647, Korea. kimsungrae@catholic.ac.kr
Copyright © 2018 Korean Diabetes Association
This is an Open Access article distributed under the terms of the Creative Commons Attribution Non-Commercial License (http://creativecommons.org/licenses/by-nc/4.0/) which permits unrestricted non-commercial use, distribution, and reproduction in any medium, provided the original work is properly cited.
ABSTRACT
-
Background
- We evaluated the clinical characteristics of insulin resistance and β-cell dysfunction in newly diagnosed, drug-naive people with type 2 diabetes by analyzing nationwide cross-sectional data.
-
Methods
- We collected the clinical data of 912 participants with newly diagnosed diabetes from 83 primary care clinics and hospitals nationwide from 2015 to 2016. The presence of insulin resistance and β-cell dysfunction was defined as a homeostatic model assessment of insulin resistance (HOMA-IR) value ≥2.5 and fasting C-peptide levels <1.70 ng/mL, respectively.
-
Results
- A total of 75.1% and 22.6% of participants had insulin resistance and β-cell dysfunction, respectively. The proportion of participants with insulin resistance but no β-cell dysfunction increased, and the proportion of participants with β-cell dysfunction but no insulin resistance decreased as body mass index (BMI) increased. People diagnosed with diabetes before 40 years of age had significantly higher HOMA-IR and BMI than those diagnosed over 65 years of age (HOMA-IR, 5.0 vs. 3.0; BMI, 28.7 kg/m2 vs. 25.1 kg/m2). However, the β-cell function indices were lower in people diagnosed before 40 years of age than in those diagnosed after 65 years of age (homeostatic model assessment of β-cell function, 39.3 vs. 64.9; insulinogenic index, 10.3 vs. 18.7; disposition index, 0.15 vs. 0.25).
-
Conclusion
- We observed that the main pathogenic mechanism of type 2 diabetes is insulin resistance in participants with newly diagnosed type 2 diabetes. In addition, young adults with diabetes are more likely to have higher insulin resistance with obesity and have higher insulin secretory defect with severe hyperglycemia in the early period of diabetes than older populations.
- Diabetes mellitus is a common metabolic disorder that causes economic and social burden worldwide. According to the International Diabetes Federation, the number of people with diabetes is expected to increase from 415 million in 2015 to 642 million by 2040. The prevalence of both type 1 diabetes and type 2 diabetes has increased, and the rising number of people with obesity has resulted in an increasing prevalence of type 2 diabetes worldwide [1].
- The pathophysiology of type 2 diabetes is characterized by both impaired insulin action on target tissues and defective pancreatic β-cell insulin secretion in response to glucose [2]. Although both contribute to disease development, the contribution of these factors differs by population. Specifically, type 2 diabetes in East Asia, including South Korea, is characterized primarily by β-cell dysfunction [34567]. However, the prevalence of diabetes has increased in conjunction with the incidence of obesity in South Korea [8], and previous studies have reported that insulin resistance is the dominant factor in the development of type 2 diabetes due to lifestyle changes, including higher dietary intake and decreased physical activity [910].
- Thus, we evaluated the clinical characteristics of insulin resistance and the insulin secretion capacity of newly diagnosed, drug-naive people with type 2 diabetes in 2015 to 2016 by analyzing nationwide cross-sectional data.
INTRODUCTION
- A cross-sectional study that included 83 primary care clinics and hospitals from different areas in South Korea was conducted. All individuals who visited each clinic or hospital from August 2015 to May 2016 and whose type 2 diabetes had been diagnosed within 1 year, based on the 2011 Korean Diabetes Association guidelines, were included [11]. Exclusion criteria were as follows: age <19 years; use of diabetes medication; people with type 1 diabetes or gestational diabetes; who received steroid treatments above control levels; or who had a history of cancer, substance abuse, or alcoholism. A total of 924 participants were enrolled in the study. For accurate observation of clinical characteristics, three participants with missing information on glucose levels and nine abnormal values (outliers) were excluded. The remaining 912 participants (512 men and 400 women) were included in the final analysis. The proportion of participants from clinic and hospital was 82.0% and 18.0%, respectively.
- Trained interviewers collected demographic and clinical characteristics including age, gender, cigarette smoking status, alcohol consumption status, physical activity, dietary therapy, use of medications, and history of comorbid conditions. Height (m) and weight (kg) were measured, and body mass index (BMI) was calculated as weight (kg) divided by height squared (m2). BMI was classified according to Asian-specific criteria [12] as follows: underweight, BMI <18.5 kg/m2; normal weight, BMI 18.5 to 22.9 kg/m2; overweight, BMI 23.0 to 24.9 kg/m2; obese class I, BMI 25.0 to 29.9 kg/m2; and obese class II, BMI ≥30.0 kg/m2. Waist circumference was measured at the midpoint between the lower ribs and the iliac crest. Blood pressure was measured by trained staff while the participant was sitting and had rested for at least 5 minutes. Blood samples were obtained after fasting for at least 10 hours, and the following were measured: serum fasting glucose, insulin, C-peptide, glycosylated hemoglobin (HbA1c), triglycerides, total cholesterol, and high density lipoprotein cholesterol (HDL-C). Low density lipoprotein cholesterol (LDL-C) was calculated according to the following formula: LDL-C=total cholesterol–HDL-C–(triglycerides/5) [13]. To allow for the accurate evaluation of glucose metabolism, an oral glucose tolerance test (OGTT) was performed. After 30 minutes of oral glucose loading, a blood sample was taken, and glucose, insulin, and C-peptide levels were analyzed using biochemical assays performed by a central laboratory (Seoul Clinical Laboratories, Seoul, Korea). Insulin resistance was evaluated using the homeostatic model assessment of insulin resistance (HOMA-IR), and β-cell dysfunction was evaluated using the homeostatic model assessment of β-cell function (HOMA-β), fasting C-peptide levels, the insulinogenic index, and the disposition index. HOMA-IR was calculated as fasting insulin (µIU/mL)×fasting glucose (mmol/L)/22.5, and HOMA-β was calculated as 20×fasting insulin (µIU/mL)/[fasting glucose (mmol/L)–3.5] [14]. The insulinogenic index was calculated as [insulin 30 minutes–insulin 0 minute (pmol/L)]/[glucose 30 minutes–glucose 0 minute (mmol/L)]. The disposition index was calculated as insulinogenic index multiplied by 1/fasting insulin [15]. The presence of insulin resistance was defined as a HOMA-IR value ≥2.5 [16]. We categorized insulin secretion by using fasting serum C-peptide levels as follows: severe (<1.10 ng/mL), moderate (1.10 to 1.69 ng/mL), and mild to non-secretory defect (≥1.70 ng/mL) [17]. The presence of insulin secretory defect was defined as fasting C-peptide levels <1.70 ng/mL. The presence of metabolic syndrome was determined using the modified National Cholesterol Education Program/Adult Treatment Panel III definition and was defined by the presence of three or more of the following criteria: (1) waist circumference ≥90 cm in men or ≥85 cm in women; (2) triglycerides ≥1.7 mmol/L (150 mg/dL); (3) HDL-C <1.03 mmol/L (40 mg/dL) in men or <1.29 mmol/L (50 mg/dL) in women; (4) systolic blood pressure ≥130 mm Hg, diastolic blood pressure ≥85 mm Hg, or use of antihypertensive therapy; and (5) fasting glucose ≥5.6 mmol/L (100 mg/dL) or a previous diagnosis of diabetes [18].
- Variables with a skewed distribution were log-transformed before analysis. Descriptive statistics used to characterize the study participants are presented as the mean±standard deviation or the median and interquartile range for continuous variables, and as frequencies and percentages for categorical variables. Differences were analyzed using Student t-test, the Mann-Whitney U test, or one-way analysis of variance followed by Tukey multiple-comparison test for continuous variables and the chi-square test for categorical variables. All analyses were conducted using the SAS software version 9.4 (SAS Institute Inc., Cary, NC, USA).
- Ethical consideration
- The study protocol was reviewed and approved by the Institutional Review Board (IRB) of Bucheon St. Mary's Hospital at the Catholic University (IRB No. HC14OIMI0132) and also by IRBs of all participating institutions. All participants provided written informed consent before participation.
METHODS
- The characteristics of the study participants are shown in Table 1. The mean age of the men and women included in this study was 54.3 and 58.8 years, respectively. The median HOMA-IR value in men was significantly higher than that in women (3.6 vs. 3.3). However, the median HOMA-β, insulinogenic index, and disposition index values in men were significantly lower than in women (HOMA-β, 45.9 vs. 68.5; insulinogenic index, 9.7 vs. 21.3; disposition index, 0.15 vs. 0.29). The fasting glucose and 30-minute glucose levels of men were significantly higher than those of women. The median HbA1c in men was also significantly higher than in women. In addition, the proportion of participants with HbA1c ≥10% was 20.7% in men and 9.3% in women. The proportion of participants with current smoking or current drinking status was higher in men than in women (current smoking, 40.0% vs. 4.8%; current drinking, 72.1% vs. 19.3%). On the other hand, the proportion of participants using antihypertensive and lipid-lowering drugs was lower in men than in women (antihypertensive drugs, 36.1% vs. 43.3%; lipid-lowering drugs, 23.6% vs. 35.8%).
- Table 2 shows the characteristics of the study participants according to age groups. Using age categories of <40 years (n=81, 8.9%), 40 to 64 years (n=604, 66.2%), and ≥65 years (n=227, 24.9%), the proportion of men, the BMI, the waist circumference, and the diastolic blood pressure were highest in the younger participants. In addition, younger participants had significantly higher fasting glucose, 30-minute glucose, fasting insulin, fasting C-peptide, HOMA-IR, and HbA1c levels than the older participants. Moreover, the proportion of participants with HbA1c ≥10% was higher in the youngest age category than in the oldest (42.0% and 7.0% for age groups <40 years and ≥65 years, respectively). However, the median HOMA-β, insulinogenic index and disposition index values were significantly lower in the younger participants than in the older participants. Younger age was associated with a lower proportion of antihypertensive and dyslipidemia medication use. In addition, the proportion of current smokers and drinkers was highest in the younger participants. However, the proportion of dietary therapy and physical activity was lowest in the younger participants.
- Table 3 shows the distribution of insulin resistance and insulin secretion among the study participants. A total of 4.4% and 18.2% of participants had severe (C-peptide <1.10 ng/mL) and moderate (C-peptide 1.10 to 1.69 ng/mL) insulin secretory defects, respectively. The proportion of participants with mild to non-secretory defects (C-peptide ≥1.70 ng/mL) was 77.4%. On the other hand, the proportion of participants with insulin resistance (HOMA-IR ≥2.5) was 75.1%. When participants were divided according to both insulin resistance and insulin secretion, the proportion of participants with insulin resistance and mild to non-secretory defect was the greatest (67.4%).
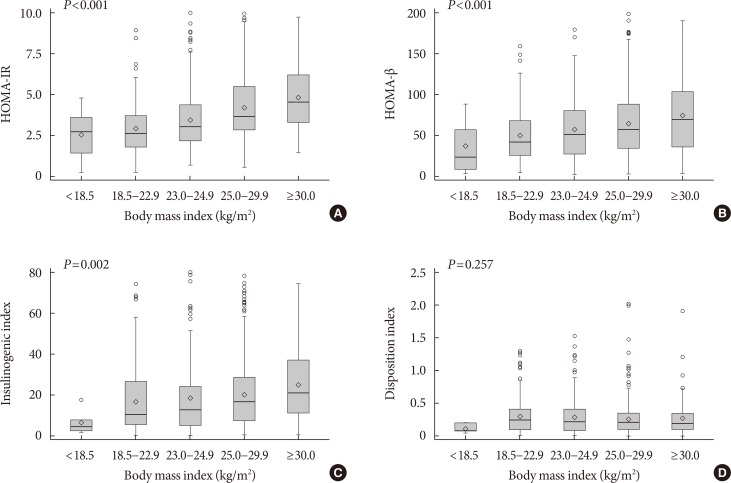
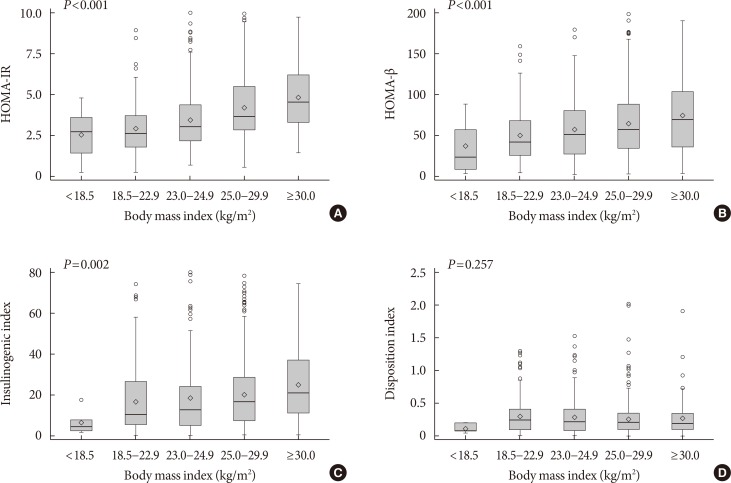
- Fig. 1 shows the distributions of HOMA-IR, HOMA-β, the insulinogenic index, and the disposition index values according to BMI. As BMI increased, HOMA-IR, HOMA-β, and insulinogenic index increased (P<0.01 for all comparisons). However, there were no differences in the disposition index according to BMI (P=0.257).
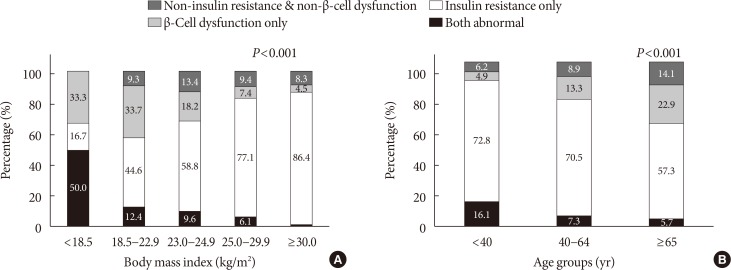
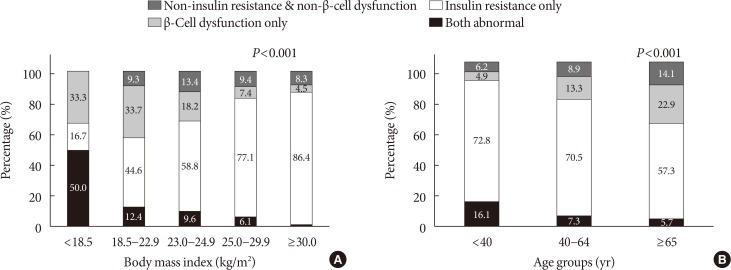
- When the presence of insulin resistance and β-cell dysfunction were defined as HOMA-IR ≥2.5 and fasting C-peptide levels <1.70 ng/mL, respectively, the proportion of participants with insulin resistance but no β-cell dysfunction increased, and the proportion of participants with β-cell dysfunction but no insulin resistance decreased as BMI increased. In those with BMI more than 30 kg/m2, the proportion of participants with insulin resistance but no β-cell dysfunction was the greatest (86.4%) (Fig. 2A). By age groups, the proportion of participants with insulin resistance but no β-cell dysfunction decreased from 72.8% among those younger than 40 years of age to 57.3% among those older than 65 years of age. On the other hand, the proportion of participants with β-cell dysfunction but no insulin resistance increased from 4.9% among those younger than 40 years of age to 22.9% among those older than 65 years of age (Fig. 2B).
RESULTS
- In this analysis of nationwide cross-sectional data, we observed that insulin resistance plays a more important role than β-cell dysfunction in the pathophysiology of participants with newly diagnosed type 2 diabetes.
- Historically, β-cell dysfunction has been described as the main etiological factor underlying type 2 diabetes in East Asia. Insufficient β-cell response to a minor decrease in insulin sensitivity results in loss of glycemic control and increased risk of diabetes [19]. Previous studies have suggested that impaired early-phase insulin secretion is the main factor underlying diabetes development in East Asian countries such as China, Japan, and South Korea [72021]. In South Korea, approximately 65% of people with type 2 diabetes were not obese in the late 1990s, and β-cell mass was markedly reduced, resulting in impaired and delayed insulin secretion [2223]. Moreover, Ohn et al. [5] reported that β-cell function and impaired β-cell compensation play an important role in the worsening of glucose tolerance in the Ansung-Ansan cohort study, in which the initial enrollment was performed in 2001 to 2002.
- However, the prevalence of diabetes is shifting toward younger and more obese populations in South Korea [8]. Obesity is the main factor responsible for the increased risk of developing type 2 diabetes. The increase in obesity due to rapidly westernizing lifestyle habits affects the development of insulin resistance through release of non-esterified fatty acids, glycerol, hormones, and proinflammatory cytokines [24252627]. In South Korea, previous studies have reported that insulin resistance is the initial abnormality that manifests during the development of type 2 diabetes. Kim et al. [9] reported that in 2005, 70.6% of people with type 2 diabetes had insulin resistance, whereas 46.1% of those with type 2 diabetes had β-cell dysfunction. During 2009 to 2010, 59.5% of drug-naive people with type 2 diabetes were insulin resistant, whereas 20.2% of drug-naive people with type 2 diabetes had β-cell dysfunction [10]. In addition, in our present study, obese participants with type 2 diabetes had relatively more insulin resistance, whereas non-obese participants with type 2 diabetes had relatively more β-cell dysfunction. Specifically, the prevalence of insulin resistance was 86.4% in those with a BMI of 30 kg/m2 or greater. These findings are consistent with those of previous studies. In South Korea, 60% of people with type 2 diabetes and a BMI >23.7 kg/m2 were insulin resistant [28]. In China, Liu et al. [29] reported that obese individuals had high HOMA-IR values, but non-obese individuals had low HOMA-β and insulinogenic index values. Ultimately, although β-cell dysfunction is an important contributing factor to the development of type 2 diabetes, it is essential to avoid obesity and insulin resistance for type 2 diabetes prevention.
- We observed that people diagnosed before 40 years of age had severe obesity, severe insulin secretion defects, and severe insulin resistance, which triggered early manifestations of hyperglycemia. On the other hand, people who were diagnosed after 65 years of age had relatively mild type 2 diabetes, as well as less severe obesity, insulin secretion defects, insulin resistance, and hyperglycemia. A previous study reported that people with type 2 diabetes diagnosed before 45 years of age were more obese and had poorer glycemic control and more abnormal lipid levels than those diagnosed at or after 45 years of age, using the Kaiser Permanente Northwest Diabetes Registry in the United States. In addition, this study suggests an inverse linear relationship between obesity and age of diabetes onset [30]. Further, a previous study reported that emergency department visits for hyperglycemia were highest among adults aged 18 to 44 years, using data from the Nationwide Emergency Department Sample in the United States [31].
- The reasons underlying why young adults diagnosed before 40 years of age were affected with different pathophysiological aspects in the early period of diabetes compared with the older population remain unclear. Early-onset type 2 diabetes is characterized by pancreatic β-cell impairment and obesity-induced insulin resistance [32]. Obesity contributes to an adverse cardiometabolic risk profile, and an abnormal internal environment contributes to the development of early onset of diabetes through hyperinsulinemia with progressive β-cell impairment [333435]. Further, younger participants may deteriorate insulin secretion by high glucose-induced glucotoxicity [36]. In addition, people diagnosed before 40 years of age had unhealthier lifestyles, including smoking, alcohol consumption, and physical inactivity. Lifestyle- and environmental-related factors such as smoking, alcohol consumption, lack of sleep, physical inactivity, and sedentary behavior cause continuous oxidative stress and thus induce impairments in β-cell function and insulin resistance by negatively affecting insulin signaling [3738]. However, according to the Korea National Health and Nutrition Examination Survey 2013 to 2015, as age decreased, diabetes awareness tended to decrease. In those 30 to 39 years of age, diabetes awareness rate was 42.3%; on the other hand, in those 60 to 69 years of age, diabetes awareness rate was 79.3% [39]. Younger people are less likely to get a health checkup. Therefore, they are likely to be diagnosed with relatively higher HbA1c because they visit the clinic only when they have severe hyperglycemic symptoms.
- This study has several limitations. First, it was cross-sectional in nature, and the direction of causality is unclear. It is necessary to evaluate changes in β-cell function and insulin resistance after improved blood glucose control to comprehend characteristics by difference of age, but this study could not do so. Next, we evaluated insulin secretion by using various indices. However, a 75-g OGTT was administered with additional blood samples collected at 30 minutes. Moreover, we did not consider insulin resistance indices such as the Matsuda insulin sensitivity index, which is a more elaborate method of measuring insulin resistance. Finally, the participants were recruited from primary care clinics or hospitals from different areas to represent the general population of South Korea. Although standardized questionnaires and measurement protocols were used, measurement errors may have occurred due to recruitment from multiple sites.
- This analysis of nationwide cross-sectional data from South Korea suggested that the main pathogenesis in participants with newly diagnosed type 2 diabetes is insulin resistance. To prevent and better manage type 2 diabetes, it is important to understand the characteristics of people with type 2 diabetes; different therapeutic approaches may be required according to pathophysiological differences. Specifically, people who develop type 2 diabetes at a younger age have the double burden of severe insulin resistance and severe insulin secretory defect and might be more likely to develop microvascular and macrovascular complications. Thus, to ensure early initiation of appropriate diabetes care, implementation of obesity management and screening programs for individuals younger than 40 years of age is warranted.
DISCUSSION
-
Acknowledgements
- This research was supported by a grant from the Korea Health Technology R&D Project through the Korea Health Industry Development Institute (KHIDI), funded by the Ministry of Health and Welfare, Republic of Korea (grant number: HI13C0715).
ACKNOWLEDGMENTS
-
CONFLICTS OF INTEREST: This research was funded by Chong Kun Dang Pharmaceutical Company. The funder did not play any role in the study design, data collection and analysis, decisions regarding data release, or manuscript preparation.
NOTES
- 1. International Diabetes Federation. IDF diabetes atlas 7th edition cited 2017 Dec 19. Available from: http://www.diabetesatlas.org.
- 2. Nolan CJ, Damm P, Prentki M. Type 2 diabetes across generations: from pathophysiology to prevention and management. Lancet 2011;378:169-181. ArticlePubMed
- 3. Møller JB, Dalla Man C, Overgaard RV, Ingwersen SH, Tornoe CW, Pedersen M, Tanaka H, Ohsugi M, Ueki K, Lynge J, Vasconcelos NM, Pedersen BK, Kadowaki T, Cobelli C. Ethnic differences in insulin sensitivity, β-cell function, and hepatic extraction between Japanese and Caucasians: a minimal model analysis. J Clin Endocrinol Metab 2014;99:4273-4280. ArticlePubMed
- 4. Moller JB, Pedersen M, Tanaka H, Ohsugi M, Overgaard RV, Lynge J, Almind K, Vasconcelos NM, Poulsen P, Keller C, Ueki K, Ingwersen SH, Pedersen BK, Kadowaki T. Body composition is the main determinant for the difference in type 2 diabetes pathophysiology between Japanese and Caucasians. Diabetes Care 2014;37:796-804. ArticlePubMedPDF
- 5. Ohn JH, Kwak SH, Cho YM, Lim S, Jang HC, Park KS, Cho NH. 10-Year trajectory of β-cell function and insulin sensitivity in the development of type 2 diabetes: a community-based prospective cohort study. Lancet Diabetes Endocrinol 2016;4:27-34. ArticlePubMed
- 6. Rattarasarn C, Soonthornpan S, Leelawattana R, Setasuban W. Decreased insulin secretion but not insulin sensitivity in normal glucose tolerant Thai subjects. Diabetes Care 2006;29:742-743. ArticlePubMedPDF
- 7. Yabe D, Seino Y, Fukushima M, Seino S. β Cell dysfunction versus insulin resistance in the pathogenesis of type 2 diabetes in East Asians. Curr Diab Rep 2015;15:602ArticlePubMedPDF
- 8. Ha KH, Kim DJ. Trends in the diabetes epidemic in Korea. Endocrinol Metab (Seoul) 2015;30:142-146. ArticlePubMedPMC
- 9. Kim DJ, Song KE, Park JW, Cho HK, Lee KW, Huh KB. Clinical characteristics of Korean type 2 diabetic patients in 2005. Diabetes Res Clin Pract 2007;77(Suppl 1):S252-S257. ArticlePubMed
- 10. Son JW, Park CY, Kim S, Lee HK, Lee YS. Insulin Resistance as Primary Pathogenesis in Newly Diagnosed, Drug Naive Type 2 Diabetes Patients in Korea (SURPRISE) Study Group. Changing clinical characteristics according to insulin resistance and insulin secretion in newly diagnosed type 2 diabetic patients in Korea. Diabetes Metab J 2015;39:387-394. ArticlePubMedPMC
- 11. Ko SH, Kim SR, Kim DJ, Oh SJ, Lee HJ, Shim KH, Woo MH, Kim JY, Kim NH, Kim JT, Kim CH, Kim HJ, Jeong IK, Hong EK, Cho JH, Mok JO, Yoon KH. Committee of Clinical Practice Guidelines, Korean Diabetes Association. 2011 Clinical practice guidelines for type 2 diabetes in Korea. Diabetes Metab J 2011;35:431-436. ArticlePubMedPMC
- 12. World Health Organization, International Association for the Study of Obesity, International Obesity Task Force. Chapter 2, Assessment/diagnosis. The Asia Pacific perspective: redefining obesity and its treatment. Sydney: Health Communications; 2000. p. 15-21.
- 13. Friedewald WT, Levy RI, Fredrickson DS. Estimation of the concentration of low-density lipoprotein cholesterol in plasma, without use of the preparative ultracentrifuge. Clin Chem 1972;18:499-502. ArticlePubMedPDF
- 14. Matthews DR, Hosker JP, Rudenski AS, Naylor BA, Treacher DF, Turner RC. Homeostasis model assessment: insulin resistance and beta-cell function from fasting plasma glucose and insulin concentrations in man. Diabetologia 1985;28:412-419. ArticlePubMedPDF
- 15. Utzschneider KM, Prigeon RL, Faulenbach MV, Tong J, Carr DB, Boyko EJ, Leonetti DL, McNeely MJ, Fujimoto WY, Kahn SE. Oral disposition index predicts the development of future diabetes above and beyond fasting and 2-h glucose levels. Diabetes Care 2009;32:335-341. ArticlePubMedPMCPDF
- 16. Yamada C, Mitsuhashi T, Hiratsuka N, Inabe F, Araida N, Takahashi E. Optimal reference interval for homeostasis model assessment of insulin resistance in a Japanese population. J Diabetes Investig 2011;2:373-376.ArticlePubMedPMC
- 17. Park SW, Yun YS, Ahn CW, Nam JH, Kwon SH, Song MK, Han SH, Cha BS, Son YD, Lee HC, Huh KB. Short Insulin Tolerance Test (SITT) for the determination of in vivo insulin sensitivity-a comparison with euglycemic clamp test. J Korean Diabetes Assoc 1998;22:199-208.
- 18. Alberti KG, Eckel RH, Grundy SM, Zimmet PZ, Cleeman JI, Donato KA, Fruchart JC, James WP, Loria CM, Smith SC Jr. International Diabetes Federation Task Force on Epidemiology and Prevention. Hational Heart, Lung, and Blood Institute. American Heart Association. World Heart Federation. International Atherosclerosis Society. International Association for the Study of Obesity. Harmonizing the metabolic syndrome: a joint interim statement of the International Diabetes Federation Task Force on Epidemiology and Prevention; National Heart, Lung, and Blood Institute; American Heart Association; World Heart Federation; International Atherosclerosis Society; and International Association for the Study of Obesity. Circulation 2009;120:1640-1645. ArticlePubMed
- 19. Yabe D, Seino Y. Type 2 diabetes via β-cell dysfunction in east Asian people. Lancet Diabetes Endocrinol 2016;4:2-3. ArticlePubMed
- 20. Kim DJ, Lee MS, Kim KW, Lee MK. Insulin secretory dysfunction and insulin resistance in the pathogenesis of Korean type 2 diabetes mellitus. Metabolism 2001;50:590-593. ArticlePubMed
- 21. Qian L, Xu L, Wang X, Fu X, Gu Y, Lin F, Peng Y, Li G, Luo M. Early insulin secretion failure leads to diabetes in Chinese subjects with impaired glucose regulation. Diabetes Metab Res Rev 2009;25:144-149. ArticlePubMed
- 22. Park JY, Lee KU, Kim CH, Kim HK, Hong SK, Park KS, Lee HK, Min HK. Past and current obesity in Koreans with non-insulin-dependent diabetes mellitus. Diabetes Res Clin Pract 1997;35:49-56. ArticlePubMed
- 23. Yoon KH, Ko SH, Cho JH, Lee JM, Ahn YB, Song KH, Yoo SJ, Kang MI, Cha BY, Lee KW, Son HY, Kang SK, Kim HS, Lee IK, Bonner-Weir S. Selective beta-cell loss and alpha-cell expansion in patients with type 2 diabetes mellitus in Korea. J Clin Endocrinol Metab 2003;88:2300-2308. PubMed
- 24. Beard JC, Ward WK, Halter JB, Wallum BJ, Porte D Jr. Relationship of islet function to insulin action in human obesity. J Clin Endocrinol Metab 1987;65:59-64. ArticlePubMed
- 25. Kahn SE. The relative contributions of insulin resistance and beta-cell dysfunction to the pathophysiology of type 2 diabetes. Diabetologia 2003;46:3-19. ArticlePubMedPDF
- 26. Olefsky J, Farquhar JW, Reaven G. Relationship between fasting plasma insulin level and resistance to insulin-mediated glucose uptake in normal and diabetic subjects. Diabetes 1973;22:507-513. ArticlePubMedPDF
- 27. Kahn SE, Hull RL, Utzschneider KM. Mechanisms linking obesity to insulin resistance and type 2 diabetes. Nature 2006;444:840-846. ArticlePubMedPDF
- 28. Kim CH, Kim HK, Kim EH, Bae SJ, Park JY. Relative contributions of insulin resistance and β-cell dysfunction to the development of type 2 diabetes in Koreans. Diabet Med 2013;30:1075-1079. ArticlePubMed
- 29. Liu J, Wang Y, Hu Y, Leng S, Wang G. Comparison of β-cell dysfunction and insulin resistance correlating obesity with type 2 diabetes: a cross-sectional study. J Diabetes Complications 2016;30:898-902. ArticlePubMed
- 30. Hillier TA, Pedula KL. Characteristics of an adult population with newly diagnosed type 2 diabetes: the relation of obesity and age of onset. Diabetes Care 2001;24:1522-1527. PubMed
- 31. Wang J, Geiss LS, Williams DE, Gregg EW. Trends in emergency department visit rates for hypoglycemia and hyperglycemic crisis among adults with Diabetes, United States, 2006-2011. PLoS One 2015;10:e0134917. ArticlePubMedPMC
- 32. Song SH. Emerging type 2 diabetes in young adults. Adv Exp Med Biol 2012;771:51-61. ArticlePubMed
- 33. Kong AP, Chan NN, Chan JC. The role of adipocytokines and neurohormonal dysregulation in metabolic syndrome. Curr Diabetes Rev 2006;2:397-407. ArticlePubMed
- 34. Kong AP, Luk AO, Chan JC. Detecting people at high risk of type 2 diabetes: how do we find them and who should be treated? Best Pract Res Clin Endocrinol Metab 2016;30:345-355. ArticlePubMed
- 35. Wajchenberg BL. Subcutaneous and visceral adipose tissue: their relation to the metabolic syndrome. Endocr Rev 2000;21:697-738. ArticlePubMed
- 36. Maedler K, Sergeev P, Ris F, Oberholzer J, Joller-Jemelka HI, Spinas GA, Kaiser N, Halban PA, Donath MY. Glucose-induced beta cell production of IL-1beta contributes to glucotoxicity in human pancreatic islets. J Clin Invest 2002;110:851-860. ArticlePubMedPMC
- 37. Drews G, Krippeit-Drews P, Dufer M. Oxidative stress and beta-cell dysfunction. Pflugers Arch 2010;460:703-718. ArticlePubMedPDF
- 38. Rains JL, Jain SK. Oxidative stress, insulin signaling, and diabetes. Free Radic Biol Med 2011;50:567-575. ArticlePubMed
- 39. Korean Ministry of Health and Welfare. Korea Health Statistics 2015: Korea National Health and Nutrition Examination Survey cited 2017 Dec 19. Available from: http://cdc.go.kr.
REFERENCES
The distributions of insulin resistance and insulin secretion indices according to body mass index. (A) Homeostatic model assessment of insulin resistance (HOMA-IR), (B) homeostatic model assessment of β-cell function (HOMA-β), (C) insulinogenic index, and (D) disposition index.
The proportion of insulin resistance (homeostatic model assessment of insulin resistance ≥2.5) and β-cell dysfunction (C-peptide <1.70 ng/mL) according to (A) body mass index and (B) age groups.
Characteristics of the study participants by sex
Values are presented as mean±standard deviation, median (interquartile range), or number (%).
HOMA-β, homeostatic model assessment of β-cell function; HOMA-IR, homeostatic model assessment of insulin resistance; HbA1c, glycosylated hemoglobin; HDL-C, high density lipoprotein cholesterol; LDL-C, low density lipoprotein cholesterol.
aOnly 508 men and 397 women were measured.
Characteristics of the study participants by age groups
Values are presented as mean±standard deviation, number (%), or median (interquartile range).
HOMA-β, homeostatic model assessment of β-cell function; HOMA-IR, homeostatic model assessment of insulin resistance; HbA1c, glycosylated hemoglobin; HDL-C, high density lipoprotein cholesterol; LDL-C, low density lipoprotein cholesterol.
aOnly 80 people aged <40 years, 600 people aged 40 to 64 years, and 225 people aged ≥65 years were measured.
Figure & Data
References
Citations
- A double‐blind, Randomized controlled trial on glucose‐lowering EFfects and safety of adding 0.25 or 0.5 mg lobeglitazone in type 2 diabetes patients with INadequate control on metformin and dipeptidyl peptidase‐4 inhibitor therapy: REFIND study
Soree Ryang, Sang Soo Kim, Ji Cheol Bae, Ji Min Han, Su Kyoung Kwon, Young Il Kim, Il Seong Nam‐Goong, Eun Sook Kim, Mi‐kyung Kim, Chang Won Lee, Soyeon Yoo, Gwanpyo Koh, Min Jeong Kwon, Jeong Hyun Park, In Joo Kim
Diabetes, Obesity and Metabolism.2022; 24(9): 1800. CrossRef - Apparent Insulin Deficiency in an Adult African Population With New-Onset Type 2 Diabetes
Davis Kibirige, Isaac Sekitoleko, Priscilla Balungi, William Lumu, Moffat J. Nyirenda
Frontiers in Clinical Diabetes and Healthcare.2022;[Epub] CrossRef - Rising Incidence of Diabetes in Young Adults in South Korea: A National Cohort Study
Hyun Ho Choi, Giwoong Choi, Hojun Yoon, Kyoung Hwa Ha, Dae Jung Kim
Diabetes & Metabolism Journal.2022; 46(5): 803. CrossRef - A Real-World Study of Long-Term Safety and Efficacy of Lobeglitazone in Korean Patients with Type 2 Diabetes Mellitus
Bo-Yeon Kim, Hyuk-Sang Kwon, Suk Kyeong Kim, Jung-Hyun Noh, Cheol-Young Park, Hyeong-Kyu Park, Kee-Ho Song, Jong Chul Won, Jae Myung Yu, Mi Young Lee, Jae Hyuk Lee, Soo Lim, Sung Wan Chun, In-Kyung Jeong, Choon Hee Chung, Seung Jin Han, Hee-Seok Kim, Ju-Y
Diabetes & Metabolism Journal.2022; 46(6): 855. CrossRef - The Potential Effect of Rhizoma coptidis on Polycystic Ovary Syndrome Based on Network Pharmacology and Molecular Docking
Liyun Duan, De Jin, Xuedong An, Yuehong Zhang, Shenghui Zhao, Rongrong Zhou, Yingying Duan, Yuqing Zhang, Xinmin Liu, Fengmei Lian, Wen yi Kang
Evidence-Based Complementary and Alternative Medicine.2021; 2021: 1. CrossRef - PRKAA2variation and the clinical characteristics of patients newly diagnosed with type 2 diabetes mellitus in Yogyakarta, Indonesia
Dita Maria Virginia, Mae Sri Hartati Wahyuningsih, Dwi Aris Agung Nugrahaningsih
Asian Biomedicine.2021; 15(4): 161. CrossRef - Efficacy and Safety of Pioglitazone versus Glimepiride after Metformin and Alogliptin Combination Therapy: A Randomized, Open-Label, Multicenter, Parallel-Controlled Study
Jeong Mi Kim, Sang Soo Kim, Jong Ho Kim, Mi Kyung Kim, Tae Nyun Kim, Soon Hee Lee, Chang Won Lee, Ja Young Park, Eun Sook Kim, Kwang Jae Lee, Young Sik Choi, Duk Kyu Kim, In Joo Kim
Diabetes & Metabolism Journal.2020; 44(1): 67. CrossRef - Favorable Glycemic Control with Once-Daily Insulin Degludec/Insulin Aspart after Changing from Basal Insulin in Adults with Type 2 Diabetes
Han Na Jang, Ye Seul Yang, Seong Ok Lee, Tae Jung Oh, Bo Kyung Koo, Hye Seung Jung
Endocrinology and Metabolism.2019; 34(4): 382. CrossRef - Insulin Resistance versus β-Cell Failure: Is It Changing in Koreans?
Mi-kyung Kim
Diabetes & Metabolism Journal.2018; 42(2): 128. CrossRef - Response: Clinical Characteristics of People with Newly Diagnosed Type 2 Diabetes between 2015 and 2016: Difference by Age and Body Mass Index (Diabetes Metab J2018;42:137-46)
Kyoung Hwa Ha, Dae Jung Kim, Sungrae Kim
Diabetes & Metabolism Journal.2018; 42(3): 251. CrossRef - Letter: Clinical Characteristics of People with Newly Diagnosed Type 2 Diabetes between 2015 and 2016: Difference by Age and Body Mass Index (Diabetes Metab J 2018;42:137-46)
Ah Reum Khang
Diabetes & Metabolism Journal.2018; 42(3): 249. CrossRef
 PubReader
 Cite
Cite