- Current
- Browse
- Collections
-
For contributors
- For Authors
- Instructions to authors
- Article processing charge
- e-submission
- For Reviewers
- Instructions for reviewers
- How to become a reviewer
- Best reviewers
- For Readers
- Readership
- Subscription
- Permission guidelines
- About
- Editorial policy
Articles
- Page Path
- HOME > Diabetes Metab J > Volume 43(2); 2019 > Article
-
Original ArticleOthers Increased Nociceptive Responses in Streptozotocin-Induced Diabetic Rats and the Related Expression of Spinal NR2B Subunit of
N -Methyl-D-Aspartate Receptors -
Che Aishah Nazariah Ismail1,2, Rapeah Suppian1, Che Badariah Abd Aziz2, Khalilah Haris1, Idris Long1

-
Diabetes & Metabolism Journal 2019;43(2):222-235.
DOI: https://doi.org/10.4093/dmj.2018.0020
Published online: November 19, 2018
1School of Health Sciences, Universiti Sains Malaysia Health Campus, Kota Bharu, Malaysia.
2Physiology Department, School of Medical Sciences, Universiti Sains Malaysia Health Campus, Kota Bharu, Malaysia.
- Corresponding author: Idris Long. School of Health Sciences, Universiti Sains Malaysia Health Campus, 16150 Kubang Kerian Kota Bharu, Kelantan, Malaysia. idriskk@usm.my
Copyright © 2019 Korean Diabetes Association
This is an Open Access article distributed under the terms of the Creative Commons Attribution Non-Commercial License (http://creativecommons.org/licenses/by-nc/4.0/) which permits unrestricted non-commercial use, distribution, and reproduction in any medium, provided the original work is properly cited.
ABSTRACT
-
Background
- This study investigated the role of NR2B in a modulated pain process in the painful diabetic neuropathy (PDN) rat using various pain stimuli.
-
Methods
- Thirty-two Sprague-Dawley male rats were randomly allocated into four groups (n=8): control, diabetes mellitus (DM) rats and diabetic rats treated with ifenprodil at a lower dose (0.5 µg/day) (I 0.5) or higher dose (1.0 µg/day) (I 1.0). DM was induced by a single injection of streptozotocin at 60 mg/kg on day 0 of experimentation. Diabetic status was assessed on day 3 of the experimentation. The responses on both tactile and thermal stimuli were assessed on day 0 (baseline), day 14 (pre-intervention), and day 22 (post-intervention). Ifenprodil was given intrathecally for 7 days from day 15 until day 21. On day 23, 5% formalin was injected into the rats' hind paw and the nociceptive responses were recorded for 1 hour. The rats were sacrificed 72 hours post-formalin injection and an analysis of the spinal NR2B expression was performed.
-
Results
- DM rats showed a significant reduction in pain threshold in response to the tactile and thermal stimuli and higher nociceptive response during the formalin test accompanied by the higher expression of phosphorylated spinal NR2B in both sides of the spinal cord. Ifenprodil treatment for both doses showed anti-allodynic and anti-nociceptive effects with lower expression of phosphorylated and total spinal NR2B.
-
Conclusion
- We suggest that the pain process in the streptozotocin-induced diabetic rat that has been modulated is associated with the higher phosphorylation of the spinal NR2B expression in the development of PDN, which is similar to other models of neuropathic rats.
- Diabetes mellitus (DM) is defined as a metabolic disorder characterized by hyperglycemia caused by complete or relative insulin depletion [1]. It is known to be related to neurological damage in both the peripheral and central nervous system. Diabetic neuropathy, which is a long-term complication of diabetes, comprises of several clinical or subclinical presentations. One of the clinical presentations of diabetic neuropathy is painful diabetic neuropathy (PDN), and it was reported as the common source of neuropathic pain. It was reported that nearly 30% to 50% of diabetic patients would develop PDN which would manifested as spontaneous pain, hyperalgesia, and allodynia [2].
- The neuropathic pain has been shown to modulate the N-methyl-D-aspartate (NMDA) receptor subunit composition because the mechanism of the neuropathic pain involves the occurrence and maintenance of central sensitization [3]. The persistent increase in nociceptive transmission via the excitatory synaptic transmission by the ionotropic glutamate NMDA receptor suggests that it could be a potential target to treat PDN. This calcium-permeable receptor needs glutamate, glycine and membrane depolarization for the initiation of central sensitization [4]. The heteromeric complexes of the NMDA receptor comprise three main subunits: NR1, NR2, and NR3 with eight different (GluN1) subunits, four distinguished NR2 subunits (NR2A-D and GluN2A-2D) and two NR3 subunits (NR3A and NR3B, and GluN3A and GluN3B) [5]. In neuropathic pain, the NMDA receptor plays a prominent role in causing a long-lasting increase in the synaptic efficacy such as long-term potentiation or central sensitization in the dorsal horn. This effect, in turn, leads to the augmentation of the response to the sensory inputs [6].
- Between all the subunits of the NMDA receptor, we focused on the role of the NR2B subunit of the NMDA receptor. NR2B subunit is reported to be highly implicated in the modulation of learning, memory processing, feeding behaviour and most importantly, modulating the pain perception [5]. NR2B subunit is known to have relatively restricted dissemination of pain transmission and pain regulatory pathways such as in forebrain and the superficial dorsal horn of the spinal cord [7]. NR2B subunit is also involved in synaptic plasticity and undergoes phosphorylation at the tyrosine residue [8]. A study conducted by Wei et al. [9] revealed the link between NR2B subunit overexpression in the anterior cingulate and insular cortices of the mice forebrain and the increased responsiveness to the hind paw that was injected with inflammatory stimuli. Real time polymerase chain reaction analyses demonstrated that the upregulation of NR2B subunit mRNA level in a rat's hind paw induced with complete Freund's adjuvant (CFA) occurred as early as 5 hours post-inflammation and persisted for 7 days before returning to the baseline level by 2 weeks post-inflammation [10]. Due to the major contribution of the NR2B subunit in the pain transmission, in the present study, we believe that it could be a promising target to combat neuropathic pain, specifically PDN. It is well accepted that NR2B subunit is involved in transmitting pain signals; however, whether the spinal cord NR2B subunit contributes to the pain transmission in PDN remains mostly uncertain. Thus, in the present study, we mainly focused on the involvement of NR2B subunit expression in the development of PDN in the spinal cord of the streptozotocin (STZ)-induced diabetic rats.
- To understand the role of NR2B subunit, we used ifenprodil, a selective, atypical non-competitive NMDA receptor antagonist which specifically antagonizes NR2B-containing subtype of NMDA receptor to examine the roles of NR2B subunit in the pathogenesis of PDN. Ifenprodil is effective in specifically suppressing NR2B subunit of the NMDA receptor at a 400-fold lower dose compared to other drugs to inhibit similar receptors [11]. There were numerous reports that demonstrated the anti-nociceptive activity of ifenprodil with a lower side effect profile in a neuropathic pain rat's model [121314]. Thus, in a rat model of diabetes induced by STZ, we aimed to understand the role of NR2B in the early pathogenesis of PDN using various pain stimuli by treating the rats with ifenprodil, an antagonist to NR2B subunit. We also aimed to uncover the association between the expression of the total NR2B (tNR2B) subunit and its phosphorylation in the spinal dorsal horn with the tactile allodynia, thermal hyperalgesia and formalin-induced nociceptive responses in the STZ-induced diabetic rat's model.
INTRODUCTION
- Animals
- The study was performed on 32 Sprague-Dawley male rats weighing 200 to 230 g (8 to 10 weeks old). They were housed individually in an air-conditioned room (20℃) and maintained on a 12-hour light/dark cycle (7:00 AM to 7:00 PM). All the animals were fed a standard diet and had free access to water. The experimental procedures conducted in the present study were in compliance with the Animal Ethics Approval (USM/Animal Ethics Approval/2014 [91] [560]). The percentage of the changes in the body weight gain of the rats throughout the study period was recorded according to the formula below:
- Streptozotocin-induced diabetes in rats
- All the rats fasted for at least 14 hours before the induction of diabetes. DM was induced by a single intraperitoneal injection of STZ (Sigma-Aldrich, Darmstadt, Germany) at a dose of 60 mg/kg body weight, freshly dissolved in a citrate buffer (pH 4.5) as a vehicle. Meanwhile, the control rats were injected intraperitoneally with citrate buffer respectively. A 10% sucrose solution was given to the rats for 1 day to avoid the development of severe hypoglycaemia in rats that could be lethal. Diabetes was confirmed 3 days after the STZ injection by obtaining the blood via pin-prick at the tip of the tail, whilst the control group remains non-diabetic. The blood glucose level was measured before the induction of STZ (day 0), after the induction of STZ (day 3), on the pre-intervention day (day 14), and post-intervention day (day 22) using a strip-operated glucometer (Accu-chek Performa; Roche Diagnostics, Paris, France). The animals with the final blood glucose level ≥270 mg/dL were considered as diabetic.
- Pain threshold assessment
- Tactile allodynia was measured in all the rats using an automatic von Frey apparatus (Bioseb, Pinellas Park, FL, USA). The rats were placed on a wire mesh floor in a quiet room and allowed to acclimatize for a minimum of 15 minutes before beginning the test. A semi-flexible filament weighing 0.099 g was applied to the mid-plantar region of the hind paw. The pressure was gradually increased until either a clear retraction, licking or jumping was observed. The force applied to the filament which evoked a hind paw withdrawal represented a maximal threshold and expressed in grams. The stimulation was conducted three times, and the average measurement was calculated. The stimulation using the filament was applied perpendicularly to both the right and left hind paws, separated by 10 minutes of interval from the previous tactile stimulation of the paw [15]. On day 14 (pre-intervention day), the rats were considered hyperalgesic when the reduction in the nociceptive pain thresholds by the von Frey test was more than 15% of the value obtained before the STZ injection (day 0) [16]. Meanwhile, the rats with the reduction in the nociceptive pain threshold by the von Frey test of less than 15% of the value obtained before the STZ injection were determined as non-PDN rats. The non-PDN rats showed hypoalgesic/analgesic behaviour at the early course of diabetic when subjected to various pain stimulation compared to the normal and DM rats which were accompanied with a reduced expression of total and phosphorylated NR2B subunit NMDA receptor compared to the control and DM groups. We decided to exclude the non-PDN rats' results because we were unsure about the possible mechanism for hypoalgesic/analgesic behaviour effects and planned to do further investigation to elucidate the mechanism of different phenotypes in the diabetic-induced rats in our study.
- Thermal hyperalgesia was measured for the paw withdrawal latency to thermal stimuli using a hot-plate test (Bioseb). The temperature was constantly set at 52.5℃. The latency to respond with either a hind paw lick, hind paw flick or jump from the onset of the heat stimulation was recorded [17]. The test was terminated if the animals did not respond within 30 seconds and each animal was tested only once to avoid adaptation.
- Experimental grouping and intrathecal drug administration
- Adult rats were randomly assigned to four experimental groups (eight rats per group): (1) control, treated with vehicle (saline 0.9%); (2) DM control rats treated with vehicle; (3) DM rats treated with ifenprodil either at a lower dose (0.5 µg/day) (I 0.5); or (4) at a higher dose (1.0 µg/day) (I 1.0). The dose of 20 µL of either normal saline 0.9% or ifenprodil (0.5 or 1.0 µg/day) was given to the rats, intrathecally every day for 7 days starting from day 15 to 22 post STZ injection.
- The direct intrathecal administration of the treatment was performed following a method by Lu and Schmidtko [18]. The rats were initially anaesthetized with isoflurane using an anaesthesia machine. During the anaesthetic state, the rats were removed and shaved at the back of the body. The area between L5 and L6 spinous processes were used as the skin puncture site, in which this area corresponds to the cauda equina. The vertical puncture of a 30 G needle connected to 1 mL syringe to the dura mater was reliably confirmed by either a reflexive flick of the tail or the formation of an ‘S’ shape by the tail. The treatment was slowly injected into the intervertebral space within 2 seconds. Finally, the rats were observed for 2 minutes after the injection to ensure there was no injury or any motor impairment in the rats.
- Formalin test
- The rat received an intraplantar injection of 50 µL of 5% formalin solution into the dorsal surface of the right hind paw and was immediately transferred to a Perspex testing chamber (26×20×20 cm). A mirror was placed beneath the floor directing the base of the chamber at a 45° angle to allow an unobstructed view of the paw. The nociceptive response was recorded for 60 minutes using a video camera. The recorded response was assessed by two persons blinded to any treatment based on the pain score from 0 to 3, as follows: 0, the rats feel no pain at all (i.e., foot flat on the floor with all toes splayed); 1, the injected paw has little or no weight on it, with no toes splaying, indicating mild pain; 2, the injected paw is elevated and the heel is not in contact with any surface, indicating moderate pain; 3, the injected paw is licked, bitten or shaken, an indication of severe pain felt.
- The nociceptive responses were then tabulated every minute and averaged at 5-minute intervals [19]. The nociceptive responses were divided into three phases comprising of phase 1 (mean score from minute 0 to 10), early phase 2 (mean score from minute 15 to 35), and late phase 2 (mean score from minute 40 to 60).
- Immunohistochemistry for total NR2B subunit and a phosphorylated NR2B subunit of the NMDA receptors positive neurons expressions
- Seventy-two hours after the formalin test was conducted, the rats were deeply anaesthetized with sodium pentobarbitone (Alfasan, Woerden, Netherlands) intraperitoneally. In our unpublished work, the activated microglia were shown to be clearly expressed and localized to the portion of lamina I–IV in the spinal cord at 3 days after the formalin injection. This finding has also been supported by Fu et al. [20]. It is the reason of sacrificing the rats at 3 days after formalin injection. Thoracotomy was carried out to expose the heart. The left ventricle of the rat's heart was inserted with an 18 G needle (branula) and a snip was made to the right atrium for an outlet. Perfusion was conducted by means of the gravity method using phosphate buffered saline (PBS) and post-fixed with 500 mL of fresh, cold 4% paraformaldehyde in 0.1 M phosphate buffer (PB) (pH 7.4). The lumbar enlargement region of the spinal cord (L4–L5) (which innervates the hind paw) was removed. Following an overnight cryoprotection in 20% sucrose in PB 0.1 M, L4 and L5 segments were sectioned (40 µm thickness) using a cryostat and every third section was collected as a free-floating section in PBS. The sections were rinsed with Tris-buffered saline (TBS) twice for 5 minutes each and incubated for 48 hours at 4℃ with either primary rabbit polyclonal for NR2B (1:500; Thermo Scientific, Waltham, MA, USA) or phosphorylated NR2B (pTyr-1336, 1:400; Thermo Scientific) antibodies diluted in TBS containing blocking solutions of 2% normal goat serum and 0.2% Triton X-100. The sections were then washed in Tris-triton and incubated with the biotinylated secondary antibody (goat anti-rabbit anti-serum, Rabbit ABC Staining System; Thermo Scientific) with a dilution of 1:200 for 1 hour at room temperature (RT). After additional rinses in TBS/Triton, all the sections were incubated with avidin-biotin-HRP (diluted 1:50 in TBS; Thermo Scientific) for 1 hour at RT. All the sections were again rinsed with TBS/Triton before being visualized with 3, 3′-diaminobenzidine (0.02% in TBS, 0.2% hydrogen peroxide; Thermo Scientific) as a chromogen. The immunostained sections were air-dried overnight, dehydrated with absolute ethanol, cleared, mounted onto gelatin-subbed slides and cover-slipped with DPX mounting solution (BDH Laboratory, Poole, UK). Six random sections were captured using an image analyzer (Leica MPS 60; Leica, Tokyo, Japan) under 100× magnifications. The total number of protein expression was counted manually from laminae I to VI and the average of six sections were taken from each rat from the ipsilateral and contralateral sides.
- Western blot analysis
- The tNR2B subunit and the phosphorylated NR2B subunit of the NMDA receptors level in the spinal cord was determined by the Western blot analysis. Seventy-two hours post-formalin injection, the rats were sacrificed by decapitation using a guillotine after being deeply anaesthetized with an overdose injection of sodium pentobarbitone intraperitoneally. The lumbar enlargement region of the spinal cord was dissected out from the rats without a fixation process and separated into the ipsilateral and contralateral sides by a cut at the midline of the spinal cord. Immediately after the removal, the tissue was deep-frozen in liquid nitrogen and kept at −80℃ until further assay. The protein was extracted from the spinal cord tissue using ice-cold RIPA buffer (Thermofisher Scientific) that was freshly mixed with concentrated Halt Protease and Phosphatase cocktail kit (Pierce, Rockford, lL, USA) in a volume of 10 µL/mL per reagent. The protein concentration of the extracted samples was determined by the bicinchoninic acid (BCA) protein assay kit (Thermofisher Scientific). The protein samples containing 50 µg of the total protein (after the optimization) was denatured and subjected to sodium dodecyl sulfate polyacrylamide gel electrophoresis (SDS-PAGE) using 15% resolving gel. The proteins from the gel were transferred to a nitrocellulose membrane (Bio-Rad, Hercules, CA, USA) with a semi-dry protein transfer apparatus set at 13 V for 2 hours. The nitrocellulose membrane was incubated in blocking the solution at either 5% bovine serum albumin in TBS (for NR2B subunit protein) or 5% skimmed milk in TBS (for phosphorylated-NR2B subunit) for 1 hour at RT. Following that, the membrane was washed three times for 10 minutes each in Tris-buffered saline-Tween 20 (TBST). The membrane was then incubated with either rabbit polyclonal NR2B subunit antibody (1:1,000 dilution in TBST), rabbit polyclonal phosphorylated NR2B subunit (Tyr1336, 1:500 dilution in TBST), or mouse monoclonal β-actin antibody (dilution 1:2,000 in TBST) overnight at 4℃. The membrane was then incubated with HRP-conjugated goat anti-rabbit antibody (dilution 1:5,000 in TBST for NR2B subunit and phosphorylated-NR2B subunit proteins) or mouse secondary antibody (dilution 1:5,000 in TBST for β-actin protein) for 1 hour at RT. Between the incubations, the membrane was washed three times for 10 minutes each and the blot was examined using Clarity Western ECL Substrate (Thermofisher Scientific). The image was taken by an image analyzer Fusion FX Chemiluminescence Imaging (Analis, Namur, Belgium) apparatus. The integrated density values (IDV) of the NR2B subunit, the phosphorylated NR2B subunit of NMDA receptors and β-actin proteins were measured using FUSION-CAP software (Analis) in the image analyzer. The mean relative intensity of fold change was measured using the formula below:
- Statistical analysis
- The data was analyzed using SPSS software version 22 (IBM Co., Armonk, NY, USA). The percentage of change in body weight gain, the nociceptive response phases using the formalin test (phase 1, early phase 2, and late phase 2), the total numbers of NR2B subunit and phosphorylated NR2B subunit of NMDA receptors positive neurons, mean relatives NR2B subunit and phosphorylated NR2B subunit protein levels were analyzed using a one-way analysis of variance (ANOVA) with the post hoc least-significant differences (LSD) or Dunnett's T3 tests. Meanwhile, the blood glucose level, tactile allodynia, and thermal hyperalgesia were analyzed using one-way repeated measures ANOVA with Greenhouse-Geisser correction followed by a post hoc LSD test. The results were expressed as a mean±standard error of the mean (SEM), standard deviation (SD), and the level of significance was determined at P<0.05.
METHODS
Tactile allodynia by automatic von Frey apparatus
Thermal hyperalgesia by hot-plate test
- Changes in the percentage of body weight gain and blood glucose level
- The DM rats show significant weight loss throughout the study compared to the control group (P<0.001) (Table 1). Although the ifenprodil-treated groups exhibit a marked reduction in the percentage of body weight gain compared to the control group (P<0.001), they show a prominent increase in the percentage of body weight gain compared to the DM group especially if a higher dose is used (I 1.0) (P<0.001), indicating the ifenprodil treatment may reverse the body weight loss in the PDN rats. Furthermore, all the DM rats show a significant increase in blood glucose level compared to the control rats and they are maintained as diabetics from day 3 until post-intervention (day 22) (P<0.001). The result show that the group treated with ifenprodil at both doses significantly reduce the blood sugar level after 7 days of treatment compared to the DM group (P<0.001) (Table 1).
- Tactile allodynia by automatic von Frey apparatus.
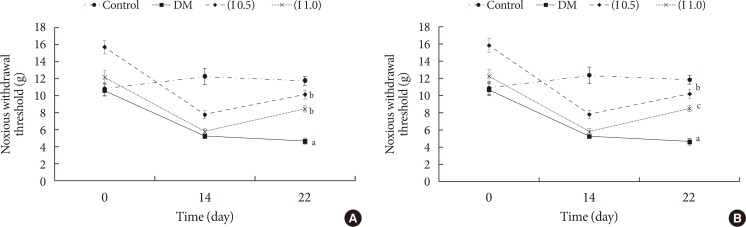
- Generally, all the rats with diabetic exhibit a strong tactile allodynia effect at 2 weeks after the diabetic induction. Specifically, there is a statistically significant difference in the pain threshold on the left hind paw of the rats (P<0.001) between the groups. The post hoc LSD test reveals that the DM group has significantly reduced noxious withdrawal threshold on day 14 (pre-treatment) and it is maintained reduced on day 22 (post-treatment) compared to the control group (P<0.001). Ifenprodil at both doses significantly reverses the allodynia development by increasing the noxious withdrawal threshold in the DM rats after the treatment. No significant difference is seen in the increase of noxious withdrawal threshold in the ifenprodil-treated groups between the lower and higher doses used (Fig. 1A).
- There is also a statistically significant difference in the tactile allodynia effect on the right hind paw of the rats between the groups (P<0.001). The post hoc LSD test reveals that the DM group is shown to be strongly allodynic compared to the control group (P<0.001) throughout the study period. The reduced noxious withdrawal threshold at the right hind paw of the DM rats is shown to be corrected by both the lower and higher doses of ifenprodil after the treatment periods (Fig. 1B).
- Thermal hyperalgesia by hot-plate test
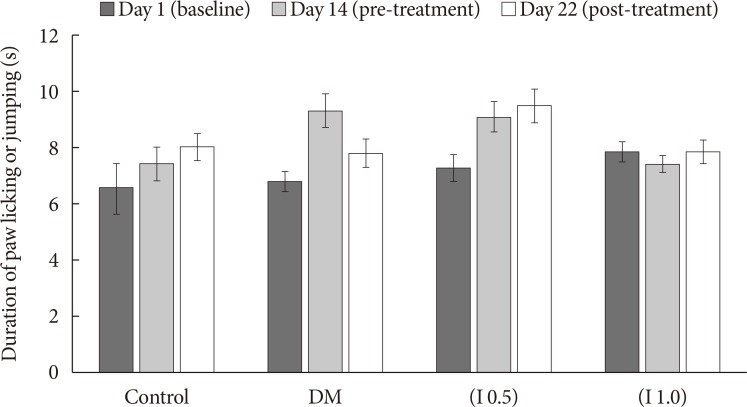
- The DM group does not produce and thermal hyperalgesia demonstrated by the insignificant difference in the thermal withdrawal threshold compared to the control group. The treatment by ifenprodil at both doses do not alter the thermal withdrawal threshold as evaluated on day 22 (Fig. 2).
- Nociceptive response by formalin test
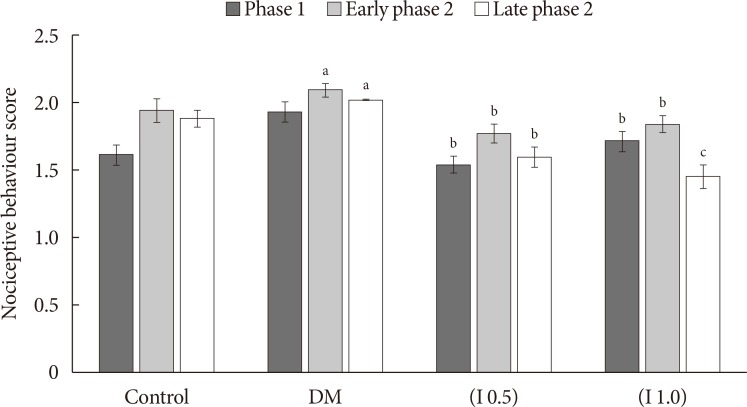
- The nociceptive response using the formalin test is divided into three phases: phase 1 (0 to 10 minutes), early phase 2 (15 to 35 minutes), and late phase 2 (40 to 60 minutes). There is a statistically significant difference between the groups during phase 1, early phase 2, and late phase 2 for nociceptive behaviour score (P<0.05). The post hoc LSD test reveals that the nociceptive responses in the DM rats regardless of treatment are significantly hyperalgesic during the phase 1 (P<0.05) and early phase 2 (P<0.05) but not during late phase 2 compared to the control group. The DM rats treated with ifenprodil at both doses have been shown to significantly reduce the nociceptive behaviour score in all phases compared to DM group (P<0.05) (Fig. 3).
- Total numbers of total NR2B subunit positive neurons
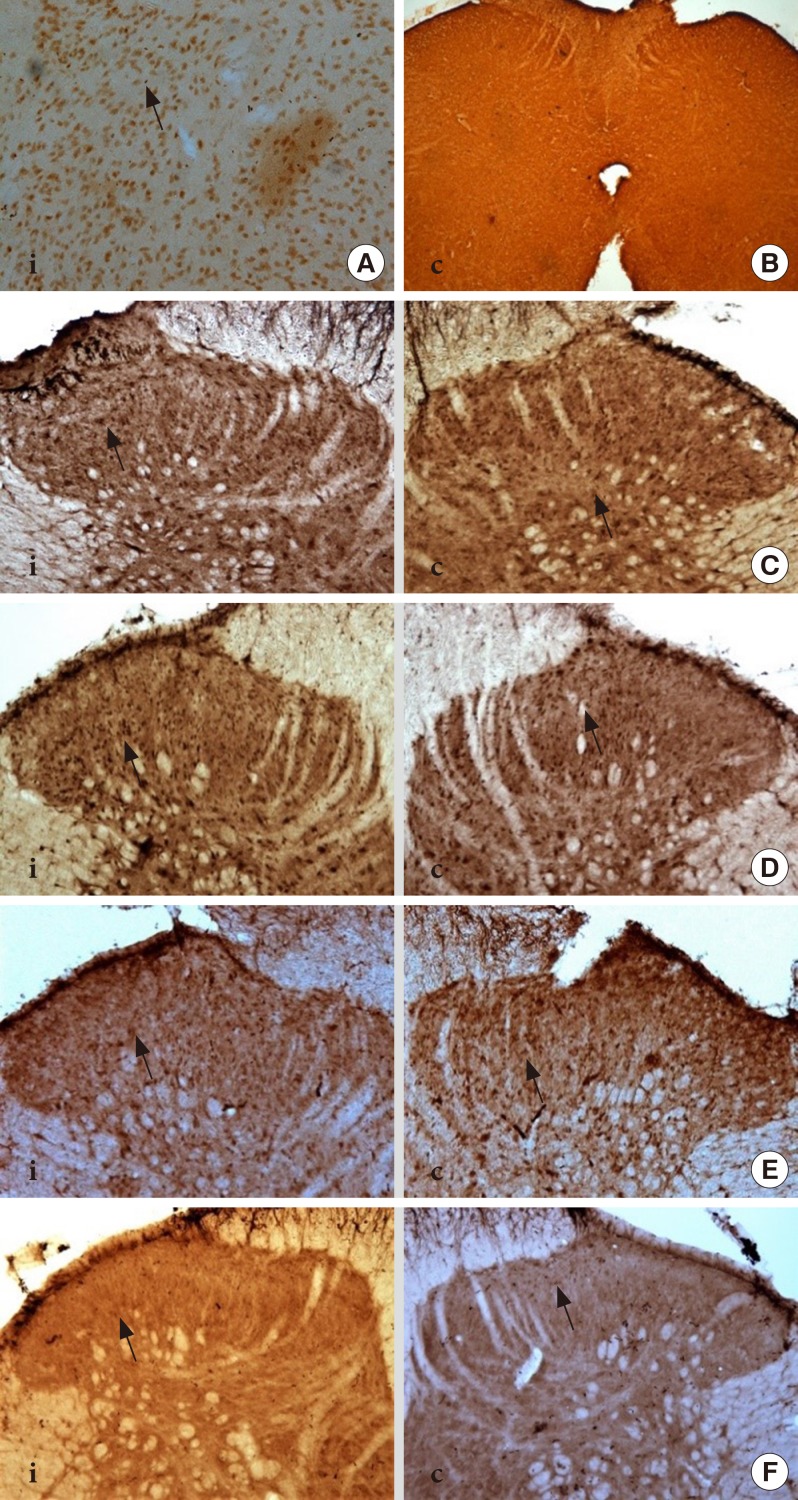
- The positive and negative controls for the tNR2B subunit of NMDA receptors are demonstrated in Fig. 4A and B. There is a significant effect on the total number of NR2B subunit positive neurons between the groups in the ipsilateral (P<0.001) and contralateral sides (P<0.001) of the spinal cord of rats. The total numbers of NR2B subunit positive neurons are found to be significantly increased in the DM group compared to the control group in both ipsilateral and contralateral sides. Meanwhile, the intrathecal administration of ifenprodil at both doses demonstrates a marked attenuation in the tNR2B total expression at both the ipsilateral and contralateral sides of rat's spinal cord compared to the DM and control groups (Table 2, Fig. 4).
- Total number of phosphorylated NR2B subunit positive neurons
- The positive and negative controls for the tNR2B subunit of NMDA receptors are demonstrated in Fig. 5B and C. There is a significant difference in the total number of the phosphorylated NR2B subunit of NMDA receptors between the groups on the ipsilateral side (P<0.001) and contralateral side (P<0.001) of the rat's spinal cord. The post hoc LSD test reveals that the total number of the phosphorylated NR2B subunit positive neurons in the ipsilateral and contralateral sides of the spinal cord has significantly increased in the DM group compared to the control group (P<0.05). The intrathecal administration of ifenprodil at both the lower (0.5 µg/day) and higher (1.0 µg/day) doses has significantly attenuate the total numbers of phosphorylated NR2B subunit positive neurons compared to the DM and control groups at both the ipsilateral and contralateral sides of the spinal cord. No significant difference is detected in the total number of the phosphorylated NR2B subunit of NMDA receptors between the given doses of ifenprodil (Table 2, Fig. 5).
- Mean relative total NR2B subunit protein level
- The mean relative total the NR2B subunit protein level at the ipsilateral and contralateral sides of the spinal cord has significantly increased in the DM group compared to the control group (P<0.05). In contrast, the intrathecal administration of ifenprodil at a lower (I 0.5) and higher (I 1.0) doses significantly decrease the mean relative of the tNR2B subunit protein level compared to the DM group ipsilaterally and contralaterally (P<0.001). No effect is seen in the mean relative level of tNR2B subunit protein level between (I 0.5) and (I 1.0) groups at the ipsilateral and contralateral sides of the spinal cord (Figs. 6 and 7).
- Mean relative phosphorylated NR2B subunit protein level
- The mean relative level of the phosphorylated NR2B subunit of NMDA receptors is significantly increased in the DM group compared to the control group (P<0.05). The administration of ifenprodil at both lower and higher doses on DM rats significantly inhibited the phosphorylation of the NR2B subunit of the NMDA receptors ipsilaterally and contralaterally (P<0.001). No significant difference is detected in the inhibition of phosphorylation of the NR2B subunit of the NMDA receptors between the doses of ifenprodil given (Figs. 8 and 9).
RESULTS
- As demonstrated in the present study, the rats in the DM group exhibited a marked reduction in the percentage of body weight gain, demonstrated higher tactile allodynia and hyperalgesia effects at 2 weeks after the induction of diabetes and maintained as hyperglycemic throughout the experimental period as determined by the blood glucose level taken on day 0, 3, 14, and 22. This effect was accompanied by a higher expression of the total and the phosphorylated NR2B subunit of the NMDA receptors as demonstrated by both the immunohistochemistry and Western blot analyses. The treatment of ifenprodil however reversed these effects.
- The previous reports demonstrated that the administration of ifenprodil at the lateral hypothalamic area in the brain would suppress the feeding satiety in the animals and this leads to the reduction in body weight. This suppression suggests that the feeding-related lateral hypothalamic area may contain the NR2A and/or NR2B subunits NMDA receptor and blockade of this subunit receptor will affect feeding satiety and food intake [2122]. However, another previous study that administered ifenprodil at the hindbrain area demonstrated that ifenprodil did not participate in increased food intake effect which was not similar to the MK 801 action in this area [23]. In this study, the DM rats treated with ifenprodil intrathecal especially at a higher dose (I 1.0) exhibited a marked higher percentage of body weight gain compared to the untreated DM rats. The rats used in the present study were diabetic, and the treatment was done by intrathecal in the spinal cord area. Therefore, it is unclear how the ifenprodil acts on the feeding satiety and body weight reduction effects, since all these control areas are localized in the brain. It could be possible that the diabetic and ifenprodil treatment may influence another pathway(s) that may regulate the feeding behaviour or other possible pathways leading to body weight gain in these group rats, which needed to be discovered in future.
- The intrathecal delivery of the ifenprodil treatment is also shown to suppress tactile allodynia in both the hind paws and formalin-induced nociceptive responses. A similar finding was reported by Zhang et al. [24] in the chronic dorsal root ganglia compression rat model. The sprouting of A-fibres in the spinal cord which is responsible for proprioception and the somatic motor is one of the central mechanisms responsible for the generation of tactile allodynia. When the peripheral nerve is damaged, it induces the sprouting of Aβ-fibre terminals from the deeper laminae to the superficial laminae of the spinal cord. Since the NR2B subunit of the NMDA receptors is mainly localized in the superficial laminae, it may explain the preferential of this subunit for mediating the tactile allodynia [25]. This may also explain the reduction of the allodynic state in the DM rats treated with intrathecal ifenprodil on day 22 (post-intervention) on both the right and left hind paws in this study. The induction of A-fibre sprouting after the nerve damage may also describe the allodynic effect in the DM rats on day 14 until day 22 in both of their hind paws. Both developments of thermal hyperalgesia and tactile allodynia involve supraspinal sites, possibly dorsal column nuclei [26]. Ifenprodil possibly suppresses the pain transmission in the spinal cord by attenuating the descending excitatory influences. It is also agreed by Chizh et al. [12] that ifenprodil might block the supraspinal site, or if such descending excitatory processes includes the spinal NMDA receptors, ifenprodil could specifically reduce the descending facilitation by inhibiting the NR2B-containing receptors in the spinal cord.
- In this study, although the DM rats exhibited allodynia, they did not develop thermal hyperalgesia as assessed by the hot-plate test. The results were similarly reported by previous studies [2728] although it may also be found to be inconsistent with most of the reported studies [2930]. Although it is intriguing, the peculiarity of the STZ-induced diabetic rats that develop allodynia but not thermal hyperalgesia is actually not unique. As an example, the development of allodynia and hyperalgesia but not followed by thermal hyperalgesia had been reported in the animal model of the sciatic nerve cryoneurolisis (SCN) [31]. This means that diabetic and SCN models of neuropathic pain are distinguishable from the other models of neuropathic pain such as chronic constriction injury, partial nerve ligation, and spinal nerve root ligation which produce both thermal hyperalgesia and allodynia at the ipsilateral side to the lesion. It can be suggested that the different types of peripheral nerve are selectively damaged in these models [27]. Moreover, the paw withdrawal responses to the noxious thermal signals are related to the supraspinal sensory processing [32] and it is also well-known that the thermal nociceptive activation does not stimulate as much mechanoreceptor signals like the mechanical stimulation do [33]. Thus, it is probable that the diminution of the low threshold mechanoreceptors or demyelination has occurred in the diabetic rats leading to the reduced mechanoreceptors. Plus, some inhibitory controls are possibly lost and destroyed, thus exaggerating these effects [27]. Furthermore, it has been reported that the content of substance P which participates in the development of nerve-injury related thermal hyperalgesia was reduced in the sciatic nerve [34] and spinal cord of the diabetic rats [27]. Hence, this could explain the reason for the non-development of thermal hyperalgesia in the DM rats in this study.
- The formalin test has two phases of pain (phase 1 and 2) in which phase 1 comprises of direct chemical stimulation of the pain receptors and local inflammatory processes, and phase 2 is caused by the neural mechanisms in the spinal cord level [35]. One to five percent of the formalin injection on the rat's hind paw produces long-lasting sensitization, as demonstrated by Fu et al. [36]. In general, the untreated DM rats in the present study have shown to robustly increase their nociceptive responses, and the responses are greater than those in the control rats. This indicates that hyperalgesia effect, as similarly reported by Courteix et al. [37], in the diabetic-induced PDN rat model. The DM rats showed a greater hyperalgesic state than the control rats during phase 1. During the early and late stages of phase 2, the untreated DM rats also exhibited a higher nociceptive response compared to the control rats indicating they were in severe pain and it could be developed into PDN.
- We expected that this effect could be due to the higher expression of the tNR2B subunit of the NMDA receptors and its phosphorylation in the spinal dorsal horn, as demonstrated by the immunohistochemistry and Western blot analyses, which may explain the persistent activation of the central sensitization after being injected with 5% formalin. This could be explained by a previous report of the phosphorylated NR2B subunit of the NMDA receptors in the spinal cord following an inflamed hind paw induced by CFA or mustard oil [8]. Guo et al. [8] agreed that the development of the hind paw inflammation and hyperalgesia are highly related to a rapid and prolonged increase in the phosphorylation of NR2B subunit of the NMDA receptors in the spinal cord.
- The present study also shows that the ifenprodil treatment at both doses (I 0.5 and I 1.0) can reduce the nociceptive responses during both phase 1 and 2 of the formalin test. Ifenprodil may inhibit the NR2B subunits of the NMDA receptors expressed on the neurons of small-diameter primary afferents [38] as well as the spinal dorsal horn. The previous studies have also agreed that NMDA receptors antagonists only had a minor effect on the pain-producing nociceptive response seen during phase 1, but potently eliminate the phase 2′s reactions after the formalin-induced inflammatory pain [36]. A study by Tan et al. [39] discovered that the NMDA-2B knock-down rats were shown to attenuate to the formalin-induced pain behaviour after the intrathecal administration of the small interfering RNAs. Besides that, Zhang et al. [24] reported that the NR2B subunit of the NMDA receptors showed a distribution related to small diameter fibres in lamina I and II, suggesting the presence of primary afferent origin and post-synaptically on the dorsal horn neurons. Therefore, in this study, the attenuation of allodynia and formalin-induced inflammatory pain behaviour of the formalin test using ifenprodil is highly believed to be contributed by the suppression of the NR2B subunit and its tyrosine phosphorylation. Taken together, it may prove that the activation of the spinal cord NR2B is involved in the development of PDN although its distribution is quite limited in the superficial laminae of the rat's spinal cord [6].
- In the present study, the higher or lower expressions and mean relative of the total and phosphorylated NR2B subunit of NMDA receptors were prominent not only at the ipsilateral side but also at the contralateral side of the spinal cord of the rats. This bilateral expression of these proteins is suggested due to the ‘mirror’ pain effect. Aloisi et al. [40] believed that when 5% of the formalin solution was given to one of the rat's hind paw (ipsilateral side) at the intraplantar region. Therefore, the mirror pain effect was detected on the other non-injected hind paw (contralateral side). It is believed that this mirror pain effect is derived from an altered spinal processing of the incoming sensory inputs, specifically mediated by the NMDA or neurokinin receptors which are assumed to play a major function in the persistent nociceptive mechanisms after the formalin injection.
- In conclusion, we suggest that the higher allodynic and hyperalgesic effects as shown in the STZ-induced diabetic rats could be the indicator that the rats develop into the PDN. The development of the PDN could directly involve the modulation of the pain process by upregulating the phosphorylation of the NR2B subunit of the NMDA receptors in the superficial dorsal horn of the rats' spinal cord in this study, which is similar with the mechanism of other neuropathic pain rat models. There are other possible factors that contribute to the development of PDN in STZ-induced diabetic rats such as the role of the glial cells that may be involved in the development of neuropathic pain. This needs to be investigated in future studies in order to elucidate the mechanism of development of the PDN in STZ-induced diabetic rats.
DISCUSSION
-
Acknowledgements
- We would like to thank the Physiology Laboratory, Cranial and Maxillofacial and ARASC staffs for their technical assistance. We also thanked Universiti Sains Malaysia for the research funding (RUI 1001/PPSK/812139) and Government of Malaysia for the Fundamental Research Grant Scheme (FRGS 203/PPSK/6171189).
ACKNOWLEDGMENTS
-
CONFLICTS OF INTEREST: No potential conflict of interest relevant to this article was reported.
NOTES
- 1. Stogdale L. Definition of diabetes mellitus. Cornell Vet 1986;76:156-174. PubMed
- 2. Zochodne DW, Malik RA. Chapter 5, Painful diabetic neuropathy: clinical aspects. Handbook of clinical neurology: diabetes and the nervous system. Amsterdam: Elsevier; 2014. p. 53-61.
- 3. Calcutt NA, Backonja MM. Pathogenesis of pain in peripheral diabetic neuropathy. Curr Diab Rep 2007;7:429-434. ArticlePubMedPDF
- 4. Wu HY, Hsu FC, Gleichman AJ, Baconguis I, Coulter DA, Lynch DR. Fyn-mediated phosphorylation of NR2B Tyr-1336 controls calpain-mediated NR2B cleavage in neurons and heterologous systems. J Biol Chem 2007;282:20075-20087. ArticlePubMedPMC
- 5. Loftis JM, Janowsky A. The N-methyl-D-aspartate receptor subunit NR2B: localization, functional properties, regulation, and clinical implications. Pharmacol Ther 2003;97:55-85. ArticlePubMed
- 6. Qu XX, Cai J, Li MJ, Chi YN, Liao FF, Liu FY, Wan Y, Han JS, Xing GG. Role of the spinal cord NR2B-containing NMDA receptors in the development of neuropathic pain. Exp Neurol 2009;215:298-307. ArticlePubMed
- 7. Nagy GG, Watanabe M, Fukaya M, Todd AJ. Synaptic distribution of the NR1, NR2A and NR2B subunits of the N-methyl-d-aspartate receptor in the rat lumbar spinal cord revealed with an antigen-unmasking technique. Eur J Neurosci 2004;20:3301-3312. ArticlePubMed
- 8. Guo W, Zou S, Guan Y, Ikeda T, Tal M, Dubner R, Ren K. Tyrosine phosphorylation of the NR2B subunit of the NMDA receptor in the spinal cord during the development and maintenance of inflammatory hyperalgesia. J Neurosci 2002;22:6208-6217. ArticlePubMedPMC
- 9. Wei F, Wang GD, Kerchner GA, Kim SJ, Xu HM, Chen ZF, Zhuo M. Genetic enhancement of inflammatory pain by forebrain NR2B overexpression. Nat Neurosci 2001;4:164-169. ArticlePubMedPDF
- 10. Miki K, Zhou QQ, Guo W, Guan Y, Terayama R, Dubner R, Ren K. Changes in gene expression and neuronal phenotype in brain stem pain modulatory circuitry after inflammation. J Neurophysiol 2002;87:750-760. ArticlePubMed
- 11. Williams K. Ifenprodil discriminates subtypes of the N-methyl-D-aspartate receptor: selectivity and mechanisms at recombinant heteromeric receptors. Mol Pharmacol 1993;44:851-859. PubMed
- 12. Chizh BA, Reissmuller E, Schlutz H, Scheede M, Haase G, Englberger W. Supraspinal vs spinal sites of the antinociceptive action of the subtype-selective NMDA antagonist ifenprodil. Neuropharmacology 2001;40:212-220. ArticlePubMed
- 13. Chizh BA, Headley PM, Tzschentke TM. NMDA receptor antagonists as analgesics: focus on the NR2B subtype. Trends Pharmacol Sci 2001;22:636-642. ArticlePubMed
- 14. Boyce S, Wyatt A, Webb JK, O’Donnell R, Mason G, Rigby M, Sirinathsinghji D, Hill RG, Rupniak NM. Selective NMDA NR2B antagonists induce antinociception without motor dysfunction: correlation with restricted localisation of NR2B subunit in dorsal horn. Neuropharmacology 1999;38:611-623. ArticlePubMed
- 15. Zulazmi NA, Gopalsamy B, Farouk AA, Sulaiman MR, Bharatham BH, Perimal EK. Antiallodynic and antihyperalgesic effects of zerumbone on a mouse model of chronic constriction injury-induced neuropathic pain. Fitoterapia 2015;105:215-221. ArticlePubMed
- 16. Daulhac L, Maffre V, Mallet C, Etienne M, Privat AM, Kowalski-Chauvel A, Seva C, Fialip J, Eschalier A. Phosphorylation of spinal N-methyl-D-aspartate receptor NR1 subunits by extracellular signal-regulated kinase in dorsal horn neurons and microglia contributes to diabetes-induced painful neuropathy. Eur J Pain 2011;15:169
- 17. Ma C. Animal models of pain. Int Anesthesiol Clin 2007;45:121-131.Article
- 18. Lu R, Schmidtko A. Direct intrathecal drug delivery in mice for detecting in vivo effects of cGMP on pain processing. Methods Mol Biol 2013;1020:215-221. ArticlePubMed
- 19. Dubuisson D, Dennis SG. The formalin test: a quantitative study of the analgesic effects of morphine, meperidine, and brain stem stimulation in rats and cats. Pain 1977;4:161-174. ArticlePubMed
- 20. Fu KY, Light AR, Matsushima GK, Maixner W. Microglial reactions after subcutaneous formalin injection into the rat hind paw. Brain Res 1999;825:59-67. ArticlePubMed
- 21. Stanley BG, Urstadt KR, Charles JR, Kee T. Glutamate and GABA in lateral hypothalamic mechanisms controlling food intake. Physiol Behav 2011;104:40-46. ArticlePubMed
- 22. Khan AM, Curras MC, Dao J, Jamal FA, Turkowski CA, Goel RK, Gillard ER, Wolfsohn SD, Stanley BG. Lateral hypothalamic NMDA receptor subunits NR2A and/or NR2B mediate eating: immunochemical/behavioral evidence. Am J Physiol 1999;276(3 Pt 2):R880-R891. ArticlePubMed
- 23. Anson JA. Feeding in response to site-selective antagonists of hindbrain NMDA receptors [dissertation]. Pullman: University Honors College, Washington State University; 2004.
- 24. Zhang W, Shi CX, Gu XP, Ma ZL, Zhu W. Ifenprodil induced antinociception and decreased the expression of NR2B subunits in the dorsal horn after chronic dorsal root ganglia compression in rats. Anesth Analg 2009;108:1015-1020. ArticlePubMed
- 25. Bolay H, Moskowitz MA. Mechanisms of pain modulation in chronic syndromes. Neurology 2002;59(5 Suppl 2):S2-S7.Article
- 26. Sung B, Na HS, Kim YI, Yoon YW, Han HC, Nahm SH, Hong SK. Supraspinal involvement in the production of mechanical allodynia by spinal nerve injury in rats. Neurosci Lett 1998;246:117-119. ArticlePubMed
- 27. Malcangio M, Tomlinson DR. A pharmacologic analysis of mechanical hyperalgesia in streptozotocin/diabetic rats. Pain 1998;76:151-157. ArticlePubMed
- 28. Khan GM, Chen SR, Pan HL. Role of primary afferent nerves in allodynia caused by diabetic neuropathy in rats. Neuroscience 2002;114:291-299. ArticlePubMed
- 29. Anjaneyulu M, Chopra K. Quercetin, a bioflavonoid, attenuates thermal hyperalgesia in a mouse model of diabetic neuropathic pain. Prog Neuropsychopharmacol Biol Psychiatry 2003;27:1001-1005. ArticlePubMed
- 30. Sharma S, Kulkarni SK, Agrewala JN, Chopra K. Curcumin attenuates thermal hyperalgesia in a diabetic mouse model of neuropathic pain. Eur J Pharmacol 2006;536:256-261. ArticlePubMed
- 31. DeLeo JA, Coombs DW, Willenbring S, Colburn RW, Fromm C, Wagner R, Twitchell BB. Characterization of a neuropathic pain model: sciatic cryoneurolysis in the rat. Pain 1994;56:9-16. ArticlePubMed
- 32. Pabreja K, Dua K, Sharma S, Padi SS, Kulkarni SK. Minocycline attenuates the development of diabetic neuropathic pain: possible anti-inflammatory and anti-oxidant mechanisms. Eur J Pharmacol 2011;661:15-21. ArticlePubMed
- 33. Besson JM, Chaouch A. Peripheral and spinal mechanisms of nociception. Physiol Rev 1987;67:67-186. ArticlePubMed
- 34. Diemel LT, Stevens EJ, Willars GB, Tomlinson DR. Depletion of substance P and calcitonin gene-related peptide in sciatic nerve of rats with experimental diabetes; effects of insulin and aldose reductase inhibition. Neurosci Lett 1992;137:253-256. ArticlePubMed
- 35. Hayati AA, Zalina I, Myo T, Badariah AA, Azhar A, Idris L. Modulation of formalin-induced fos-like immunoreactivity in the spinal cord by swim stress-induced analgesia, morphine and ketamine. Ger Med Sci 2008;6:Doc05. PubMedPMC
- 36. Fu KY, Light AR, Maixner W. Long-lasting inflammation and long-term hyperalgesia after subcutaneous formalin injection into the rat hindpaw. J Pain 2001;2:2-11. ArticlePubMed
- 37. Courteix C, Eschalier A, Lavarenne J. Streptozocin-induced diabetic rats: behavioural evidence for a model of chronic pain. Pain 1993;53:81-88. ArticlePubMed
- 38. Ma QP, Hargreaves RJ. Localization of N-methyl-D-aspartate NR2B subunits on primary sensory neurons that give rise to small-caliber sciatic nerve fibers in rats. Neuroscience 2000;101:699-707. ArticlePubMed
- 39. Tan PH, Yang LC, Shih HC, Lan KC, Cheng JT. Gene knockdown with intrathecal siRNA of NMDA receptor NR2B subunit reduces formalin-induced nociception in the rat. Gene Ther 2005;12:59-66. ArticlePubMedPDF
- 40. Aloisi AM, Porro CA, Cavazzuti M, Baraldi P, Carli G. ‘Mirror pain’ in the formalin test: behavioral and 2-deoxyglucose studies. Pain 1993;55:267-273. ArticlePubMed
REFERENCES
(A) Tactile allodynia represented by von Frey test between the groups on day 0 (baseline), day 14 (pre-intervention), and day 22 (post-intervention) on the left hind paw (n=8). (B) Tactile allodynia represented by von Frey test between the groups on day 0 (baseline), day 14 (pre-intervention), and day 22 (post-intervention) on the right hind paw (n=8). DM, diabetes mellitus. aP<0.001 significant compared to control group, bP<0.001 significant compared to DM group, cP<0.05 significant compared to DM group.

Duration of paw licking or jumping by hot-plate test between the groups (n=8). Values are expressed as mean±standard error of the mean. No significant differences were detected between groups. DM, diabetes mellitus.

Chemical hyperalgesia represented by nociceptive response between the groups (mean±standard error of the mean) (n=8). DM, diabetes mellitus. aP<0.05 significant compared to control group, bP<0.05 compared to DM group, cP<0.001 significant compared to DM and control groups.
Immunohistochemistry image showed the total expression of total NR2B subunit positive neurons (tNR2B) in laminae I-II on ipsilateral (i) and contralateral (c) sides of rat spinal cord at 40× magnification. (A) The positive control for NR2B subunit in the rat's brain (thalamus) whilst. (B) The negative control in the rat's spinal cord region. (C) Control group. (D) Diabetes mellitus group. (E) (I 0.5) group. (F) (I 1.0) group. Arrows indicate the dark staining of tNR2B subunit positive neuron expression.
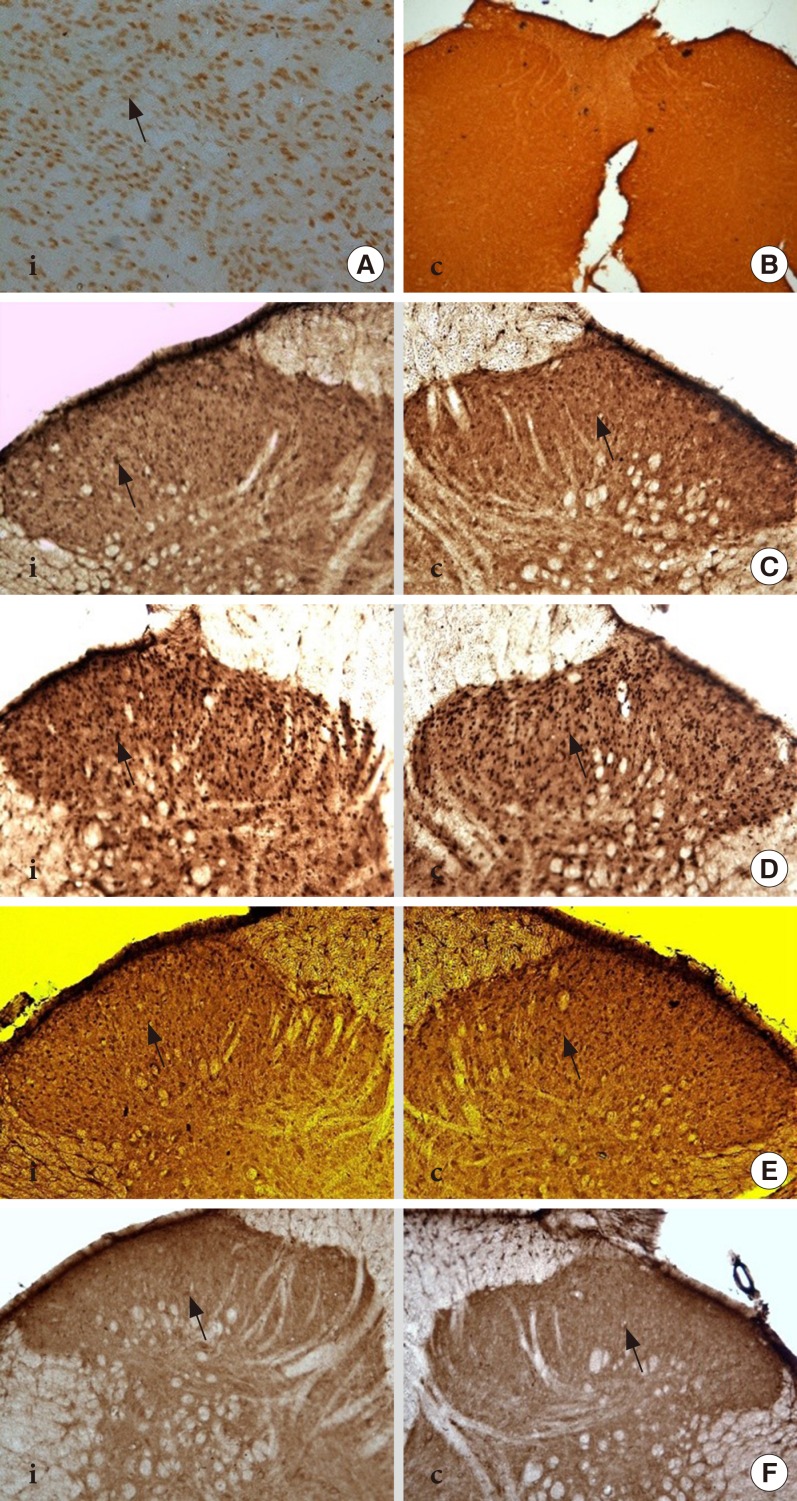
Immunohistochemistry image showed the expression of phosphorylated-NR2B subunit positive neurons in laminae I-II on ipsilateral (i) and contralateral (c) sides of rat spinal cord at 40× magnification. (A) The positive control for phosphorylated-NR2B subunit in the rat's brain (thalamic region) whilst. (B) The negative control in the rat's spinal cord region. (C) Control group. (D) Diabetes mellitus group. (E) (I 0.5) group. (F) (I 1.0) group. Arrows indicate the dark staining of phosphorylated-NR2B subunit positive neurons.

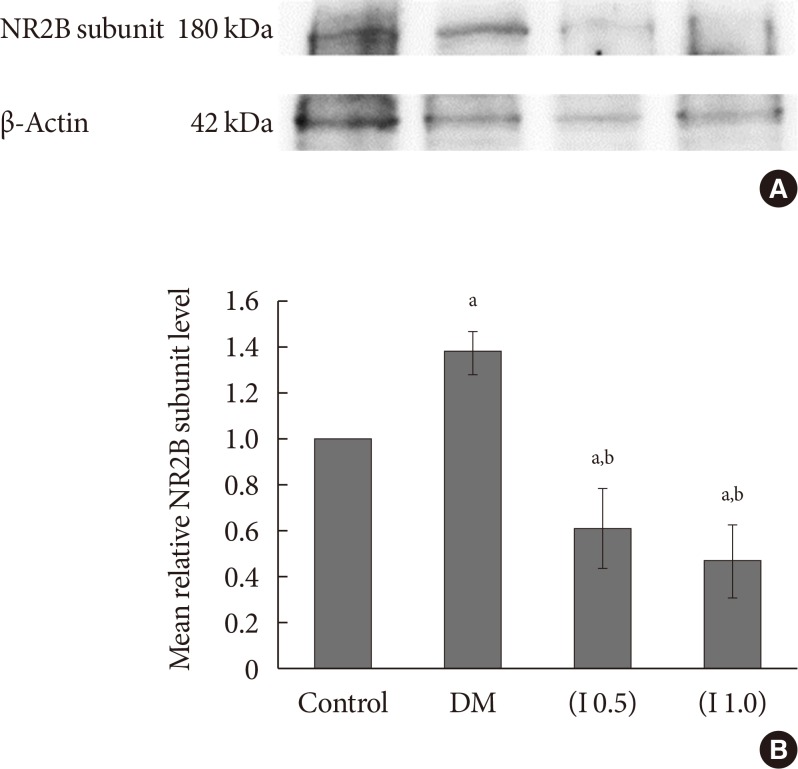
(A) A representative example of Western blot results for total NR2B subunit on the ipsilateral side between all groups with quantification analysis of the integrated density value. (B) Columns represent the mean relative total NR2B subunit protein level±standard error of the mean for eight separate experiments. The mean relative total NR2B subunit protein level (fold change) represents comparative levels of the total NR2B subunit protein in the experimental groups (diabetes mellitus [DM], DM group treated with ifenprodil at lower dose, I 0.5 and DM group treated with ifenprodil at higher dose, I 1.0) over the calibrator group (control group) after normalization by its loading control (housekeeping protein, β-actin protein) (n=8 for each group). aP<0.05 compared to control group, bP<0.001 compared to DM group.

(A) A representative example of Western blot results for total NR2B subunit on the contralateral side between all groups with quantification analysis of the integrated density value. (B) Columns represent the mean relative total NR2B subunit protein level±standard error of the mean for eight separate experiments. The mean relative total NR2B subunit protein level (fold change) represents comparative levels of the total NR2B subunit protein in the experimental groups (diabetes mellitus [DM], DM group treated with ifenprodil at lower dose, I 0.5 and DM group treated with ifenprodil at higher dose, I 1.0) over the calibrator group (control group) after normalization by its loading control (housekeeping protein, β-actin protein) (n=8 for each group). aP<0.05 compared to control group, bP<0.001 compared to DM group.
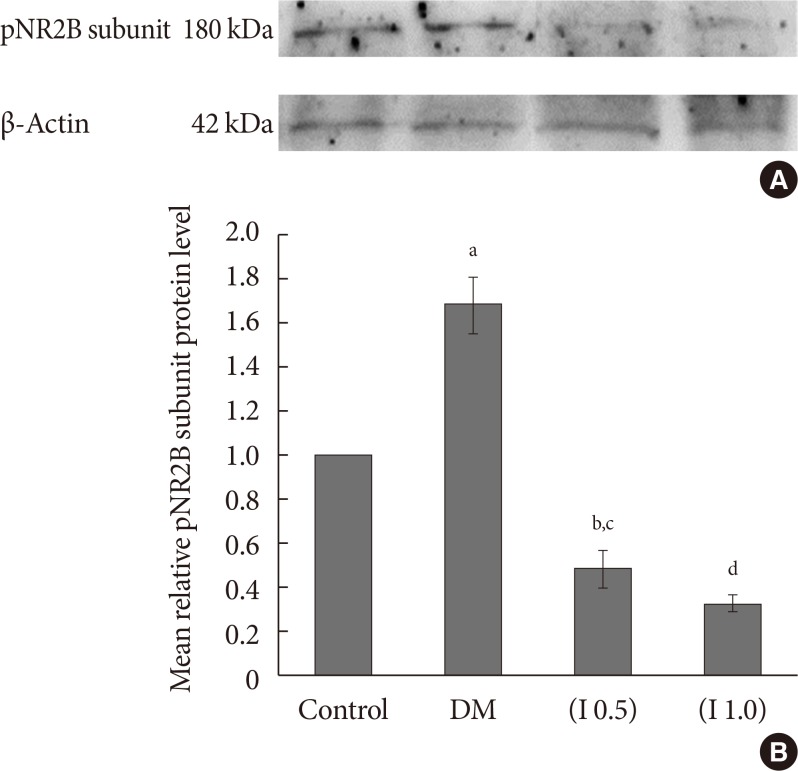
(A) A representative example of Western blot results for phosphorylated NR2B (pNR2B) subunit on the ipsilateral side between all groups with quantification analysis of the integrated density value. (B) Columns represent the mean relative pNR2B subunit protein level±standard error of the mean for eight separate experiments. The mean relative pNR2B subunit protein level (fold change) represents comparative levels of the pNR2B subunit protein in the experimental groups (diabetes mellitus [DM], DM group treated with ifenprodil at a lower dose, I 0.5 and painful diabetic neuropathy group treated with ifenprodil at a higher dose, I 1.0) over the calibrator group (control group) after normalization by its loading control (housekeeping protein, β-actin protein) (n=8 for each group). aP<0.001 compared to control group, bP<0.05 compared to control group, cP<0.001 compared to DM group, dP<0.001 compared to DM group and control groups.
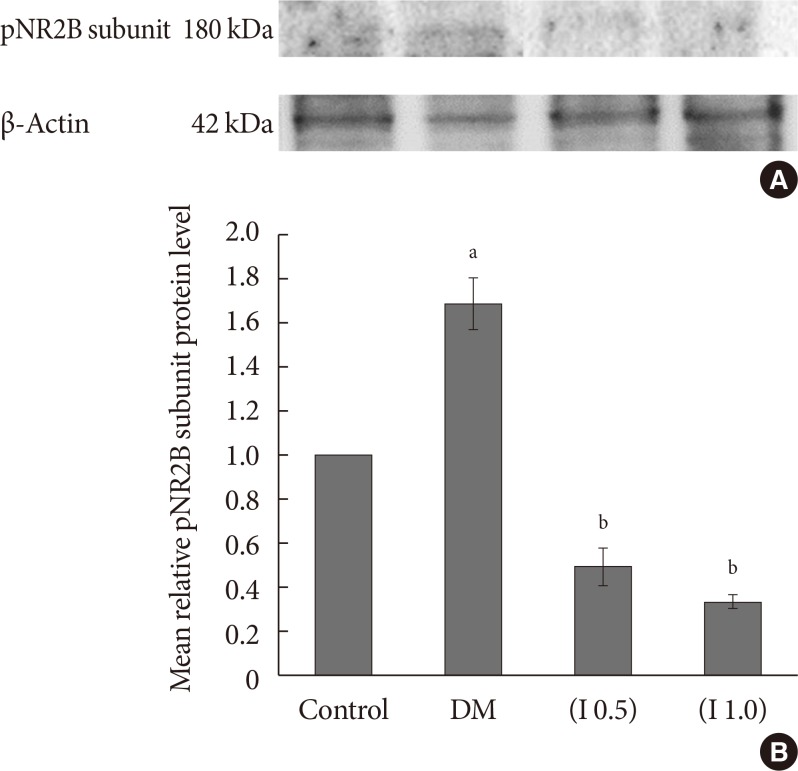
(A) A representative example of Western blot results for phosphorylated NR2B (pNR2B) subunit on the contralateral side between all groups with quantification analysis of the integrated density value. (B) Columns represent the mean relative pNR2B subunit protein level±standard error of the mean for eight separate experiments. The mean relative pNR2B subunit protein level (fold change) represents comparative levels of the pNR2B subunit protein in the experimental groups (diabetes mellitus [DM], DM group treated with Ifenprodil at a lower dose, I 0.5 and DM group treated with Ifenprodil at a higher dose, I 1.0) over the calibrator group (control group) after normalization by its loading control (housekeeping protein, β-actin protein) (n=8 for each group). aP<0.05 compared to control group, bP<0.001 significant compared to DM and control groups.
Percentage of change of body weight and blood glucose level between the groups (n=8)
Total number of tNR2B and pNR2B positive neurons on ipsilateral and contralateral sides for all groups 3 days after formalin injection (n=8)
Values are presented as mean±standard deviation.
tNR2B, total NR2B subunit; pNR2B, phosphorylated NR2B subunit; DM, diabetes mellitus.
aP<0.001 compared to control group, bP<0.05 compared to control group, cP<0.001 compared to DM group, dP<0.001 compared to DM and control groups, eP<0.001 compared to (I 0.5) group, fP<0.05 compared to (I 0.5) group.
Figure & Data
References
Citations
- Painful diabetic neuropathy: The role of ion channels
Qi Wang, Yifei Ye, Linghui Yang, Lifan Xiao, Jin Liu, Wensheng Zhang, Guizhi Du
Biomedicine & Pharmacotherapy.2024; 173: 116417. CrossRef - Therapeutic potential of progesterone in spinal cord injury‐induced neuropathic pain: At the crossroads between neuroinflammation and N‐methyl‐D‐aspartate receptor
Sol Ferreyra, Susana González
Journal of Neuroendocrinology.2023;[Epub] CrossRef - Chemical, pharmacodynamic and pharmacokinetic characterization of the GluN2B receptor antagonist 3-(4-phenylbutyl)-2,3,4,5-tetrahydro-1H-3-benzazepine-1,7-diol – starting point for PET tracer development
Marvin Korff, Ruben Steigerwald, Elena Bechthold, Dirk Schepmann, Julian A. Schreiber, Sven G. Meuth, Guiscard Seebohm, Bernhard Wünsch
Biological Chemistry.2023; 404(4): 279. CrossRef - Mechanisms of Transmission and Processing of Pain: A Narrative Review
Girolamo Di Maio, Ines Villano, Ciro Rosario Ilardi, Antonietta Messina, Vincenzo Monda, Ashlei Clara Iodice, Chiara Porro, Maria Antonietta Panaro, Sergio Chieffi, Giovanni Messina, Marcellino Monda, Marco La Marra
International Journal of Environmental Research and Public Health.2023; 20(4): 3064. CrossRef - Indazole as a Phenol Bioisostere: Structure–Affinity Relationships of GluN2B-Selective NMDA Receptor Antagonists
Judith Lüken, Gunnar Goerges, Nadine Ritter, Paul Disse, Julian A. Schreiber, Judith Schmidt, Bastian Frehland, Dirk Schepmann, Guiscard Seebohm, Bernhard Wünsch
Journal of Medicinal Chemistry.2023; 66(16): 11573. CrossRef - Synthesis of oxazolo‐annulated 3‐benzazepines designed by merging two negative allosteric NMDA receptor modulators
Alexander Markus, Dirk Schepmann, Bernhard Wünsch
Archiv der Pharmazie.2022;[Epub] CrossRef - Phenol—Benzoxazolone bioisosteres: Synthesis and biological evaluation of tricyclic GluN2B‐selective N‐methyl‐d‐aspartate receptor antagonists
Alexander Markus, Julian A. Schreiber, Gunnar Goerges, Bastian Frehland, Guiscard Seebohm, Dirk Schepmann, Bernhard Wünsch
Archiv der Pharmazie.2022;[Epub] CrossRef - Ifenprodil Reduced Expression of Activated Microglia, BDNF and DREAM Proteins in the Spinal Cord Following Formalin Injection During the Early Stage of Painful Diabetic Neuropathy in Rats
Che Aishah Nazariah Ismail, Rapeah Suppian, Che Badariah Ab Aziz, Idris Long
Journal of Molecular Neuroscience.2021; 71(2): 379. CrossRef - Ifenprodil Stereoisomers: Synthesis, Absolute Configuration, and Correlation with Biological Activity
Elena Bechthold, Julian A. Schreiber, Kirstin Lehmkuhl, Bastian Frehland, Dirk Schepmann, Freddy A. Bernal, Constantin Daniliuc, Inés Álvarez, Cristina Val Garcia, Thomas J. Schmidt, Guiscard Seebohm, Bernhard Wünsch
Journal of Medicinal Chemistry.2021; 64(2): 1170. CrossRef - The anti-diabetic effects of betanin in streptozotocin-induced diabetic rats through modulating AMPK/SIRT1/NF-κB signaling pathway
Nasim Abedimanesh, Somayyeh Asghari, Kosar Mohammadnejad, Zahra Daneshvar, Soudeh Rahmani, Samaneh Shokoohi, Amir Hasan Farzaneh, Seyed Hojjat Hosseini, Iraj Jafari Anarkooli, Maryam Noubarani, Sina Andalib, Mohammad Reza Eskandari, Behrooz Motlagh
Nutrition & Metabolism.2021;[Epub] CrossRef - Diabetic neuropathy and neuropathic pain: a (con)fusion of pathogenic mechanisms?
Nigel A. Calcutt
Pain.2020; 161(Supplement): S65. CrossRef - N-Acetylcysteine causes analgesia in a mouse model of painful diabetic neuropathy
Serena Notartomaso, Pamela Scarselli, Giada Mascio, Francesca Liberatore, Emanuela Mazzon, Santa Mammana, Agnese Gugliandolo, Giorgio Cruccu, Valeria Bruno, Ferdinando Nicoletti, Giuseppe Battaglia
Molecular Pain.2020; 16: 174480692090429. CrossRef - Effect of aerobic exercise on innate immune responses and inflammatory mediators in the spinal cord of diabetic rats
A. Kaki, M. Nikbakht, A.H. Habibi, H.F. Moghadam
Comparative Exercise Physiology.2020; 16(4): 293. CrossRef
 PubReader
 Cite
Cite