- Current
- Browse
- Collections
-
For contributors
- For Authors
- Instructions to authors
- Article processing charge
- e-submission
- For Reviewers
- Instructions for reviewers
- How to become a reviewer
- Best reviewers
- For Readers
- Readership
- Subscription
- Permission guidelines
- About
- Editorial policy
Articles
- Page Path
- HOME > Diabetes Metab J > Volume 41(2); 2017 > Article
-
Original ArticleObesity and Metabolic Syndrome Regulating Hypothalamus Gene Expression in Food Intake: Dietary Composition or Calorie Density?
-
Mi Jang, So-Young Park, Yong-Woon Kim, Seung-Pil Jung, Jong-Yeon Kim

-
Diabetes & Metabolism Journal 2017;41(2):121-127.
DOI: https://doi.org/10.4093/dmj.2017.41.2.121
Published online: December 16, 2016
Obesity-Diabetes Advanced Research Center, Yeungnam University College of Medicine, Daegu, Korea.
- Corresponding author: Jong-Yeon Kim. Obesity-Diabetes Advanced Research Center, Yeungnam University College of Medicine, 170 Hyeonchung-ro, Nam-gu, Daegu 42415, Korea. jykim@ynu.ac.kr
• Received: July 8, 2016 • Accepted: September 13, 2016
Copyright © 2017 Korean Diabetes Association
This is an Open Access article distributed under the terms of the Creative Commons Attribution Non-Commercial License (http://creativecommons.org/licenses/by-nc/4.0/) which permits unrestricted non-commercial use, distribution, and reproduction in any medium, provided the original work is properly cited.
ABSTRACT
-
Background
- The proportion of saturated fatty acids/unsaturated fatty acids in the diet seems to act as a physiological regulation on obesity, cardiovascular diseases, and diabetes. Differently composed fatty acid diets may induce satiety of the hypothalamus in different ways. However, the direct effect of the different fatty acid diets on satiety in the hypothalamus is not clear.
-
Methods
- Three experiments in mice were conducted to determine whether: different compositions of fatty acids affects gene mRNA expression of the hypothalamus over time; different types of fatty acids administered into the stomach directly affect gene mRNA expression of the hypothalamus; and fat composition changes in the diet affects gene mRNA expression of the hypothalamus.
-
Results
- The type of fat in cases of purified fatty acid administration directly into the stomach may cause changes of gene expressions in the hypothalamus. Gene expression by dietary fat may be regulated by calorie amount ingested rather than weight amount or type of fat.
-
Conclusion
- Therefore, the calorie density factor of the diet in regulating hypothalamic gene in food intake may be detrimental, although the possibility of type of fat cannot be ruled out.
- Obesity is a global health epidemic. A high-fat/caloric diet leads to overweight and obesity, which are strongly associated with the increasing prevalence of more severe chronic diseases [1]. In simple terms, obesity occurs when energy intake exceeds expenditure [2]. The central nervous system has mechanisms to maintain homeostasis of body weight, which is tightly regulated by central and peripheral signals reflecting the availability of body energy [2]. Despite these mechanisms, when humans or rodents are exposed to calorie-rich diets, these mechanisms fail and they become obese [3]. In both male and female rodents, a high fat diet compared to a low-fat diet stimulates weight gain, largely due to increased caloric intake [4]. Diets that are rich in calories are considered to be an important cause of visceral obesity and insulin resistance [4], but the effect of dietary fat on disease risk is controversial. Most studies have found that a diet low in saturated fat or diets in which saturated fat is partially replaced with polyunsaturated fat decreases the risks of cardiovascular diseases, diabetes, or death [567]. However, some research indicates that saturated fat is not associated with those diseases [89]. The proportion of saturated fatty acids (SFAs)/unsaturated fatty acids in the diet seems to act as a kind of physiological regulation on obesity, cardiovascular diseases, and diabetes. Saturated fat is related to decreased insulin signaling at the level of central nervous system, causing insulin resistance in the brain and overeating; thus, leading to obesity [2], which raises the question of whether n-3 polyunsaturated fatty acids (n-3 PUFAs) have different regulatory roles from other fatty acids [1011]. Intake of fish and long-chain n-3 PUFAs in young adulthood is inversely associated with metabolic syndrome later in life [12]. The n-3 PUFAs are beneficial in the secondary prevention of coronary heart disease, hypertension, and type 2 diabetes mellitus [13], are negatively associated with the plasma leptin level [14], and reduce the expression of leptin in vivo [1516]. Leptin regulates food intake and energy expenditure through neural and endocrine mechanisms mediated by the leptin receptors and their downstream satiety regulators, such as orexigenic neuropeptide Y (NPY) and anorexigenic pro-opiomelanocortin (POMC) [17]. Differently composed fatty acid diets may induce satiety of the brain in different ways. However, the direct effect of the different fatty acid diets on satiety in the hypothalamus is not clear.
- In this study, gene expressions associated with the food intake regulation of the hypothalamus were analyzed using real-time polymerase chain reaction (PCR) to examine the effect of different types of purified fatty acid and dietary fat composition on hypothalamic gene expressions. Thus, the objective of this study was to assess whether the fat composition change in the diet differentially affects hypothalamic gene expressions.
INTRODUCTION
- Animals
- Male C57BL/6N mice were purchased from the Koatech Experimental Animal Center (Pyeongtaek, Korea), weighing 25 to 30 g (12 weeks of age). Animals were maintained at 22℃±2℃, humidity of 55%±5%, with a 12-hour:12-hour light-dark cycle (7:00 AM to 7:00 PM).
- All applicable institutional and governmental regulations concerning the ethical use of animals were certified before and during this research and approved by the Institutional Animal Care and Use Committee of Yeungnam University.
- Experimental designs
- Experiments were designed to evaluate the effect of fatty acid profiles on hypothalamic gene expressions in food intake regulation of mice. For this goal, three experiments were conducted to determine whether: (1) fatty acid ingestion affects gene mRNA expression of the hypothalamus over time; (2) different types of fatty acids administered into the stomach directly affect gene mRNA expression of the hypothalamus; and (3) fat composition changes in the diet affect gene mRNA expression of the hypothalamus. Fatty acids (0.4 mg/g body weight) dissolved in dimethyl sulfoxide (DMSO, 5 µL/g body weight; Sigma, St. Louis, MO, USA) in experiments 1 and 2 were administered into the stomach directly after overnight fasting. DMSO was used because of poor fatty acid solubility in other solvents, such as ethanol and water. Mice were divided into control (DMSO) and SFA administration groups for experiment 1, and gene expressions were measured at 0 (n=4), 0.5 (n=3), 1 (n=3), 2 (n=3), and 5 hours (n=3) after administration of fatty acid; control (DMSO, n=12), SFA (n=9), and n-3 PUFA (n=9) groups for experiment 2; and high carbohydrates (CHO; n=9) as control, high SFA (n=6), and high n-3 PUFA (n=6) diets groups for experiment 3. In experiment 2, SFA was stearic acid and n-3 PUFA was linolenic acid. In experiment 3, diets were provided from 6:00 PM to 10:00 AM the next day after 9 hours of fasting prior to the diet. The details of the composition of diets are presented in Table 1. Animals had free access to food and water for 15 hours. Mice were anesthetized by intraperitoneal injections of pentobarbital sodium (50 mg/kg body weight) immediately after the diet, and the hypothalamus was excised carefully.
- Quantitative real-time PCR
- The hypothalamus was homogenized in TRI reagent (Sigma-Aldrich, St. Louis, MO, USA) using a sonicator (Branson Sonifier 450; Branson Ultrasonics Corp., Danbury, CT, USA). RNA underwent reverse transcription to cDNA from 1 µg of total RNA using a High-Capacity cDNA Reverse Transcription Kit (Applied Biosystems, Foster City, CA, USA). Quantitative real-time PCR was performed using the real-time PCR 7500 system and Power SYBR Green PCR Master Mix (Applied Biosystems) according to the manufacturer's instructions. The expression level of β-actin was used as an internal control. The reactions were incubated at 95℃ for 10 minutes, followed by 45 cycles of 95℃ for 15 seconds, 55℃ for 20 seconds, and 72℃ for 35 seconds. The primers were: POMC sense AGG CCT GAC ACG TGG AAG AT; anti-sense AGG CAC CAG CTC CAC ACA T; NPY sense TCC GCT CTG CGA CAC TAC AT; anti-sense TGC TTT CCT TCA TTA AGA GGT CTG A; agouti-related protein (AgRP) sense TGC TAC TGC CGC TTC TTC AA anti-sense CTT TGC CCA AAC AAC ATC; and β-actin sense TAC TGC CCT GGC TCC TAG CA; anti-sense TGG ACA GTG AGG CCA GGA TAG (Bioneer, Daejeon, Korea).
- Statistical analysis
- Values are expressed as mean±standard error. The significance of the differences among groups was evaluated by one-way analysis of variance (ANOVA). When ANOVA revealed significant differences, post hoc analysis was conducted via the Newman-Keuls multiple range test. Null hypotheses of no difference were rejected if P values were less than 0.05.
METHODS
- Experiment 1. A time series of hypothalamic gene expressions by administration of saturated fatty acid dissolved in DMSO directly into the stomach
- To the best of our knowledge, there are no publications examining hypothalamic gene mRNA expressions after administration of fatty acids in a time series. Therefore, experiment 1 was conducted to assess the peak time of gene expressions after the administration of fatty acid into the stomach directly. The anorexigenic POMC mRNA expression increased gradually up to 2 hours and decreased at 5 hours after administration of SFA into the stomach (Fig. 1). There was no significant difference between orexigenic NPY and AgRP genes expressions from 0.5 to 5 hours after fatty acid administration (Fig. 1).
- Experiment 2. Hypothalamic gene expressions by different fatty acids administration dissolved in DMSO directly into the stomach
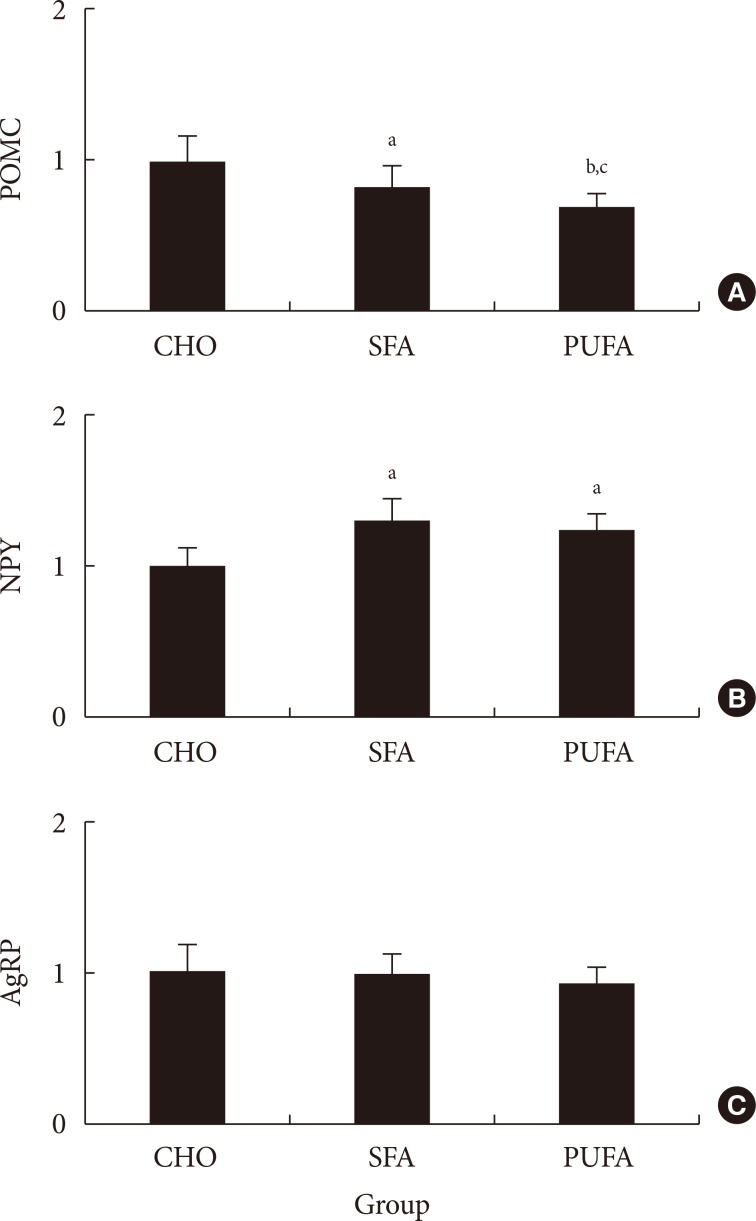
- The POMC, NPY, and AgRP mRNA expressions were measured 2 hours after administration of two types of fat dissolved in DMSO directly into the stomach. The POMC mRNA expressions of the hypothalamus in the group given SFA significantly increased to 238% (P<0.01) and n-3 PUFA to 151% (P<0.05), compared with the control group. The gene expression in the n-3 PUFA group was lower (P<0.05) than in the SFA group. The NPY mRNA expression of the hypothalamus in the SFA group did not differ significantly from the control, whereas gene expressions decreased to 59% in the n-3 PUFA group. The gene expression in the n-3 PUFA group was lower (P<0.01) than in the SFA group (Fig. 2). The AgRP mRNA expression of the hypothalamus in the SFA group did not differ significantly from the control, whereas the gene expressions decreased to 63% in the n-3 PUFA group. The gene expression in the n-3 PUFA group was lower (P<0.01) than in the SFA group (Fig. 2).
- Experiment 3. Hypothalamic gene expressions and food consumptions by fat composition change in the diet over 15 hours
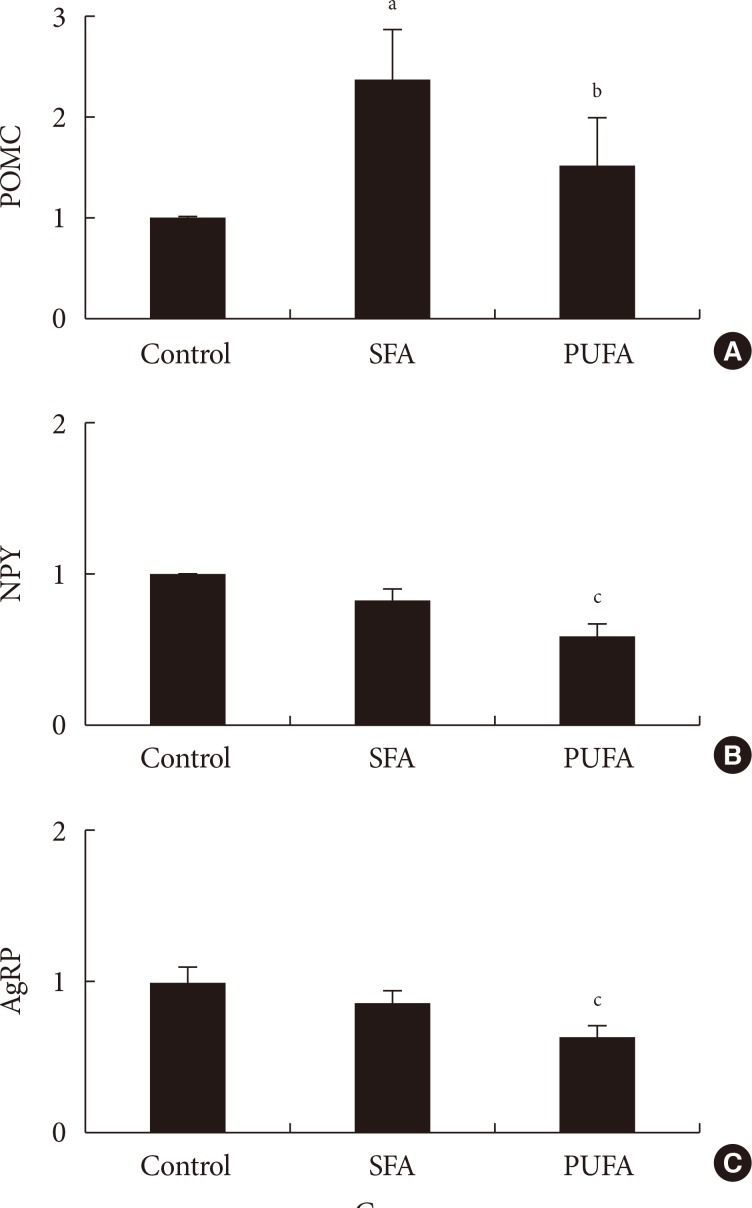
- The food intake was measured. The amount of food ingested in the CHO group was higher (P<0.01) than in high-fat diet groups, but the calories ingested were lower. There were no differences of food intake and plasma free fatty acid levels (data not shown) between SFA and n-3 PUFA groups (Table 2). The POMC mRNA expressions of the hypothalamus in the SFA group significantly decreased to 83% (P<0.05) and n-3 PUFA group to 70% (P<0.01) compared with the CHO group. The gene expression in the n-3 PUFA group was lower (P<0.05) than in the SFA group (Fig. 3). The NPY mRNA expression of the hypothalamus in the SFA and the n-3 PUFA groups were higher (P<0.05) compared with the CHO group (131% in SFA and 123% in the n-3 PUFA compared with CHO). There were no significant differences between SFA and n-3 PUFA groups. The AgRP mRNA expression of the CHO group did not differ from other groups (99% in SFA and 94% in n-3 PUFA compared with CHO) (Fig. 3). There was a strong correlation (r2=0.4332, P<0.001) between the ratio of NPY/POMC gene expressions and food intake in calorie amount, but not with food intake in weight amount (Fig. 4).
RESULTS
- The present study demonstrated that the purified different fatty acids have differential effects on hypothalamic gene expressions in mice, but the type of dietary fat do not. Body weight homeostasis is maintained through the balance between energy expenditure and energy intake. The hypothalamus in the central nervous system is the master regulator of energy intake, energy expenditure, and body weight balance [181920]. Hormones regulate food intake and energy expenditure through neural and endocrine mechanisms by the satiety regulators, such as NPY and POMC [21]. In addition to the hormonal signals entering the hypothalamus, the hypothalamic neurons also directly sense the nutrient signals in the blood, such as hyperglycemia and hyperlipidemia, and activate the regulatory processes of energy balance in the hypothalamus [222324]. According to experiment 1, the anorexigenic POMC gene expression peaked 2 hours after the administration of stearic acid, and orexigenic NPY and AgRP gene expressions were lowest 1 hour after administration of fatty acid, although not statistically significant. Therefore, gene expressions of experiment 2 were measured 2 hours after administration of saturated and n-3 PUFA dissolved in DMSO into stomach. The anorexigenic POMC gene expression of the hypothalamus in the n-3 PUFA group were significantly lower than in the SFA group in experiment 2. The orexigenic NPY and AgRP gene expressions of the hypothalamus in the n-3 PUFA group were also lower than in the SFA group. These data seemed logically untenable because both of anorexigenic and orexigenic genes expressions in the n-3 PUFA group were lower than in the SFA group. This discordance supports the hypothesis that hypothalamic gene expression in food regulation would be decisive by regulating which orexigenic or anorexigenic pathway is dominant [21]. Therefore, this result suggests that SFA may be more anorexigenic than n-3 PUFA when the anorexigenic POMC gene pathway is dominant, and if the orexigenic NPY and AgRP gene pathways are dominant, SFA may be more orexigenic than n-3 PUFA, although we do not yet know which pathway is dominant.
- The results from experiment 3 show that POMC gene expression is higher with the SFA diet than the n-3 PUFA diet, and higher in the CHO group than in SFA and PUFA diet groups. The NPY gene expressions in the SFA and n-3 PUFA groups were high compared with the CHO group. On the other hand, the NPY gene expression in the SFA group did not differ significantly from the n-3 PUFA group. The AgRP gene expressions did not differ among groups. Lower expression of POMC and higher expression of NPY in the fatty acid diet groups were expected to cause increased food intake, but the food intake in weight amount was not consistent with gene expression. If we use calorie amount instead of weight amount in food intake, higher orexigenic and lower anorexigenic gene expressions in SFA and n-3 PUFA groups caused more calorie intake in spite of lower weight amount intake compared with the CHO group. There was a strong correlation (r2=0.4332, P<0.001) between the ratio of NPY/POMC gene expressions and food intake in calorie amount, but not with food intake in weight amount. These results suggested that POMC and NPY expressions are regulated by calorie amount ingested rather than weight amount in food intake, and AgRP gene would be less important to regulate dietary fat intake. Therefore, hypothalamus gene expression by dietary fat would be dependent on calorie density rather than type of fat. A recent report also suggested that consumption of a hypercaloric high saturated fat diet caused a higher calorie intake than a normocaloric saturated fat diet [25].
- In conclusion, our results suggest that the type of fat in cases of purified fatty acid administration directly into the stomach may cause changes of gene expression in the hypothalamus, that gene expression by dietary fat may be regulated by calorie amount ingested rather than weight amount or type of fat. Therefore, the calorie density of the diet may be a detrimental factor in regulating hypothalamic genes in food intake, although the possibility of type of fat cannot be ruled out.
DISCUSSION
-
Acknowledgements
- This research was supported by a grant from the Yeungnam University Medical Center.
ACKNOWLEDGMENTS
-
CONFLICTS OF INTEREST: No potential conflict of interest relevant to this article was reported.
NOTES
- 1. Must A, Spadano J, Coakley EH, Field AE, Colditz G, Dietz WH. The disease burden associated with overweight and obesity. JAMA 1999;282:1523-1529. ArticlePubMed
- 2. Bouret SG. Early life origins of obesity: role of hypothalamic programming. J Pediatr Gastroenterol Nutr 2009;48(Suppl 1):S31-S38. ArticlePubMed
- 3. Woods SC, D'Alessio DA, Tso P, Rushing PA, Clegg DJ, Benoit SC, Gotoh K, Liu M, Seeley RJ. Consumption of a high-fat diet alters the homeostatic regulation of energy balance. Physiol Behav 2004;83:573-578. ArticlePubMed
- 4. Kim JY, Nolte LA, Hansen PA, Han DH, Ferguson K, Thompson PA, Holloszy JO. High-fat diet-induced muscle insulin resistance: relationship to visceral fat mass. Am J Physiol Regul Integr Comp Physiol 2000;279:R2057-R2065. ArticlePubMed
- 5. Hooper L, Martin N, Abdelhamid A, Davey Smith G. Reduction in saturated fat intake for cardiovascular disease. Cochrane Database Syst Rev 2015;(6):CD011737ArticlePubMed
- 6. Schwab U, Lauritzen L, Tholstrup T, Haldorssoni T, Riserus U, Uusitupa M, Becker W. Effect of the amount and type of dietary fat on cardiometabolic risk factors and risk of developing type 2 diabetes, cardiovascular diseases, and cancer: a systematic review. Food Nutr Res 2014;58:25145.Article
- 7. Mozaffarian D, Micha R, Wallace S. Effects on coronary heart disease of increasing polyunsaturated fat in place of saturated fat: a systematic review and meta-analysis of randomized controlled trials. PLoS Med 2010;7:e1000252ArticlePubMedPMC
- 8. de Souza RJ, Mente A, Maroleanu A, Cozma AI, Ha V, Kishibe T, Uleryk E, Budylowski P, Schunemann H, Beyene J, Anand SS. Intake of saturated and trans unsaturated fatty acids and risk of all cause mortality, cardiovascular disease, and type 2 diabetes: systematic review and meta-analysis of observational studies. BMJ 2015;351:h3978PubMedPMC
- 9. Siri-Tarino PW, Sun Q, Hu FB, Krauss RM. Meta-analysis of prospective cohort studies evaluating the association of saturated fat with cardiovascular disease. Am J Clin Nutr 2010;91:535-546. ArticlePubMedPMC
- 10. Davidson MH. Mechanisms for the hypotriglyceridemic effect of marine omega-3 fatty acids. Am J Cardiol 2006;98:27i-33i.ArticlePubMed
- 11. Deckelbaum RJ, Worgall TS, Seo T. n-3 fatty acids and gene expression. Am J Clin Nutr 2006;83(6):Suppl. 1520S-1525S. ArticlePubMed
- 12. Kim YS, Xun P, Iribarren C, Van Horn L, Steffen L, Daviglus ML, Siscovick D, Liu K, He K. Intake of fish and long-chain omega-3 polyunsaturated fatty acids and incidence of metabolic syndrome among American young adults: a 25-year follow-up study. Eur J Nutr 2016;55:1707-1716. ArticlePubMedPMCPDF
- 13. Simopoulos AP. Essential fatty acids in health and chronic disease. Am J Clin Nutr 1999;70(3 Suppl):560S-569S. ArticlePubMed
- 14. Winnicki M, Somers VK, Accurso V, Phillips BG, Puato M, Palatini P, Pauletto P. Fish-rich diet, leptin, and body mass. Circulation 2002;106:289-291. ArticlePubMed
- 15. Ukropec J, Reseland JE, Gasperikova D, Demcakova E, Madsen L, Berge RK, Rustan AC, Klimes I, Drevon CA, Sebokova E. The hypotriglyceridemic effect of dietary n-3 FA is associated with increased beta-oxidation and reduced leptin expression. Lipids 2003;38:1023-1029. ArticlePubMed
- 16. Fan C, Liu X, Shen W, Deckelbaum RJ, Qi K. The regulation of leptin, leptin receptor and pro-opiomelanocortin expression by N-3 PUFAs in diet-induced obese mice is not related to the methylation of their promoters. Nutr Metab (Lond) 2011;8:31ArticlePubMedPMCPDF
- 17. Bouret SG. Leptin, nutrition, and the programming of hypothalamic feeding circuits. Nestle Nutr Workshop Ser Pediatr Program 2010;65:25-35.ArticlePubMed
- 18. Barsh GS, Farooqi IS, O'Rahilly S. Genetics of body-weight regulation. Nature 2000;404:644-651. ArticlePubMedPDF
- 19. Schwartz MW, Porte D Jr. Diabetes, obesity, and the brain. Science 2005;307:375-379. ArticlePubMed
- 20. Coll AP, Farooqi IS, O'Rahilly S. The hormonal control of food intake. Cell 2007;129:251-262. ArticlePubMedPMC
- 21. Schwartz MW, Woods SC, Porte D Jr, Seeley RJ, Baskin DG. Central nervous system control of food intake. Nature 2000;404:661-671. ArticlePubMedPDF
- 22. Obici S, Rossetti L. Minireview: nutrient sensing and the regulation of insulin action and energy balance. Endocrinology 2003;144:5172-5178. ArticlePubMed
- 23. Levin BE, Routh VH, Kang L, Sanders NM, Dunn-Meynell AA. Neuronal glucosensing: what do we know after 50 years? Diabetes 2004;53:2521-2528. PubMed
- 24. Burdakov D, Luckman SM, Verkhratsky A. Glucose-sensing neurons of the hypothalamus. Philos Trans R Soc Lond B Biol Sci 2005;360:2227-2235. ArticlePubMedPMCPDF
- 25. Hoefel AL, Hansen F, Rosa PD, Assis AM, Silveira SL, Denardin CC, Pettenuzzo L, Augusti PR, Somacal S, Emanuelli T, Perry ML, Wannmacher CM. The effects of hypercaloric diets on glucose homeostasis in the rat: influence of saturated and monounsaturated dietary lipids. Cell Biochem Funct 2011;29:569-576. ArticlePubMed
REFERENCES
Fig. 1

Time series of (A) pro-opiomelanocortin (POMC), (B) neuropeptide Y (NPY), and (C) agouti-related protein (AgRP) mRNA expressions after administration of saturated fatty acid into the stomach. Values are mean±standard error for three to four mice per group. aP<0.01 vs. other groups, bP<0.01 vs. other groups.
Fig. 2
Relative (A) pro-opiomelanocortin (POMC), (B) neuropeptide Y (NPY), and (C) agouti-related protein (AgRP) mRNA expressions 2 hours after administration of saturated (high saturated fatty acid [SFA]) or n-3 polyunsaturated fatty acid (PUFA) into the stomach. Values are mean±standard error for nine to 12 mice per group. aP<0.01 vs. control, bP<0.05 vs. control or SFA, cP<0.01 vs. control or SFA.
Fig. 3

Relative (A) pro-opiomelanocortin (POMC), (B) neuropeptide Y (NPY), and (C) agouti-related protein (AgRP) mRNA expressions in various diet fed mice. Values are mean±standard error for six to nine mice per group. CHO, high carbohydrates diet group; SFA, high saturated fat diet group; PUFA, high n-3 polyunsaturated fatty acid diet group. aP<0.05 vs. CHO, bP<0.05 vs. SFA, cP<0.01 vs. CHO.
Fig. 4
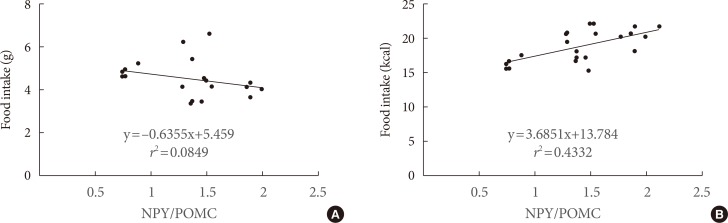
Correlations between the ratio of neuropeptide Y (NPY)/pro-opiomelanocortin (POMC) gene expressions and (A) food intake (g) or (B) food intake (kcal) in various diet fed mice.
Table 1
![dmj-41-121-i001.jpg]()
Experimental diet compositions
Figure & Data
References
Citations
Citations to this article as recorded by 
- Prepartum fatty acid supplementation in sheep. III. Effect of eicosapentaenoic acid and docosahexaenoic acid during finishing on performance, hypothalamus gene expression, and muscle fatty acids composition in lambs1
Ana Cristina Carranza Martin, Danielle Nicole Coleman, Lyda Guadalupe Garcia, Cecilia C Furnus, Alejandro E Relling
Journal of Animal Science.2018; 96(12): 5300. CrossRef - Acute anti‐obesity effects of intracerebroventricular 11β‐HSD1 inhibitor administration in diet‐induced obese mice
M. Seo, S. A. Islam, S.‐S. Moon
Journal of Neuroendocrinology.2018;[Epub] CrossRef - Letter: Regulating Hypothalamus Gene Expression in Food Intake: Dietary Composition or Calorie Density? (Diabetes Metab J 2017;41:121-7)
Bo Kyung Koo
Diabetes & Metabolism Journal.2017; 41(3): 223. CrossRef - Response: Regulating Hypothalamus Gene Expression in Food Intake: Dietary Composition or Calorie Density? (Diabetes Metab J2017;41:121-7)
Mi Jang, So-Young Park, Yong-Woon Kim, Seung-Pil Jung, Jong-Yeon Kim
Diabetes & Metabolism Journal.2017; 41(3): 225. CrossRef
 PubReader
 Cite
Cite