- Current
- Browse
- Collections
-
For contributors
- For Authors
- Instructions to authors
- Article processing charge
- e-submission
- For Reviewers
- Instructions for reviewers
- How to become a reviewer
- Best reviewers
- For Readers
- Readership
- Subscription
- Permission guidelines
- About
- Editorial policy
Articles
- Page Path
- HOME > Diabetes Metab J > Volume 36(3); 2012 > Article
-
Original ArticleClinical Care/Education Influence of the Duration of Diabetes on the Outcome of a Diabetes Self-Management Education Program
- Seung-Hyun Ko1, Sin-Ae Park1, Jae-Hyoung Cho1, Sun-Hye Ko1, Kyung-Mi Shin1, Seung-Hwan Lee1, Ki-Ho Song1, Yong-Moon Park2, Yu-Bae Ahn1
-
Diabetes & Metabolism Journal 2012;36(3):222-229.
DOI: https://doi.org/10.4093/dmj.2012.36.3.222
Published online: June 14, 2012
1Division of Endocrinology & Metabolism, Department of Internal Medicine, The Catholic University of Korea College of Medicine, Seoul, Korea.
2Department of Preventive Medicine, The Catholic University of Korea College of Medicine, Seoul, Korea.
- Corresponding author: Yu-Bae Ahn. Division of Endocrinology & Metabolism, Department of Internal Medicine, St. Vincent's Hospital, The Catholic University of Korea College of Medicine, 93 Jungbu-daero, Paldal-gu, Suwon 442-723, Korea. ybahn@catholic.ac.kr
• Received: September 26, 2011 • Accepted: January 16, 2012
Copyright © 2012 Korean Diabetes Association
This is an Open Access article distributed under the terms of the Creative Commons Attribution Non-Commercial License (http://creativecommons.org/licenses/by-nc/3.0/) which permits unrestricted non-commercial use, distribution, and reproduction in any medium, provided the original work is properly cited.
ABSTRACT
-
Background
- Diabetes education and lifestyle modification are critical components in controlling blood glucose levels of people with type 2 diabetes. Until now, available data on the effectiveness of education with respect to the duration of diabetes are limited. We investigated whether adherence to lifestyle behavior modification prompted by diabetes education was influenced by the duration of diabetes.
-
Methods
- Two hundred and twenty-five people with type 2 diabetes were recruited for an intensive, collaborative, group-based diabetes education program with annual reinforcement. We divided the patients into two groups based on the duration of their diabetes prior to the education program (≤1 year [≤1Y] vs. ≥3 years [≥3Y]). Dietary habits, physical activity, and the frequency of blood glucose self-monitoring were evaluated with a questionnaire prior to education and at the follow-up endpoint.
-
Results
- The mean follow-up period was 32.2 months. The mean hemoglobin A1c (A1C) value was significantly lower in the ≤1Y group. Self-care behaviors, measured by scores for dietary habits (P=0.004) and physical activity (P<0.001), were higher at the endpoint in the ≤1Y group than in the ≥3Y group. Logistic regression analysis revealed that a longer diabetes duration before education was significantly associated with mean A1C levels greater than or equal to 7.0% (53 mmol/mol).
-
Conclusion
- Diabetes duration influenced the effectiveness of diabetes education on lifestyle behavior modification and glycemic control. More-intense, regular, and sustained reinforcement with encouragement may be required for individuals with longstanding type 2 diabetes.
- Diabetes education and lifestyle modification are critical for controlling blood glucose levels in people with type 2 diabetes [1-4]. Diabetes self-management education leads patients to optimise metabolic control, prevent and manage complications, and improve their quality of life in a cost-effective manner [5]. People with diabetes need to adopt behaviors that help them actively engage in self-managing their diabetes. Generally, patient education is regarded as an important treatment modality for type 2 diabetes mellitus, and the beneficial effects of education have been demonstrated in terms of improved glycemic status, improved self-care, reduced amputation risk, increased well-being, and reduced cardiovascular disease (CVD) risk factors in short-term follow-up prospective studies [6-10]. Recently, a 4-year study demonstrated that intensive lifestyle intervention could produce sustained weight loss and improvement in CVD risk factors in type 2 diabetes patients [11].
- We have previously reported the long-term beneficial effects of structured intensive diabetes education programs on glycemic control and lifestyle changes. We found that regular and sustained reinforcement with encouragement is required to maintain optimal metabolic control and to compel patients to maintain better physical activity frequency, dietary habits, and self-monitoring of blood glucose (SMBG), especially in insulin-treated type 2 diabetes patients [12]. Therefore, emphasis should be placed on supporting patients in effective self-management and on the concomitant use of hypoglycemic agents. This should be accomplished through patient education provided by professional health care providers.
- Diabetes is typically a progressive chronic disease, and chronic illness is often emotionally stressful, leading to both physical and psychological fatigue. Patients with chronic illness realize that they should adhere to strict lifestyle modifications and fear the development of complications following the diabetes diagnosis. There are several stress factors in a diabetic patient's daily life that can eventually lead to burnout symptoms [13]. Burnout might influence the clinical outcome or self-care behaviors of patients with type 2 diabetes, and the severity of these symptoms may depend on the duration of diabetes. However, prior to this study, available data on the effectiveness of education on self-care behaviors with respect to the duration of diabetes have been limited. If the effect of diabetes education on self-care behaviors differs with respect to diabetes duration, the education curriculum should be individualized, or reinforcement should be focused on particular patient groups.
- The objective of this study was to investigate whether active intervention with a diabetes education program for lifestyle modifications influences the clinical outcomes for type 2 diabetes patients with respect to diabetes duration. The primary outcome was the patient's adherence to lifestyle modifications and maintenance of self-care behaviors, and the second outcome was the glycemic control status after approximately 3 years.
INTRODUCTION
- Patients
- People with type 2 diabetes who had not received any previous, systematic diabetes education were continuously recruited from the university-affiliated diabetes center of St. Vincent's Hospital between January 2007 and December 2008. To investigate the effect of diabetes duration on the effectiveness of diabetes education, we divided the patients into two groups: those who had less than 1 year of diabetes duration before diabetes education (≤1Y, recently diagnosed patients) and those with more than 3 years (≥3Y) of diabetes duration prior to education. We excluded patients whose diabetes duration was between 13 and 24 months so as to classify the patients into two distinct groups.
- Patients were excluded if they were older than 70 years of age, mentally ill, unable to undertake the recommended physical activity, did not agree to join the education program, or had any severe medical illnesses, such as sepsis, severe infection, hypoglycemia, or shock. Written informed consent was obtained from all participants. Approval from the St. Vincent's Ethics Committee was given.
- Structured diabetes education program
- We developed and set-up an intense, collaborative diabetes education program based on the Bucharest-Dusseldorf study and the Diabetes Prevention Program (DPP) [14,15]. The program was designed for group education, consisted of 5 to 10 patients per team, and was conducted on an outpatient basis. The education team was run by a diabetologist, certified diabetes educators, including a nurse and a dietician, a psychologist, and a family medicine doctor. The curriculum lasted approximately 6 hours per day. The curriculum was covered during five sessions to provide an understanding of diabetes mellitus and to teach participants how to use the glucometer and self-monitoring of glucose levels, injection techniques, sick-day care, meal planning, physical activity, foot inspection, and how to manage hypoglycemia. The educational techniques were patient-centered and involved goal setting and situational problem solving methods in a face-to-face setting. The patients were encouraged to actively interact with the provider in each session.
- The diet education program was designed using the DPP and the Food Pyramid guidelines as references [16,17]. The curriculum was structured to address the knowledge, skills, and attitudes that would encourage, support, and promote self-management skills leading to long-term behavior maintenance, including diet habits, food choice, diet planning, and physical activity. We made each session a hands-on experience, such as SMBG and diet choice in a lunch buffet in front of a dietician. The family members of participants were invited to attend the program.
- All of the participants with diabetes were followed-up 2 weeks after program completion and every 3 months thereafter on an outpatient basis. When the patients visited the outpatient clinic, the physician reviewed their SMBG data and lifestyle behaviors by asking questions and encouraged the patients to maintain their improved lifestyle behaviors. Based on these data, the physician adjusted their dosage of hypoglycemic agents and made appropriate suggestions. If a patient did not visit our clinic for any reason, the education nurse tried to contact the patient by telephone or e-mail.
- For reinforcement, all of the participants were invited to attend reinforcement education annually. Re-education comprised a single session lasting approximately 3 hours, which included a review of self-management and the presentation of new topics, such as diabetes complications, obesity, and dyslipidemia (Table 1).
- Measurements
- Blood pressure, body weight, and blood glucose levels were measured at each visit. Hypertension was defined as a systolic blood pressure of at least 140 mm Hg, a diastolic blood pressure of at least 90 mm Hg, or a history of treatment of hypertension. The fasting blood glucose (FBS) level was measured annually, and glycated hemoglobin levels (high-performance liquid chromatography method; reference range 4.4% to 6.4%; Bio-Rad, Montreal, Quebec, Canada) were checked 2 or 3 times per year. Screening for microalbuminuria was performed by measuring the albumin-to-creatinine ratio in a random spot collection [1]. Diabetic retinopathy was assessed from retinal photographs at baseline, and the findings were reviewed by an ophthalmologist. The outcomes were the mean value and changes in the A1C after education (Table 1).
- Dietary habits, physical activity, and the frequency of SMBG were evaluated using a questionnaire before education and at the follow-up endpoint. Each parameter was scored using a five-point scale based on the average status of the individual during the prior 6 months, using the following criteria [12]: A. Dietary habits ("How well do you follow your recommended meal plan?"). 1) irregular diet with unlimited snacks; 2) irregular with intermittent snacks; 3) appropriate meal calories, regular diet with some snacks (>2 times/day or >300 kcal/day of excess intake); 4) appropriate meal calories, but a few snacks (≤1 time/day, or 100 to 300 kcal/day of excess calorie); 5) tightly controlled, with no intermittent snacks; B. Physical activity ("How often do you undertake at least 20 minutes of physical activity, equivalent in intensity to brisk walking?"). 1) never; 2) <30 min/wk (weekly); 3) <60 min/wk (1 to 2 times per week); 4) <120 min/wk (3 to 4 times per week); 5) daily, >150 min/wk; C. SMBG frequency ("How often do you check your glucose levels?"). 1) never; 2) monthly; 3) weekly; 4) 3 to 4 times/wk; 5) ≥daily [18].
- Statistical analysis
- We used SPSS version 11.5 (SPSS Inc., Chicago, IL, USA) for the statistical analysis, with a 0.05 level of significance. Clinical characteristics and parameters were expressed as the means±standard deviations or numbers (percentages). A χ2 test was performed to test for differences between the proportions of the variables, and a t-test was performed to evaluate the differences between the means of two variables. In particular, we compared the patients' compliance with diet, SMBG, and physical activity using a χ2 test and weighted the data using least-square methods to discern trends. Multiple logistic regression analysis was used to investigate the effect of diabetes duration before education on appropriate diabetes control during the study period (a mean A1C level of less than 7.0%). Variables with P values <0.25 in the univariate test were selected as covariates for the multivariate model.
METHODS
- Clinical characteristics and behavioral outcomes before education
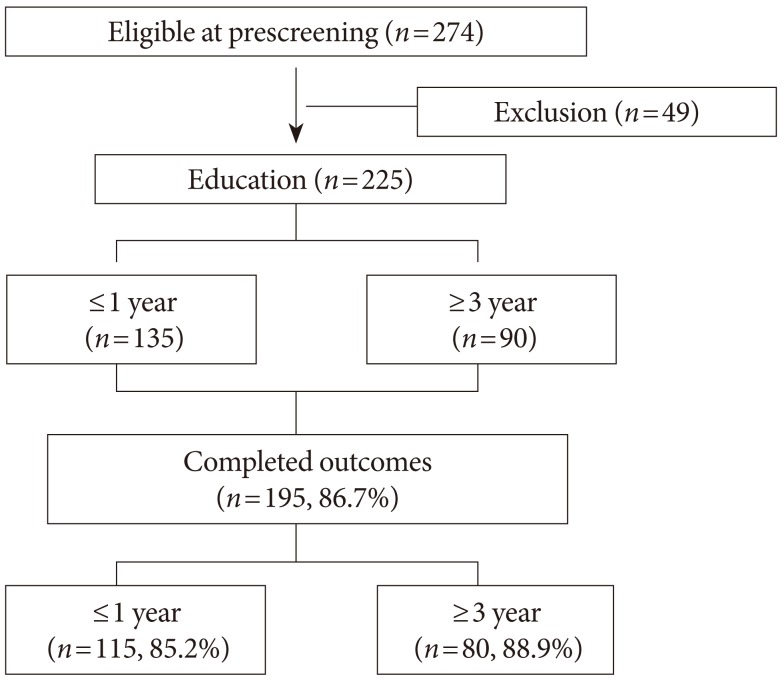
- After pre-screening, 225 people with type 2 diabetes (101 male and 124 female) were enrolled in this study. The mean age and diabetes duration of all of the patients were 51.6±10.1 years and 3.5±5.4 years, respectively. One hundred and ninety-five (86.7%) patients were followed up at the endpoint, and their mean follow-up time was 32.2 months (Fig. 1).
- We divided the patients into two groups based on the duration of their diabetes diagnoses before participating in the diabetes education (≤1Y [n=135] vs. ≥3Y [n=90]). The mean ages and diabetes durations of the patients were 50.2±10.6 years and 0.36±0.3 months, respectively, for the ≤1Y group, and 53.6±8.9 years and 8.5±5.0 years, respectively, for the ≥3Y group. Descriptive characteristics of the study patients, including age, sex, duration of diabetes, body mass index (BMI), and laboratory status, are summarized in Table 2. Age, duration of diabetes, and the percentage of patients with diabetic retinopathy were all significantly higher in the ≥3Y group.
- Behavioral outcomes after education
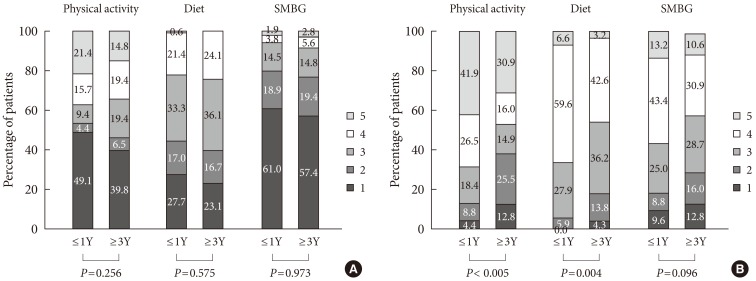
- Before education, self-care behaviors, including the frequency of SMBG (P=0.937), physical activity (P=0.256), and dietary habits (P=0.575), were not different between the ≤1Y group and the ≥3Y group (Fig. 2A). Before completing the education program, only 51 (22.7%), 82 (36.4%), and 15 (6.7%) patients had scores greater than or equal to four for dietary habits, physical activity, and SMBG, respectively.
- After the structured education program with regular reinforcement for approximately 3 years, the scores of all three items showed a remarkably improvement in all of the patients. Dietary habits, physical activity, and SMBG scores were greater than four or equal to four in 109 (55.9%), 113 (57.9%), and 99 (50.8%) patients, respectively. However, there were significant differences between the ≤1Y and ≥3Y groups in the adherence to self-care behaviors at the follow-up endpoint. The adherence to dietary habits (P=0.004) and physical activity (P<0.001) was significantly more sustained in the recently diagnosed patients. However, the SMBG scores did not differ between the two groups (P=0.096) (Fig. 2B).
- A multiple logistic regression analysis revealed that a longer diabetes duration before education was significantly associated with a mean A1C level greater than 7.0% (53 mmol/mol) during the follow-up period (≥3Y vs. ≤1Y; odds ratio, 3.361; 95% confidence interval, 1.664 to 6.787; P=0.001) after adjusting for age, BMI, hypertension, smoking habits, alcohol consumption, presence of retinopathy or microalbuminuria, diabetes medication, A1C, dietary habits, physical activity, and frequency of SMBG in the baseline assessment (Table 3). In this study, the duration of diabetes was an independent risk factor for an unsuccessful glycemic control status even after structured diabetes education with regular reinforcement.
- Glycemic control in both groups for 3 years
- The A1C levels before the education program were not different between the two groups (Table 1). Six months after the education program, the A1C levels were remarkably decreased from baseline values in both groups (≤1Y vs. ≥3Y group, -2.64µ2.3 vs. -1.93µ1.7 percentage points, respectively; P<0.005 with respect to the baseline level in each group; P=0.065 between groups at 6 months). The mean A1C value during the study period was significantly lower in the ≤1Y group than in the ≥3Y group (7.04µ1.2% vs. 8.16µ1.6% [53µ10 mmol/mol vs. 65µ6 mmol/mol], respectively; P<0.005) (Fig. 3A). Sixty-two (45.9%) of the ≤1Y group members and 15 (16.7%) of the ≥3Y group members reached the target A1C level (mean A1C ≤7.0% [53 mmol/mol]) during the follow-up period. The mean A1C levels that were measured every 6 months were significantly lower in the recently diagnosed patients throughout the observation period (Fig. 3B).
RESULTS
- In this study, we investigated whether the effectiveness of a structured diabetes education program was influenced by diabetes duration. Our results suggest that people with type 2 diabetes mellitus who had experienced a longer diabetes duration before participating in diabetes education showed lower adherence to physical activity frequency and dietary habits, as well as elevated mean A1C levels, even after intensive diabetes education, as compared to the more recently diagnosed patients.
- A qualified education program is likely to be a cost-effective intervention for patients with type 2 diabetes mellitus. Diabetes self management education improves metabolic control, prevents and manages complications, and maximizes quality of life in a cost-effective manner [10,19]. We have previously reported the long-term effectiveness of a structural diabetes education program in patients with type 2 diabetes mellitus [12]. We experientially determined the importance of a well-designed program and regular reinforcement; therefore, in this study we emphasized a collaborative approach and regular reinforcement. As the short-term and long-term benefits of structured diabetes education programs have been clearly demonstrated, we investigated whether the duration of diabetes before education would influence glycemic control status or lifestyle behaviors in this study.
- We found that lifestyle behaviors, including dietary habits, physical activity, and SMBG, were remarkably improved after the education program. Moreover, the adherence to dietary habits and physical activity was significantly more sustained in recently diagnosed patients following the structured education program with regular reinforcement for approximately 3 years. In this study, 58.5% of patients exercised for more than 120 minutes per week, and 44.1% maintained good diet habits. However, in spite of the structured education program and reinforcement, the duration of diabetes prior to education significantly influenced the adherence to self-care behaviors and glycemic outcome. We found that the program was more effective in people with type 2 diabetes who had been diagnosed less than 1 year prior to the start of the education program, and the mean A1C levels measured every 6 months were significantly lower in recently diagnosed patients throughout the observation period. Therefore, diabetes education should be delivered as soon as possible after a diagnosis of type 2 diabetes mellitus. Moreover, somewhat different strategies appear to be necessary for patients with a longer diabetic duration to achieve meaningful diabetic education.
- Diabetes is a largely self-managed disease that has a major psychosocial impact on the lives of patients. Even for those who are very adherent to self-care behaviors, they are under the constant threat of severe and devastating diabetic complications or bothersome symptoms throughout their lives [13]. Burn-out is an unfavorable consequence of long-term stress, and this psychological reaction is thought to increase the risk for the development of a permanent physical exhaustion syndrome [20,21]. Asberg et al. [21] and Lindstrom et al. [22] defined burn-out as a combination of emotional fatigue, physical weakness, and cognitive symptoms. Patients with type 2 diabetes are under stressful conditions related to lifestyle modifications or glycemic control throughout their lives; however, burn-out in patients with type 2 diabetes, either emotionally or physically, has not been thoroughly studied. A recent study has shown that diabetes-related stress is significantly correlated with a longer diabetic duration and an uncontrolled glycemic status [23,24]. Diabetic patients were usually stressed about the future and the possibility of serious complications and were frightened when they thought about the difficulties of living with diabetes [23]. Therefore, to maintain patients' self-care behavior, a diabetes educator needs to take into account various social, emotional, and psychological factors, in addition to their clinical situation.
- There are some limitations of our study. First, as the diabetic duration increases, pancreatic β-cell function gradually decrease; this decrease in β-cell function might affect the mean A1C results. Diabetic treatments were significantly different between the two groups. A greater number of patients with a longer diabetes duration used insulin or oral hypoglycemic agents to control their diabetes. Second, validated research tools to estimate psychological, physical, and behavioral symptoms of clinical burn-out should be used to define the influence of diabetic burn-out on self-care behaviors. Our future research will address this question. Third, changes in lifestyle behavior can be influenced by other factors, such as educational status or the presence of a job. However, according to our previous report, socioeconomic status, marital status, family history of diabetes, or the presence of a job did not have an influence on the lifestyle behaviors [25].
- In conclusion, we found that a longer duration of diabetes resulted in a lower adherence to self-care activities and poorer glycemic control. We demonstrated that intensive diabetes education in newly or recently diagnosed diabetic patients has more favorable clinical outcomes, as compared to the outcomes of patients with a longer duration of diabetes prior to education. Lifestyle modifications are an essential component of diabetes management. Diabetic education should help diabetic patients maintain their lifestyle modifications; however, diabetes burn-out or diabetes-related stress influences their self-care behaviors. Therefore, diabetic patients with a long diabetic duration need special attention from health care providers and diabetes educators. It is important to consider psychological and emotional support for type 2 diabetic patients, especially those with longer diabetes duration or diabetic complications, to maximize the effectiveness of diabetes education.
DISCUSSION
- 1. American Diabetes Association. Standards of medical care in diabetes: 2011. Diabetes Care 2011;34(Suppl 1):S11-S61. ArticlePubMedPMCPDF
- 2. Assal JP, Muhlhauser I, Pernet A, Gfeller R, Jorgens V, Berger M. Patient education as the basis for diabetes care in clinical practice and research. Diabetologia 1985;28:602-613. ArticlePubMedPDF
- 3. Norris SL, Lau J, Smith SJ, Schmid CH, Engelgau MM. Self-management education for adults with type 2 diabetes: a meta-analysis of the effect on glycemic control. Diabetes Care 2002;25:1159-1171. PubMed
- 4. Polonsky WH, Earles J, Smith S, Pease DJ, Macmillan M, Christensen R, Taylor T, Dickert J, Jackson RA. Integrating medical management with diabetes self-management training: a randomized control trial of the Diabetes Outpatient Intensive Treatment program. Diabetes Care 2003;26:3048-3053. PubMed
- 5. Gillett M, Dallosso HM, Dixon S, Brennan A, Carey ME, Campbell MJ, Heller S, Khunti K, Skinner TC, Davies MJ. Delivering the diabetes education and self management for ongoing and newly diagnosed (DESMOND) programme for people with newly diagnosed type 2 diabetes: cost effectiveness analysis. BMJ 2010;341:c4093ArticlePubMedPMC
- 6. Rubin RR, Peyrot M, Saudek CD. Effect of diabetes education on self-care, metabolic control, and emotional well-being. Diabetes Care 1989;12:673-679. ArticlePubMedPDF
- 7. Tankova T, Dakovska G, Koev D. Education and quality of life in diabetic patients. Patient Educ Couns 2004;53:285-290. ArticlePubMed
- 8. Ko GT, Li JK, Kan EC, Lo MK. Effects of a structured health education programme by a diabetic education nurse on cardiovascular risk factors in Chinese type 2 diabetic patients: a 1-year prospective randomized study. Diabet Med 2004;21:1274-1279. ArticlePubMed
- 9. Clark CM Jr, Fradkin JE, Hiss RG, Lorenz RA, Vinicor F, Warren-Boulton E. The National Diabetes Education Program, changing the way diabetes is treated: comprehensive diabetes care. Diabetes Care 2001;24:617-618. PubMed
- 10. Norris SL, Engelgau MM, Narayan KM. Effectiveness of self-management training in type 2 diabetes: a systematic review of randomized controlled trials. Diabetes Care 2001;24:561-587. PubMed
- 11. Look AHEAD Research Group. Wing RR. Long-term effects of a lifestyle intervention on weight and cardiovascular risk factors in individuals with type 2 diabetes mellitus: four-year results of the Look AHEAD trial. Arch Intern Med 2010;170:1566-1575. PubMedPMC
- 12. Ko SH, Song KH, Kim SR, Lee JM, Kim JS, Shin JH, Cho YK, Park YM, Jeong JH, Yoon KH, Cha BY, Son HY, Ahn YB. Long-term effects of a structured intensive diabetes education programme (SIDEP) in patients with type 2 diabetes mellitus: a 4-year follow-up study. Diabet Med 2007;24:55-62. ArticlePubMed
- 13. Charman D. Burnout and diabetes: reflections from working with educators and patients. J Clin Psychol 2000;56:607-617. ArticlePubMed
- 14. Muhlhauser I, Bruckner I, Berger M, Cheta D, Jorgens V, Ionescu-Tirgoviste C, Scholz V, Mincu I. Evaluation of an intensified insulin treatment and teaching programme as routine management of type 1 (insulin-dependent) diabetes. The Bucharest-Dusseldorf Study. Diabetologia 1987;30:681-690. ArticlePubMedPDF
- 15. The Diabetes Prevention Program Research Group. The Diabetes Prevention Program. Design and methods for a clinical trial in the prevention of type 2 diabetes. Diabetes Care 1999;22:623-634. ArticlePubMedPMCPDF
- 16. Cronin FJ, Shaw AM, Krebs-Smith SM, Marsland PM, Light L. Developing a food guidance system to implement the dietary guidelines. J Nutr Educ 1987;19:281-302.Article
- 17. Mensing C, Boucher J, Cypress M, Weinger K, Mulcahy K, Barta P, Hosey G, Kopher W, Lasichak A, Lamb B, Mangan M, Norman J, Tanja J, Yauk L, Wisdom K, Adams C. National standards for diabetes self-management education. Task force to review and revise the national standards for diabetes self-management education programs. Diabetes Care 2000;23:682-689. ArticlePubMedPDF
- 18. Franciosi M, Pellegrini F, De Berardis G, Belfiglio M, Cavaliere D, Di Nardo B, Greenfield S, Kaplan SH, Sacco M, Tognoni G, Valentini M, Nicolucci A. QuED Study Group. The impact of blood glucose self-monitoring on metabolic control and quality of life in type 2 diabetic patients: an urgent need for better educational strategies. Diabetes Care 2001;24:1870-1877. PubMed
- 19. Funnell MM, Brown TL, Childs BP, Haas LB, Hosey GM, Jensen B, Maryniuk M, Peyrot M, Piette JD, Reader D, Siminerio LM, Weinger K, Weiss MA. National standards for diabetes self-management education. Diabetes Care 2010;33(Suppl 1):S89-S96. ArticlePubMedPMCPDF
- 20. Peterson U, Demerouti E, Bergstrom G, Samuelsson M, Asberg M, Nygren A. Burnout and physical and mental health among Swedish healthcare workers. J Adv Nurs 2008;62:84-95. ArticlePubMed
- 21. Asberg M, Nygren A, Leopardi R, Rylander G, Peterson U, Wilczek L, Kallmen H, Ekstedt M, Akerstedt T, Lekander M, Ekman R. Novel biochemical markers of psychosocial stress in women. PLoS One 2009;4:e3590ArticlePubMedPMC
- 22. Lindstrom C, Aman J, Norberg AL. Increased prevalence of burnout symptoms in parents of chronically ill children. Acta Paediatr 2010;99:427-432. ArticlePubMed
- 23. Eom YS, Park HS, Kim SH, Yang SM, Nam MS, Lee HW, Lee KY, Lee S, Kim YS, Park IB. Evaluation of stress in Korean patients with diabetes mellitus using the Problem Areas in Diabetes-Korea questionnaire. Diabetes Metab J 2011;35:182-187. ArticlePubMedPMC
- 24. Weinger K, Beverly EA, Lee Y, Sitnokov L, Ganda OP, Caballero AE. The effect of a structured behavioral intervention on poorly controlled diabetes: a randomized controlled trial. Arch Intern Med 2011;171:1990-1999. ArticlePubMedPMC
- 25. Song MS, Song KH, Ko SH, Ahn YB, Kim JS, Shin JH, Cho YK, Yoon KH, Cha BY, Son HY, Lee DH. The long-term effect of a structured diabetes education program for uncontrolled type 2 diabetes mellitus patients: a 4-year follow-up. J Korean Diabetes Assoc 2005;29:140-150.
REFERENCES
Fig. 1Enrollment of patients with type 2 diabetes mellitus and the study design. Data represent the number (%) of patients.

Fig. 2Changes in the scores of lifestyle behaviors during the study period with respect to the duration of diabetes before education. (A) Before education. (B) After education. Diet habit: Score 1, irregular diet with unlimited snacks; 2, irregular with intermittent snacks; 3, appropriate meal calories, regular diet with some snacks (>2 times/day or >300 kcal/day of excess intake; 4, appropriate meal calories, but a few snacks (≤1 time/day, or 100 to 300 kcal/day of excess calorie); 5, tightly controlled, with no intermittent snacks. Self-monitoring of blood glucose (SMBG): Score 1, never; 2, monthly; 3, weekly; 4, 3 to 4 times/wk; 5, ≥ daily. Physical activity: 1, never; 2, <30 min/wk (weekly); 3, <60 min/wk (1 to 2 times per week); 4, <120 min/wk (3 to 4 times per week); 5, daily, >150 min/wk. The P values denote the differences between the groups (≤1Y vs. ≥3Y) at the given time point.

Fig. 3Mean hemoglobin A1c (A1C) levels in both groups. (A) Mean values during the study period. (B) Changes in A1C levels in both groups. Data are presented as the mean±standard deviation. ≤1Y, diabetes duration of less than 1 year before diabetes education or in recently diagnosed patients; ≥3Y, diabetes duration of more than 3 years before education. aP<0.05 vs. ≤1Y group.
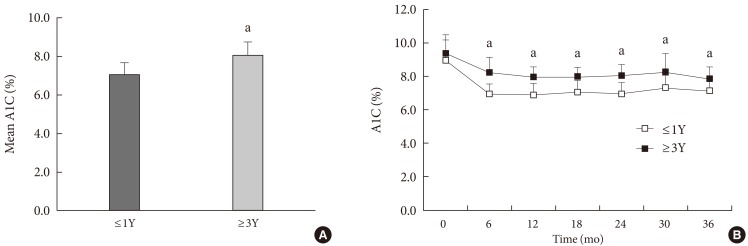
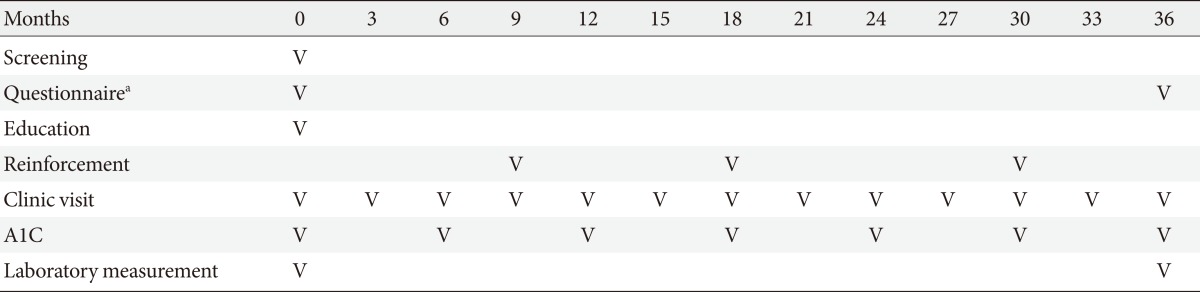
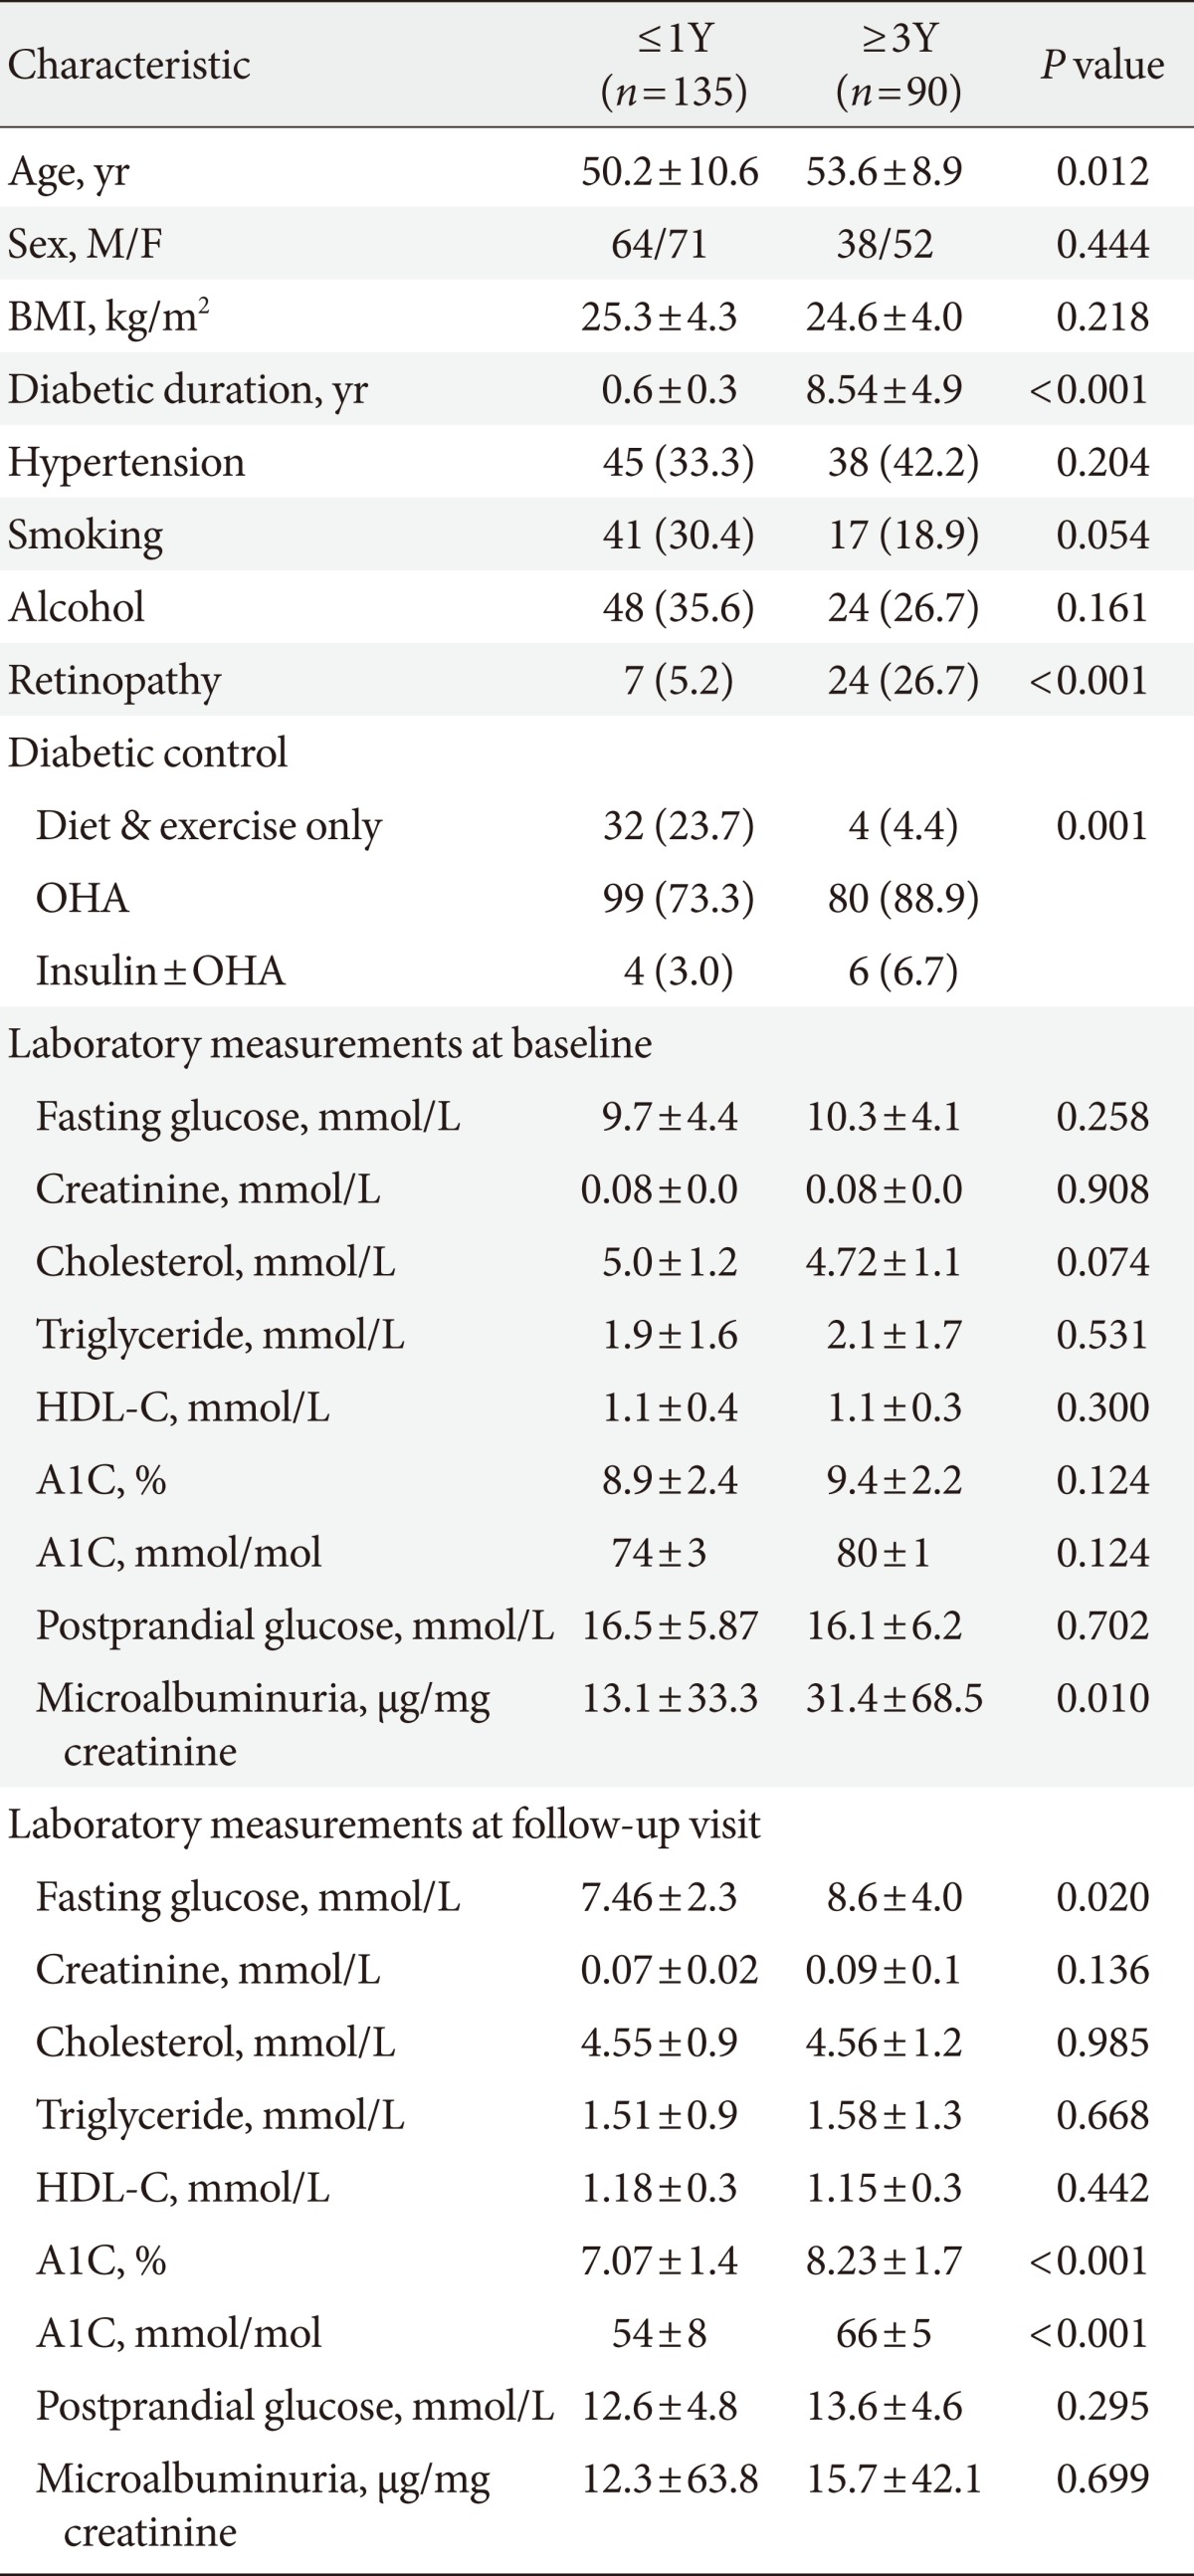
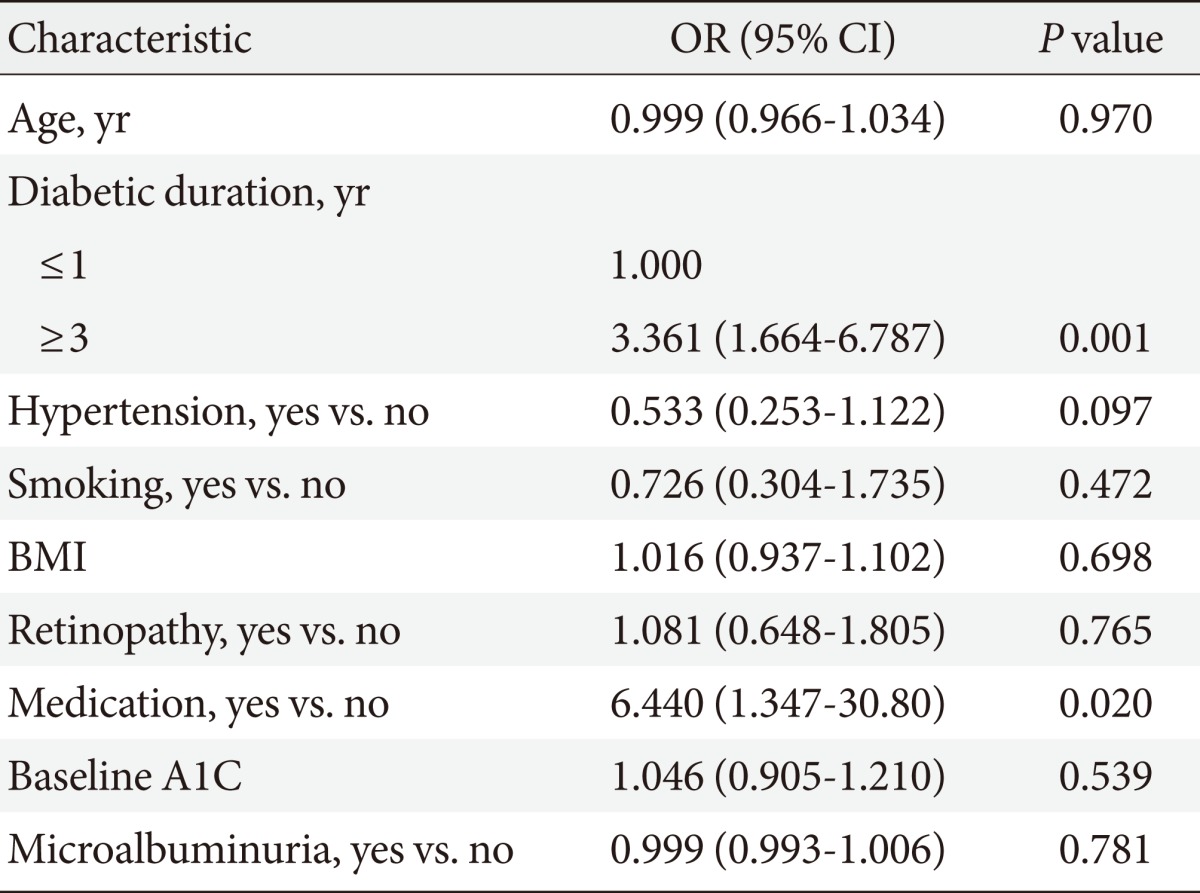
Figure & Data
References
Citations
Citations to this article as recorded by 
- Prevalence of type 2 diabetes complications and its association with diet knowledge and skills and self‐care barriers in Tabriz, Iran: A cross‐sectional study
Habib Jalilian, Elnaz Javanshir, Leila Torkzadeh, Saeedeh Fehresti, Nazanin Mir, Majid Heidari‐Jamebozorgi, Somayeh Heydari
Health Science Reports.2023;[Epub] CrossRef - Continuing the quality improvement of an electronic personal health record and interactive website for people with diabetes in Scotland (My Diabetes My Way)
Cathy Shields, Nicholas T. Conway, Brian Allardice, Deborah J. Wake, Scott G. Cunningham
Diabetic Medicine.2023;[Epub] CrossRef - The use of nomogram for detecting mild cognitive impairment in patients with type 2 diabetes mellitus
Rehanguli Maimaitituerxun, Wenhang Chen, Jingsha Xiang, Yu Xie, Atipatsa C. Kaminga, Xin Yin Wu, Letao Chen, Jianzhou Yang, Aizhong Liu, Wenjie Dai
Journal of Diabetes.2023; 15(5): 448. CrossRef - DENTAL IMPLANT TREATMENT IN DIABETES MELLITUS (DM) PATIENTS: REVIEW
Hakob Khachatryan
BULLETIN OF STOMATOLOGY AND MAXILLOFACIAL SURGERY.2023; : 121. CrossRef - An association between socioeconomic status and preventive screening for diabetic eye and kidney complications among individuals with type 2 diabetes
Changwoo Shon, Jongnam Hwang
Korean Journal of Health Education and Promotion.2023; 40(5): 27. CrossRef - Association of quality of life with medication adherence and glycemic control in patients with type 1 diabetes
Farimah Fayyaz, Parham Mardi, Sahar Sobhani, Leily Sokoty, Fatemeh Aghamahdi, Mostafa Qorbani
Journal of Diabetes & Metabolic Disorders.2023;[Epub] CrossRef - Effect of aerobic training on baroreflex sensitivity, heart rate recovery, and heart rate variability in type 2 diabetes: a systematic review
Sarah Parveen, Muhammad Azharuddin, Majumi M. Noohu
International Journal of Diabetes in Developing Countries.2023;[Epub] CrossRef - Managing type 2 diabetes and depression with Mindfulness-integrated Cognitive Behavior Therapy (MiCBT)
Fateh Sohrabi, Ahmad Sohrabi, Narges Shams-Alizadeh, Bruno A. Cayoun
Discover Psychology.2022;[Epub] CrossRef - Perception of benefits and barriers associated with dementia prevention behaviors among people with diabetes
Noppamas Pipatpiboon, Nut Koonrungsesomboon, Wachira Suriyawong, Jirapas Sripetchwandee, Sue Turale
Nursing & Health Sciences.2022; 24(1): 274. CrossRef - An exploratory study on the knowledge, attitude and practice of sharp disposal among type 2 diabetes mellitus patients in Northern Peninsular Malaysia
Jin Yi Choo, Yen Ping Ng, Ahmad Kamal Ariffin Abdul Jamil, Wei Kai Heng, Yee Mei Ng, Jing Ng, Cheng Hoon Yap
Diabetes & Metabolic Syndrome: Clinical Research & Reviews.2022; 16(4): 102479. CrossRef - Efficacy of Personalized Diabetes Self-care Using an Electronic Medical Record–Integrated Mobile App in Patients With Type 2 Diabetes: 6-Month Randomized Controlled Trial
Eun Young Lee, Seon-Ah Cha, Jae-Seung Yun, Sun-Young Lim, Jin-Hee Lee, Yu-Bae Ahn, Kun-Ho Yoon, Min Kyung Hyun, Seung-Hyun Ko
Journal of Medical Internet Research.2022; 24(7): e37430. CrossRef - Real-world Benefits of Diabetes Management App Use and Self-monitoring of Blood Glucose on Glycemic Control: Retrospective Analyses
Ya-Ting Chang, Yu-Zhen Tu, Hung-Yi Chiou, Ken Lai, Neng Chun Yu
JMIR mHealth and uHealth.2022; 10(6): e31764. CrossRef - Glycemic control and its influencing factors in type 2 diabetes patients in Anhui, China
Xiu-Ya Xing, Xin-Yi Wang, Xi Fang, Jing-Qiao Xu, Ye-Ji Chen, Wei Xu, Hua-Dong Wang, Zhi-Rong Liu, Sha-Sha Tao
Frontiers in Public Health.2022;[Epub] CrossRef - Time for Using Machine Learning for Dose Guidance in Titration of People With Type 2 Diabetes? A Systematic Review of Basal Insulin Dose Guidance
Camilla Heisel Nyholm Thomsen, Stine Hangaard, Thomas Kronborg, Peter Vestergaard, Ole Hejlesen, Morten Hasselstrøm Jensen
Journal of Diabetes Science and Technology.2022; : 193229682211459. CrossRef - Adherence to Mediterranean diet and advanced glycation endproducts in patients with diabetes
Marko Grahovac, Marko Kumric, Marino Vilovic, Dinko Martinovic, Ante Kreso, Tina Ticinovic Kurir, Josip Vrdoljak, Karlo Prizmic, Joško Božić
World Journal of Diabetes.2021; 12(11): 1942. CrossRef - Impact of Diabetes and Disease Duration on Work Status Among U.S. Older Adults
Miriam Mutambudzi, Cesar Gonzalez Gonzalez, Rebecca Wong
Journal of Aging and Health.2020; 32(5-6): 432. CrossRef - The association of illness perceptions and God locus of health control with self-care behaviours in patients with type 2 diabetes in Saudi Arabia
Mohsen Alyami, Anna Serlachius, Ibrahim Mokhtar, Elizabeth Broadbent
Health Psychology and Behavioral Medicine.2020; 8(1): 329. CrossRef - The Impact of a Community-Based Food Education Program on Nutrition-Related Knowledge in Middle-Aged and Older Patients with Type 2 Diabetes: Results of a Pilot Randomized Controlled Trial
Carlos Vasconcelos, António Almeida, Maria Cabral, Elisabete Ramos, Romeu Mendes
International Journal of Environmental Research and Public Health.2019; 16(13): 2403. CrossRef - Diabetes-Related Health Care Utilization and Dietary Intake Among Food Pantry Clients
Eric M. Bomberg, Sophie Rosenmoss, Morgan Smith, Elaine Waxman, Hilary K. Seligman
Health Equity.2019; 3(1): 644. CrossRef - Factors Contributing to Sharp Waste Disposal at Health Care Facility Among Diabetic Patients in North-East Peninsular Malaysia
Ummu Atiyyah Hasan, Suhaily Mohd Hairon, Najib Majdi Yaacob, Aziah Daud, Anees Abdul Hamid, Norzaihan Hassan, Mohd Faiz Ariffin, Lau Yi Vun
International Journal of Environmental Research and Public Health.2019; 16(13): 2251. CrossRef - Effectiveness of Diabetes Community Sharp Disposal Education Module in Primary Care: An Experimental Study in North-East Peninsular Malaysia
Ummu Atiyyah Hasan, Suhaily Mohd Hairon, Najib Majdi Yaacob, Aziah Daud, Anees Abdul Hamid, Norzaihan Hassan, Mohd Faiz Ariffin, Lau Yi Vun
International Journal of Environmental Research and Public Health.2019; 16(18): 3356. CrossRef - Analysis of the Relationship between the Referral and Evolution of Patients with Type 2 Diabetes Mellitus
Camilo Alvarez, Cecilia Saint-Pierre, Valeria Herskovic, Marcos Sepúlveda
International Journal of Environmental Research and Public Health.2018; 15(7): 1534. CrossRef - Clinical characteristics of Chinese patients with duration of type 2 diabetes >40 years
Tingting Song, Yingying Luo, Xuhui Wang, Jing Li, Qian Han, Hong Zhu, Wei Zhao, Weidong Li, Zhong Sun, Xilin Yang
Journal of Diabetes.2017; 9(1): 45. CrossRef - Impacto de intervenções educativas na redução das complicações diabéticas: revisão sistemática
Marcela Machado Menezes, Camila Takáo Lopes, Lilia de Souza Nogueira
Revista Brasileira de Enfermagem.2016; 69(4): 773. CrossRef - The Well-Being and Treatment Satisfaction of Diabetic Patients in an Outpatient Setting at a General Hospital in Korea
Hwa-Sun Park, Sin Na Lee, Min Young Baek, Seung Hee Yu, Young Sil Eom, Sihoon Lee, Ki Young Lee, Yeun Sun Kim, Byung Joon Kim, Kwang Won Kim, Ie Byung Park
The Journal of Korean Diabetes.2016; 17(2): 123. CrossRef - Poor glycemic control in type 2 diabetes in the South of the Sahara: The issue of limited access to an HbA1c test
Alioune Camara, Naby M. Baldé, Joelle Sobngwi-Tambekou, André P. Kengne, Mansour M. Diallo, Alain P.K. Tchatchoua, Amadou Kaké, Ngamani Sylvie, Beverley Balkau, Fabrice Bonnet, Eugène Sobngwi
Diabetes Research and Clinical Practice.2015; 108(1): 187. CrossRef - Effect of Group Training on Glycemic Control in Patients With Diabetes Type-I
Marjan Naseri, Shahnaz Rostami, Bahman Dashtebozorgi
Jundishapur Journal of Chronic Disease Care.2015;[Epub] CrossRef - Clinical audit of patients using DPP4 inhibitors in longstanding type 2 diabetes
K.V.S. Hari Kumar, A.K. Gupta
Diabetes & Metabolic Syndrome: Clinical Research & Reviews.2015; 9(4): 277. CrossRef - Moderate diet-induced weight loss is associated with improved insulin sensitivity in middle-aged healthy obese Korean women
Hye-Ok Lee, Jung-Eun Yim, Young-Seol Kim, Ryowon Choue
Nutrition Research and Practice.2014; 8(4): 469. CrossRef - Inverse Association between Glycated Albumin and Insulin Secretory Function May Explain Higher Levels of Glycated Albumin in Subjects with Longer Duration of Diabetes
Yong-ho Lee, Mi Hyang Kown, Kwang Joon Kim, Eun Young Lee, Daham Kim, Byung-Wan Lee, Eun Seok Kang, Bong Soo Cha, Hyun Chul Lee, Marià Alemany
PLoS ONE.2014; 9(9): e108772. CrossRef - Systematic review of the psychometric properties and theoretical grounding of instruments evaluating self‐care in people with type 2 Diabetes Mellitus
Jorge Caro‐Bautista, Francisco Javier Martín‐Santos, Jose Miguel Morales‐Asencio
Journal of Advanced Nursing.2014; 70(6): 1209. CrossRef - It's Still Not Too Late to Make a Change: Current Status of Glycemic Control in Korea
Sang Yong Kim
Diabetes & Metabolism Journal.2014; 38(3): 194. CrossRef - Efficacy of the Smartphone-Based Glucose Management Application Stratified by User Satisfaction
Hun-Sung Kim, Wona Choi, Eun Kyoung Baek, Yun A Kim, So Jung Yang, In Young Choi, Kun-Ho Yoon, Jae-Hyoung Cho
Diabetes & Metabolism Journal.2014; 38(3): 204. CrossRef - Education as Prescription for Patients with Type 2 Diabetes Mellitus: Compliance and Efficacy in Clinical Practice
Mi Yeon Kim, Sunghwan Suh, Sang-Man Jin, Se Won Kim, Ji Cheol Bae, Kyu Yeon Hur, Sung Hye Kim, Mi Yong Rha, Young Yun Cho, Myung-Shik Lee, Moon Kyu Lee, Kwang-Won Kim, Jae Hyeon Kim
Diabetes & Metabolism Journal.2012; 36(6): 452. CrossRef
 PubReader
 Cite
Cite