- Current
- Browse
- Collections
-
For contributors
- For Authors
- Instructions to authors
- Article processing charge
- e-submission
- For Reviewers
- Instructions for reviewers
- How to become a reviewer
- Best reviewers
- For Readers
- Readership
- Subscription
- Permission guidelines
- About
- Editorial policy
Articles
- Page Path
- HOME > Diabetes Metab J > Volume 40(6); 2016 > Article
-
Original ArticlePathophysiology Investigating Susceptibility to Diabetes Using Features of the Adipose Tissue in Response to
In Utero Polycyclic Aromatic Hydrocarbons Exposure -
Worlanyo E. Gato1
 , Daniel A. Hunter1, Shamaya L. Whitby1, Christopher A. Mays1, Wilson Yau2
 -
Diabetes & Metabolism Journal 2016;40(6):494-508.
DOI: https://doi.org/10.4093/dmj.2016.40.6.494
Published online: August 12, 2016
1Department of Chemistry, Georgia Southern University, Statesboro, GA, USA.
2Department of Pathology, University of Georgia College of Veterinary Medicine, Athens, GA, USA.
- Corresponding author: Worlanyo E. Gato. Department of Chemistry, Georgia Southern University, 1332 Southern Dr, Statesboro, GA 30458, USA. wgato@georgiasouthern.edu
• Received: March 3, 2016 • Accepted: July 13, 2016
Copyright © 2016 Korean Diabetes Association
This is an Open Access article distributed under the terms of the Creative Commons Attribution Non-Commercial License (http://creativecommons.org/licenses/by-nc/4.0/) which permits unrestricted non-commercial use, distribution, and reproduction in any medium, provided the original work is properly cited.
ABSTRACT
-
Background
- In recent times, there has been an increase in the incidence of type 2 diabetes mellitus (T2DM) particularly in children. Adipocyte dysfunction provide a critical link between obesity and insulin resistance resulting in diabetes outcome. Further, environmental chemical exposure during early years of life might be a significant contributing factor to the increase in the incidence of T2DM. This study tests the idea that exposure to environmental contaminants (2-aminoanthracene [2AA]) in utero will show effects in the adipose tissue (AT) that signify T2DM vulnerability. 2AA is a polycyclic aromatic hydrocarbon found in a variety of products.
-
Methods
- To accomplish the study objective, pregnant dams were fed various amounts of 2AA adulterated diets from gestation through postnatal period. The neonates and older offspring were analyzed for diabetic-like genes in the ATs and analysis of serum glucose. Furthermore, weight monitoring, histopathology and immunohistochemical (IHC) staining for CD68 in AT, adipocyte size determination and adiponectin amounts in serum were undertaken.
-
Results
- Up-regulation of adiponectin and interleukin-6 genes were noted in the pups and older rats. Combination of intrauterine 2AA toxicity with moderate high fat diet exhibited gene expression patterns similar to those of the neonates. Elevated serum glucose levels were noted in treated groups. IHC of the AT indicated no significant malformations; however, CD68+ cells were greater in the animals treated to 2AA. Similarly, mean sizes of the adipocytes were larger in treated and combined 2AA and moderate high fat animals. Adiponectin was reduced in 2AA groups.
-
Conclusion
- From the preceding, it appears intrauterine 2AA disturbance, when combined with excess fat accumulation will lead to greater risk for the diabetic condition.
- In the past few years, there has been an increasing incidence of diabetes among the population [12]. The scientific and medical communities attribute this trend to bad eating habits along with living a sedentary lifestyle [34]. According to some researchers, non-traditional risk factors such as an individual's microbiome, stress, and even the environment may contribute significantly to the increased risk to diabetes [567]. Of particular interest to diabetes and obesity investigators involve assessing the role of environmental chemical exposure in the induction of the disease [89]. The environment contains many pollutants in the air, soil and water that can be categorized as toxins. As a consequence, it is imperative for us to understand how exposure to environmental toxins through generations can have an adverse effect on physiological processes.
- Furthermore, current research indicates that disturbances in the intrauterine environment may cause offspring to be susceptible to type 2 diabetes mellitus (T2DM) and cardiovascular disease [10]. The concept of intrauterine adaptation to injury is referred to as developmental programming. Others have observed that environmental exposures in childhood seem to trigger chronic diseases that affect adults [111213]. Insulin-dependent diabetes mellitus, which results from specific disruption of the pancreatic islet insulin-secreting β-cells, is induced in experimental animals by toxic agents, including chemicals that are byproducts of cigarette smoking [1415].
- In the present study, we examined the exposure of 2-aminoanthracene (2AA) in utero and the effect on early stages of life and its relation to T2DM. Previous research in our laboratory showed the over expression of a select genes that are known to play crucial roles in diabetic-related outcomes. Specifically, adiponectin, interleukin-6 (IL-6), tumor necrosis factor α (TNF-α) among others examined in the study were observed to elicit an inflammatory response [616]. For instance TNF-α is responsible for the down-regulation of genes responsible for normal insulin action, having direct effects on insulin signaling, and a negative regulation of peroxisome proliferator-activated receptor γ [1718]. IL-6 is responsible for inhibiting insulin receptor signal transduction and insulin action [1920]. On the other hand, adiponectin regulates glucose and fatty acid oxidation and is exclusively secreted in adipose tissue (AT) [2122]. CD14 helps modulate AT inflammatory activity and insulin resistance [2324]. Leptin is a hormone made by fat cells, which regulates the amount of fat stored in the body [2526].
- The environmental contaminant 2AA, is a mild toxin and known carcinogen in the environment. 2AA is categorized as a polycyclic aromatic hydrocarbon (PAH) and as an arylamine [2728]. 2AA can be found throughout the environment, including broiled food and tobacco smoke, as well as in a wide range of products, including coal, tar, crude oil, cereals, grains, flour, vegetables, and pickled foods. One can also be exposed to this toxicant specifically through common household foods such as meat and cereals.
- The objective is to test if there is a correlation between the degrees of exposure to 2AA and its effect on adipokines and cytokine gene regulation. Cytokines and adipokines from the AT were measured in 2 weeks old neonates and adult pups that were exposed to 2AA in utero and later fed moderate high fat diet.
INTRODUCTION
- Experimental design
- Nine timed pregnant dams (day 1) were purchased from Taconic (Hudson, NY, USA) and assigned into dose regimens of 0 mg/kg- (control), 50 mg/kg- (low dose), and 100 mg/kg-diet (high dose) 2AA. Dams were fed 2AA-contaminated diet during the period of gestation and postpartum. Some (15 rats per treatment group) of the offspring were sacrificed 2 weeks postnatal. Sample size was estimated via an online statistical tool [29] by inputting the determinants such as probability of type I error (α=0.05); power (1–β)=0.95; number of groups, 3; largest difference, 1.5; and within group standard deviation, 1. Calculated parameters indicated that β of 0.05, effect size of 1.5 required sample size of 12. This was the basis for the choice of rats per treatment group. After 3 months postwean, the rest (12 to 15 rats per group) were assigned into regular rat chow (5M30 rodent diet; PMI Nutrition International, LLC, Brentwood, MO, USA) and moderate high fat diet (custom adjusted diet, 42% from fat, TD.88137; Harlan Laboratories, Madison, WI, USA) for 6 weeks.
- AT from the abdomen along with other tissues were saved following necropsy. Some of the saved tissues were frozen immediately in liquid nitrogen and stored in –80℃ freezer until analysis, while others were placed in 10% neutral buffered formalin. Animals were housed at the Georgia Southern University Animal Facility (1176A Biological Sciences Field-house). This facility is accredited by Association for Assessment and Accreditation of Laboratory Animal Care. Rats were treated according to the principles outlined in the Institute for Laboratory Animal Research Guide for Care and Use of Laboratory Animals. Our protocols were reviewed and approved by Institutional Animal Care and Use Committee (IACUC protocol# I13010). We were careful to minimize the number of animals employed in the research as well as minimizing animal discomfort.
- Diet preparation
- The 2AA (CAS# 613-13-8) with 98% purity was purchased from Sigma Aldrich (St. Louis, MO, USA) and used without further purification. The appropriate amount of 2AA was initially mixed with sucrose and shipped to Harlan Laboratories Inc. for incorporation into the Global Rodent Diet 2020. 2AA was incorporated into the 2020 diet at Harlan Laboratories Inc. Sucrose blended 2AA was premixed with some of the powdered-diet and then mixed with the rest of the diet for even distribution. Approximately 10% of water was added to the diet and then pelleted. No heat was added during the pelleting process. The diet is finally dried at 50℃ for 8 hours in order to reduce moisture and possible mold contamination. The diet was then packaged and shipped. Control diet was pelleted similar to 2AA adulterated diet to ensure uniformity in diet preparation.
- At almost 3 months postwean, progeny were assessed for their susceptibility to T2DM via dietary changes. Rat offspring were randomized into normal rat chow and moderately high fat diet (custom adjusted diet [42% from fat] TD.88137 from Harlan Laboratories Inc.) for 5 to 6 weeks. The moderate high fat diet contains approximately ~42% fat and induces less severe obesity. This diet has been previously employed to induce obesity [30]. We believe this diet will address our end goal of examining susceptibility to T2DM.
- Total RNA isolation
- The RNeasy Plus Universal Mini by Qiagen Inc. (Valencia, CA, USA) was used for total RNA isolation. The procedures were followed as listed in the protocol. Approximately 20 to 30 mg of AT sample was added to a QIAzol lysis reagent, homogenized and allowed to bind to RNA spin column. Total RNA concentration and quality were examined using Nanodrop 2000c spectrophotometer (Thermo Fisher Scientific, Waltham, MA, USA), RNA electrophoretic gels and Experion RNA Std-Sens analysis kit according to the manufacturer's specifications (Bio-Rad Laboratories Inc., Hercules, CA, USA).
- H&E and other immunohistochemistry
- AT were fixed in 10% neutral buffered formalin for at least 48 hours, trimmed, routinely processed for histology, sectioned at 4-µm thickness, and stained with H&E.
- Immunohistochemical (IHC) staining for CD68 (macrophage marker) was performed on sections of the AT. The primary antibody was a mouse monoclonal antibody (clone ED1; Serotec, Oxford, UK) at a dilution of 1:5,000 with an incubation period of 60 minutes. The primary antibody used for insulin IHC was a guinea pig monoclonal antibody (Dako North America Inc., Carpinteria, CA, USA) at a dilution of 1:800 and an incubation time of 30 minutes. Multiple tissues from a domesticated brown rat (Rattus norvegicus) were used as controls.
- Photomicrographs of each sample were acquired using a camera (Olympus DP70) mounted on a light microscope (Olympus BX41) with a commercial software program (cellSens; Olympus Corp., Tokyo, Japan). Up to 13 photomicrographs were captured for each sample of AT at ×200 and ×400 magnification at a resolution of 4,080×3,072 pixels.
- Up to 12 photomicrographs of each sample were randomly selected for quantitative analyses using a commercial software program (Photoshop CS6; Adobe Systems Inc., San Jose, CA, USA). In sections of the AT, the number of positive-staining cells for CD68 was recorded for each selected photomicrograph at ×200 magnification, and the mean was calculated per sample. Similarly, the surface areas of 10 randomly-selected adipocytes from each group were measured in pixels at ×400 magnification, and the mean was calculated per sample.
- Adipokine and cytokine mRNA quantification by real-time polymerase chain reaction
- The expression of key gene transcripts reported to be important in mediating inflammatory processes was examined via quantitative real-time polymerase chain reaction (RT-PCR). Genes whose expression levels were quantified included: adiponectin, TNF-α, IL-6, CD14, CD68, leptin, and glyceraldehyde 3-phosphate dehydrogenase as a housekeeping gene. FASTA mRNA sequences of these mRNA transcripts were obtained for R. norvegicus using the National Center for the Biotechnology Information (NCBI) database. Forward and reverse primers for the genes were then generated using NCBI Primer-Blast. Primer sequences were shown in Table 1. Primers were bought from Integrated DNA Technologies Inc. (Coralville, IA, USA).
- An iScript cDNA synthesis kit was employed to synthesize cDNAs from total RNA extract samples of dam AT. These were then combined with primers and SsoFast EvaGreen supermix for the quantitative PCR (qPCR). The product was quantified via a Bio-Rad CFX96 instrument (Bio-Rad Laboratories Inc.) using the manufacturer's guidelines. The normalized relative gene expression values were determined via delta Ct parameter.
- Serum adiponectin quantification via enzyme-linked immunosorbent assay
- Invitrogen (Camarillo, CA, USA) rat immunoassay adiponectin kit (cat#: KRP0041) was employed to quantity the amount of adiponectin in serum samples. The assay was conducted based on the guidelines provided by the manufacturer. Standards and samples were pipetted into a microplate precoated with a polyclonal antibody specific for adiponectin. Any available adiponectin is bound by immobilized antibody and later captured by purified anti-rat adiponectin monoclonal antibody. This is followed by the addition of conjugated mouse immunoglobulin G. Then plates were washed and substrate solution added. Colors developed in proportion to bound adiponectin quantity. Finally, the development of the color was stopped and the intensity of the color measured on a microplate reader (Spectra Max 190; Molecular Devices Corp., Sunnyvale, CA, USA) at 450 nm. Adiponectin levels were quantified using a standard curve. Significant differences in the concentration of adiponectin in serum was determined using one-way analysis of variance (ANOVA).
- Serum glucose concentration
- Serum glucose levels were determined via using 3,5-dinitrosalicylic acid (DNS) reagent. DNS reagent was prepared using a method that is standard for determining glucose levels [31]. This was followed by glucose assay using another technique employed previously for analyzing glucose concentration [32]. Briefly, DNS reagent was added to samples, placed in boiling water for a few minutes followed by cooling under cold water to stop reaction. Approximately 5 mL of deionized water was added to the mixture and absorbance read at 540 nm using a UV-vis spectrophotometer (UV-2401PC; Shimadzu Corp., Columbia, MD, USA). A standard curve was employed to quantify glucose concentration in serum samples.
- Data analysis
- In this study, we analyze the data for both 5 and 14 weeks' data sets using multivariate approach. All statistical analyses were performed using SAS software version 9.3 (SAS Institute, Cary, NC, USA). Animal weight data were represented as mean±standard deviation. The correlation and frequency procedures were employed to gain insight about the data. Furthermore, data were analyzed by multivariate analysis of variance (MANOVA). To finish the analysis, the random coefficients models were fitted to the data and compared using the likelihood ratio test. Furthermore, normality of dependent variable in MANOVA was satisfied.
- Additionally, statistical significant differences in the concentration of serum adiponectin proteins in treated and untreated animals were calculated via ANOVA. Also, significant differences in the amount of CD68+ cells, glucose and adipocyte size data were calculated similar to the adiponectin proteins results. Data was presented as mean±standard error. Significant differences were indicated as either P<0.05 or P<0.01.
METHODS
- Effect of 2AA and moderate high fat diet on body weight gain
- Body weight is important metric of diabetes. To assess the effect of in utero 2AA exposure, the weights of the rats were monitored. Animal weights were monitored for almost 3 months prior to the introduction of moderate high fat diet. Fig. 1 shows that animals in all treatment groups begin with same initial weights at week 1, but over time they start to disperse from each other and demonstrate increment in weight over time. Moreover, low dose group shows the highest weight findings over time, while high dose group at the bottom, and control group in between over time.
- Older rat weights during dietary changes are presented in Table 2. Animal weights of all groups were increasing from week 1 to week 5. Mean weight of the rats with low dose 2AA was higher than the rats with no or high dose of 2AA for both groups of diet. The rats without 2AA showed higher mean weights for all time points, as compared with the rats fed with high dose of 2AA. Up to week 2, the rats fed high fat diet for both no and low dose of 2AA showed lower weight, as compared with the rates fed regular fat diet for both no and low dose of 2AA. After week 2, the animal weights show reverse finding for both no and low dose of 2AA. However, the animals on high dose of 2AA and fed high fat diet displayed lower mean weights until week 2, as compared with the animals on high dose of 2AA and fed regular fat diet. This finding was reversed after week 2. These differences were not statistically significant.
- Histopathology via H&E and other immunohistochemistry
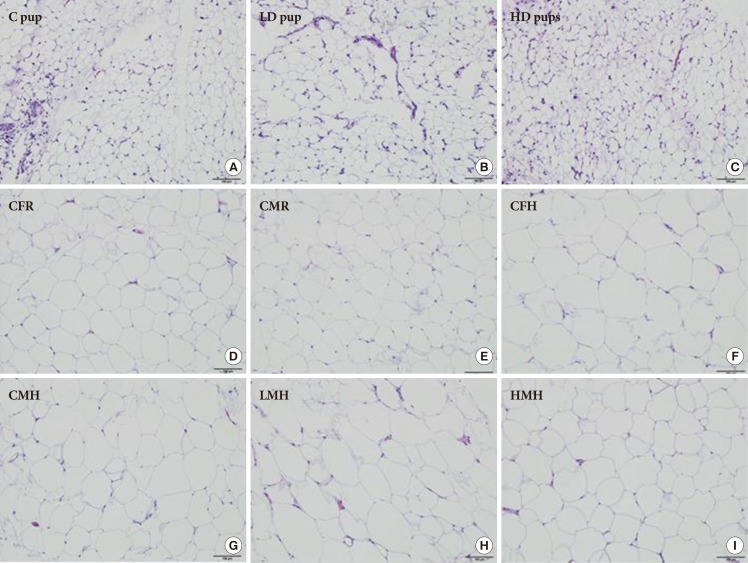
- Histologic examination of the AT in all three groups of young pups revealed small to moderate numbers of scattered macrophages between adipocytes, occasionally forming loose aggregates and surrounding capillaries, with fewer and scattered lymphocytes, mast cells, and plasma cells. Histologic examination of the AT in all groups of older pups revealed rare and scattered macrophages between adipocytes. No other significant histologic changes are evident between the groups on histologic examination (Fig. 2).
- IHC staining for CD68 in all three groups of young pups revealed frequent, moderate to strong, and cytoplasmic staining of macrophages located between adipocytes, occasionally forming loose aggregates and surrounding capillaries. IHC staining for CD68 in all groups of older pups revealed rare, moderate to strong, and cytoplasmic staining of macrophages scattered between adipocytes (Supplementary Fig. 1).
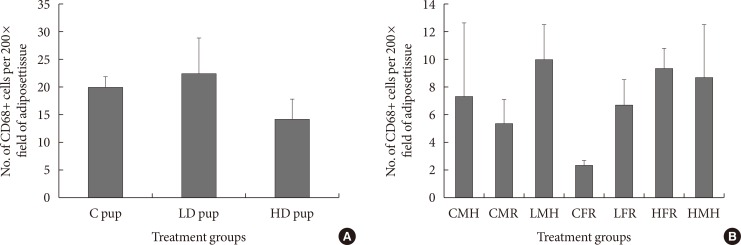
- To understand the role of insulin resistance in the current study, CD68 positive cells was determined in both the young and older animals. CD68 has been previously employed as a marker for macrophages [5]. The presence of CD68+ cells in AT in the 2 weeks old rats were not significantly different. Nonetheless, the low dose animals showed slightly higher levels of CD68+ cells while the high dose group indicated slightly fewer CD68+ cells (Fig. 3). When the intrauterine 2AA exposure is combined with dietary restrictions 3 months postwean, CD68+ cell values seem generally lower than that of the 2 weeks old animals. The control groups have shown significantly fewer CD68+ cells in comparison to 2AA treated and moderate high fat groups. For instance, low dose male high fat, high dose female on regular diet, and high dose male rats on moderate high fat had the highest numbers of CD68+ cells (Fig. 3).
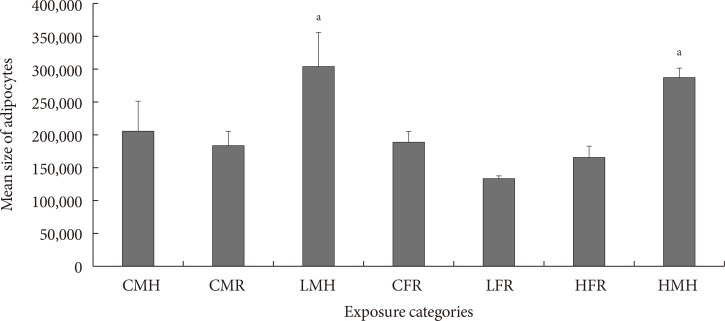
- Mean size of adipocytes is indicated in Fig. 4. Similar to the quantity of CD68+ cells in ATs, the low and high dose male moderate high fat animals had a significantly higher mean adipocyte sizes. No significant differences between the control male high fat, control male regular diet, control female regular diet, low dose female regular diet, and high dose female regular diet were noted.
- To determine susceptibility to diabetes, serum glucose levels were measured. One of the hallmarks of diabetes is elevated blood glucose amounts. Concentration of serum glucose was significantly elevated in all treated groups. Combining in utero exposure to 2AA with moderate high fat elicited significantly higher serum glucose levels (Fig. 5).
- The expression of a select adipokines and cytokines by quantitative real-time polymerase chain reaction
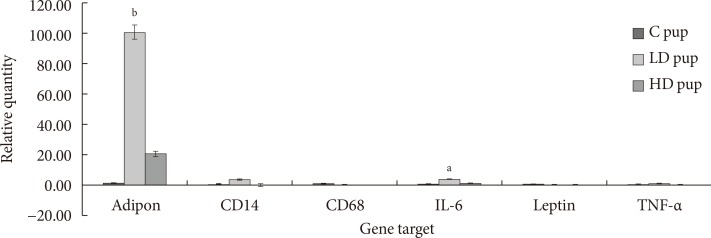
- The goal of the current study is to examine the expression of some adipokines and cytokines in the AT of progeny exposed to 2AA in utero. Profile of CD68 and leptin mRNA amounts were not observed in pups after 2 week postpartum. However, adiponectin, CD14, IL-6, and TNF-α seem to be up-regulated in animals whose mothers ingested 2AA during gestation through postnatal period. Adiponectin and IL-6 in particular was more highly expressed in the 50 mg/kg-2AA progeny and 100 mg/kg-2AA rats than the control (Fig. 6).
- Three months postwean, quantification of the same genes as in the pups showed similar expression patterns. In this case, CD14, CD68, leptin, and TNF-α levels were not observed at all. Rather, adiponectin and IL-6 transcripts were consistently up-regulated in the AT of offspring whose diet involved regular and moderate high fat diet for 6 weeks post-2AA exposure (Fig. 7).
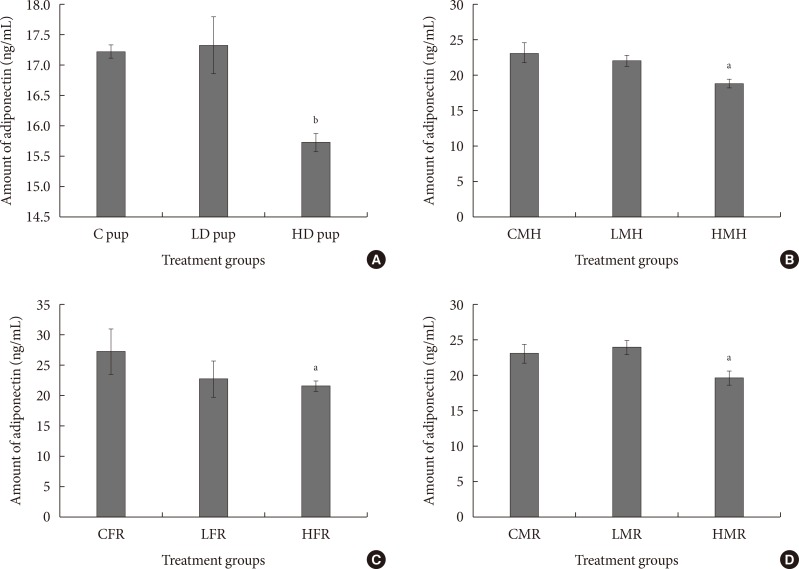
- To validate adipokine and cytokine mRNA values, adiponectin was measured using enzyme-linked immunosorbent assay. In all the treated animals, adiponectin amount was relatively less compared to the control groups (Fig. 8). Adiponectin concentration was significantly less in the high dose group of the neonates. Similarly, the moderate high fat and regular diet male rats indicated significantly less adiponectin quantity in serum.
RESULTS
Serum glucose concentration determination
Serum enzyme-linked immunosorbent assay quantification of adiponectin concentration
- The present study was undertaken to examine the role of exposure to environmental PAHs during early years of life and diabetic susceptibility. Morphometric indices highlighting diabetes outcome were measured. Monitoring of weight of rats in all three treatment groups differed over time. Over 14 weeks, low dose treatment group showed the highest weight measurements compared with control and high dose groups. Toward the end of the 3 months monitoring period, there was an obvious cumulative weight differences. Additionally, 14 successive weights of the animals are significantly different overall, when averaged over treatment groups across time. In other words, there is a significant time effect overall.
- With respect to the 5 weeks dietary alterations monitoring, the random intercept and trend model is the better fit for the data as compared to the random intercept model. Considering the results of the analysis based on the random intercept and trend model, we identify that there is a significant increase in animal weight over time overall. However, some animals show no increase in weight over time which requires further evaluation of the underlying factors for the failure of weight gain. Briefly this approach helps to identify the animals which rats were not showing weight gain and support the relevance of individualized clinical effects in terms of 2AA and diet effects.
- This study was undertaken to examine the diabetic-like effects of 2AA in AT of pups. The dams ingested 2AA from gestation through postnatal period. Histopathological examination was performed to observe the qualitative effects of combined diet and 2AA exposure in utero on the AT, followed by CD68 IHC to detect and quantify the presence of macrophages in AT. Usually, the number of CD68+ cells positively correlates with an increased adipocyte size [533]. The number of CD68+ cells in the AT of neonates was not significantly different between treated and control groups. In older rats that were exposed to 2AA in utero and also consumed moderate high fat diet, the quantity of CD68+ cells were slightly greater, though not that significant, than control groups. For instance, the low dose male high fat, high dose male high fat, and high dose female regular diet animals showed similarly-high levels of CD68+ cells in the AT. Similarly, histologic assessment of the AT indicated no significant differences. However, when comparing between the younger and the older groups, all young pups had macrophages between adipocytes that occasionally form loose aggregates around capillaries. This feature was not present in the older pups, such that it likely represents a normal aging change in the distribution of these resident macrophages in AT.
- Diabetes is a disorder that results in elevated blood sugar due to the production of insufficient insulin to effectively regulate this blood sugar. Slightly elevated serum glucose levels in animals that were exposed to 2AA and also ingested moderate high fat diet were observed likely suggesting a greater vulnerability to diabetes in exposed group.
- We also assessed the size of the adipocytes of treated and untreated groups. Mean adipocyte sizes seem to be greater for male rats fed a combined moderate high fat diet and 2AA in utero. For instance, rats with any exposure to 2AA, regardless on low or high fat diet, exhibited adipocyte sizes one-third greater than the untreated groups. Enlarged adipocyte is directly correlated to the number of macrophages, adipokines, and cytokines present in the AT. The over-production of these proteins tends to favor a pro-inflammatory response. Thus individuals with extended adipocytes are more susceptible to T2DM [3435]. This assertion is corroborated by a study involving elderly men and women in Pennsylvania [36]. The researchers reported that subcutaneous adipocyte size especially in the abdominal region is predictive of T2DM in the future [37]. A more recent report also indicated that specific adipocyte volume may forecast future increased risk for T2DM associated conditions [38].
- Furthermore, the expression of mRNA levels that may indicate weakness towards T2DM were also examined. In the neonate rats, the mRNA expression of CD14, IL-6, and TNF-α were up-regulated in pups that belonged to dams which, ingested 2AA adulterated diet during gestation through postpartum. Leptin and CD68 genes were not significantly altered in exposed groups relative to control neonates. Up-regulated transcripts in treated pups have been shown in the past to strongly modulate diabetic response [394041]. Previous studies involving exposure to various environmental contaminants show adverse health effects in both animal and human subjects. Adverse health effects were shown in the form of up-regulation of genes such as CD14 and TNF-α [424344]. In a yet to be published work from our laboratory, gestational rats fed 2AA diet displayed a dose-dependent mRNA expression of TNF-α, leptin, and IL-6 transcripts.
- Additional quantification of diabetic-like transcripts were carried out in older rats exposed to 2AA in utero and consequently ingested moderate high fat diet. The goal was to observe characteristic neonatal mRNA expression patterns that can be used as models of future alterations in gene expression schemes. CD14, TNF-α, leptin, and CD68 proteins in the AT of older rats were not expressed. On the other hand, Adiponectin and IL-6 mRNA quantity were significantly up-regulated in animals fed moderately high fat diet. Similarly, female rats that were exposed to 2AA in utero and consequently fed regular diet showed identical gene expression values. In the past, inflammatory markers, adiponectin and IL-6 transcripts were demonstrated to be involved in diabetic-like response in animal models [4546]. It is interesting to note the over-expression of adiponectin and IL-6 in rats fed moderate high fat in conjunction with 2AA exposure. Higher expressions of these transcripts demonstrate the role inflammation plays in the treated group.
- In general, the level of adiponectin in serum was reduced in either 2AA treated or subjects that were on moderate high fat diet. This observation is consistent with others that were noted recently. They reported a reduction in serum adiponectin of human subjects that were diabetic [4748]. The adiponectin protein trend is in contrast to the gene expression patterns.
- This study was undertaken to assess whether neonatal exposure outcomes can be predictive of disease susceptibility in adult rats. We focused on the AT because excess amounts of this tissue predisposes one to insulin resistance. Quantification of a select adipokines and cytokine mRNA levels revealed a consistent over-expression in progeny exposed to 2AA in utero. Up-regulation of adiponectin and IL-6 genes were observed in pups whose mothers ingested 2AA during gestation. Older rats with history of 2AA exposure still showed significant proportion of adiponectin and IL-6 in AT long after cessation of exposure. Combination of intrauterine 2AA toxicity with moderate high fat diet exhibited gene expression patterns similar to those of the neonates. Though a follow-up analysis involving IHC of the AT indicated no significant malformations; however, CD68+ cells were greater in the animals treated to 2AA. Similarly, mean sizes of the adipocytes were larger in treated and combined 2AA and moderate high fat animals. Monitoring of the progeny weight for 14 weeks implementing dietary changes uncovered interesting trends. The high dose group to have lower body weights while the low dose rats had higher body weight gain. Even after, introducing moderate high fat diet for 5 weeks did not alter the weight gain trajectory. Furthermore, serum glucose concentration indicated increased levels consistent with higher risk for diabetes. From the preceding, it appears intrauterine 2AA disturbance, when combined with excess fat accumulation will lead to greater risk for the diabetic condition.
DISCUSSION
-
Acknowledgements
- The project was supported by funding from Georgia Southern University's Research and Economic Development. We would like to acknowledge funding from Georgia Southern University's Office of the Vice President for Research & Economic Development. We are grateful to Mr. Craig Banks, Director of the GSU Animal Facility for his assistance in various ways. Dr. Tina Herfel of Harlan Laboratories assisted us to incorporate 2AA into rat diet. Mr. Viral Panchal of the Department of Biostatistics, Jiann-Ping Hsu College of Public Health, Georgia Southern University analyzed the weight gain data. We are also grateful to Dr. Elizabeth Howerth for looking over the IHC data.
ACKNOWLEDGMENTS
-
CONFLICTS OF INTEREST: No potential conflict of interest relevant to this article was reported.
NOTES
Supplementary Material
Supplementary Fig. 1
- 1. Mokdad AH, Ford ES, Bowman BA, Nelson DE, Engelgau MM, Vinicor F, Marks JS. The continuing increase of diabetes in the US. Diabetes Care 2001;24:412.ArticlePDF
- 2. Wild S, Roglic G, Green A, Sicree R, King H. Global prevalence of diabetes: estimates for the year 2000 and projections for 2030. Diabetes Care 2004;27:1047-1053. ArticlePubMedPDF
- 3. Hu FB. Sedentary lifestyle and risk of obesity and type 2 diabetes. Lipids 2003;38:103-108. ArticlePubMed
- 4. Hu FB, Li TY, Colditz GA, Willett WC, Manson JE. Television watching and other sedentary behaviors in relation to risk of obesity and type 2 diabetes mellitus in women. JAMA 2003;289:1785-1791. ArticlePubMed
- 5. Di Gregorio GB, Yao-Borengasser A, Rasouli N, Varma V, Lu T, Miles LM, Ranganathan G, Peterson CA, McGehee RE, Kern PA. Expression of CD68 and macrophage chemoattractant protein-1 genes in human adipose and muscle tissues: association with cytokine expression, insulin resistance, and reduction by pioglitazone. Diabetes 2005;54:2305-2313. PubMed
- 6. Wellen KE, Hotamisligil GS. Inflammation, stress, and diabetes. J Clin Invest 2005;115:1111-1119. ArticlePubMedPMC
- 7. Kostic AD, Gevers D, Siljander H, Vatanen T, Hyotylainen T, Hamalainen AM, Peet A, Tillmann V, Poho P, Mattila I, Lahdesmaki H, Franzosa EA, Vaarala O, de Goffau M, Harmsen H, Ilonen J, Virtanen SM, Clish CB, Oresic M, Huttenhower C, Knip M. DIABIMMUNE Study Group. Xavier RJ. The dynamics of the human infant gut microbiome in development and in progression toward type 1 diabetes. Cell Host Microbe 2015;17:260-273. ArticlePubMedPMC
- 8. Edwards TM, Myers JP. Environmental exposures and gene regulation in disease etiology. Cien Saude Colet 2008;13:269-281. ArticlePubMed
- 9. Thayer KA, Heindel JJ, Bucher JR, Gallo MA. Role of environmental chemicals in diabetes and obesity: a National Toxicology Program workshop review. Environ Health Perspect 2012;120:779-789. ArticlePubMedPMC
- 10. Thompson RF, Einstein FH. Epigenetic basis for fetal origins of age-related disease. J Womens Health (Larchmt) 2010;19:581-587. ArticlePubMed
- 11. Landrigan PJ, Carlson JE, Bearer CF, Cranmer JS, Bullard RD, Etzel RA, Groopman J, McLachlan JA, Perera FP, Reigart JR, Robison L, Schell L, Suk WA. Children's health and the environment: a new agenda for prevention research. Environ Health Perspect 1998;106(Suppl 3):787-794. ArticlePubMedPMC
- 12. Landrigan PJ, Garg A. Chronic effects of toxic environmental exposures on children's health. J Toxicol Clin Toxicol 2002;40:449-456. ArticlePubMed
- 13. Selevan SG, Kimmel CA, Mendola P. Identifying critical windows of exposure for children's health. Environ Health Perspect 2000;108(Suppl 3):451-455. ArticlePubMedPMC
- 14. Bott S, Shafagoj YA, Sawicki PT, Heise T. Impact of smoking on the metabolic action of subcutaneous regular insulin in type 2 diabetic patients. Horm Metab Res 2005;37:445-449. ArticlePubMed
- 15. Boudreau MD, Taylor HW, Baker DG, Means JC. Dietary exposure to 2-aminoanthracene induces morphological and immunocytochemical changes in pancreatic tissues of Fisher-344 rats. Toxicol Sci 2006;93:50-61. ArticlePubMed
- 16. Xu H, Barnes GT, Yang Q, Tan G, Yang D, Chou CJ, Sole J, Nichols A, Ross JS, Tartaglia LA, Chen H. Chronic inflammation in fat plays a crucial role in the development of obesity-related insulin resistance. J Clin Invest 2003;112:1821-1830. ArticlePubMedPMC
- 17. Moller DE. Potential role of TNF-alpha in the pathogenesis of insulin resistance and type 2 diabetes. Trends Endocrinol Metab 2000;11:212-217. PubMed
- 18. Swaroop JJ, Rajarajeswari D, Naidu JN. Association of TNF-alpha with insulin resistance in type 2 diabetes mellitus. Indian J Med Res 2012;135:127-130. ArticlePubMedPMC
- 19. Senn JJ, Klover PJ, Nowak IA, Mooney RA. Interleukin-6 induces cellular insulin resistance in hepatocytes. Diabetes 2002;51:3391-3399. ArticlePubMedPDF
- 20. Pedersen BK, Febbraio MA. Point: interleukin-6 does have a beneficial role in insulin sensitivity and glucose homeostasis. J Appl Physiol (1985) 2007;102:814-816. PubMed
- 21. Haluzik M, Parizkova J, Haluzik MM. Adiponectin and its role in the obesity-induced insulin resistance and related complications. Physiol Res 2004;53:123-129. PubMed
- 22. Stefan N, Stumvoll M. Adiponectin: its role in metabolism and beyond. Horm Metab Res 2002;34:469-474. ArticlePubMed
- 23. Fernandez-Real JM, Broch M, Richart C, Vendrell J, Lopez-Bermejo A, Ricart W. CD14 monocyte receptor, involved in the inflammatory cascade, and insulin sensitivity. J Clin Endocrinol Metab 2003;88:1780-1784. ArticlePubMedPDF
- 24. Fernandez-Real JM, Perez del Pulgar S, Luche E, Moreno-Navarrete JM, Waget A, Serino M, Sorianello E, Sanchez-Pla A, Pontaque FC, Vendrell J, Chacon MR, Ricart W, Burcelin R, Zorzano A. CD14 modulates inflammation-driven insulin resistance. Diabetes 2011;60:2179-2186. ArticlePubMedPMCPDF
- 25. Klok MD, Jakobsdottir S, Drent ML. The role of leptin and ghrelin in the regulation of food intake and body weight in humans: a review. Obes Rev 2007;8:21-34. ArticlePubMed
- 26. Havel PJ. Role of adipose tissue in body-weight regulation: mechanisms regulating leptin production and energy balance. Proc Nutr Soc 2000;59:359-371. ArticlePubMed
- 27. US Department of Health and Human Services, Public Health Service, ATSDR Agency for Toxic Substances and Disease Registry. Toxicological profile for polycyclic aromatic hydrocarbons cited 2016 Jul 20. Available from: http://www.atsdr.cdc.gov/ToxProfiles/tp69.pdf.
- 28. Gato WE, Hales DB, Means JC. Hepatic gene expression analysis of 2-aminoanthracene exposed Fisher-344 rats reveal patterns indicative of liver carcinoma and type 2 diabetes. J Toxicol Sci 2012;37:1001-1016. ArticlePubMed
- 29. StatsToDo. Computer program to calculate sample size requirement in the analysis of variance cited 2016 Jul 20. Available from: http://www.statstodo.com/SSizAOV_Pgm.php#.
- 30. Meek TH, Eisenmann JC, Garland T Jr. Western diet increases wheel running in mice selectively bred for high voluntary wheel running. Int J Obes (Lond) 2010;34:960-969. ArticlePubMedPDF
- 31. Wood WA, Kellogg ST. Chapter 40, Isolation of 1,4-b-D-glucan 4-glucanohydrolases of talaromyces emersonii. Methods in enzymology, vol. 160. London: London Academic Press; 1988. p. 363-367.
- 32. Wood WA, Kellogg ST. Chapter 9, Methods for measuring cellulase activities. Methods in enzymology, vol. 160. London: London Academic Press; 1988. p. 87-111.
- 33. Weisberg SP, McCann D, Desai M, Rosenbaum M, Leibel RL, Ferrante AW Jr. Obesity is associated with macrophage accumulation in adipose tissue. J Clin Invest 2003;112:1796-1808. ArticlePubMedPMC
- 34. Fantuzzi G. Adipose tissue, adipokines, and inflammation. J Allergy Clin Immunol 2005;115:911-919. ArticlePubMed
- 35. Skurk T, Alberti-Huber C, Herder C, Hauner H. Relationship between adipocyte size and adipokine expression and secretion. J Clin Endocrinol Metab 2007;92:1023-1033. ArticlePubMed
- 36. Goodpaster BH, Krishnaswami S, Resnick H, Kelley DE, Haggerty C, Harris TB, Schwartz AV, Kritchevsky S, Newman AB. Association between regional adipose tissue distribution and both type 2 diabetes and impaired glucose tolerance in elderly men and women. Diabetes Care 2003;26:372-379. ArticlePubMedPDF
- 37. Lonn M, Mehlig K, Bengtsson C, Lissner L. Adipocyte size predicts incidence of type 2 diabetes in women. FASEB J 2010;24:326-331. ArticlePubMedPDF
- 38. Cotillard A, Poitou C, Torcivia A, Bouillot JL, Dietrich A, Kloting N, Gregoire C, Lolmede K, Bluher M, Clement K. Adipocyte size threshold matters: link with risk of type 2 diabetes and improved insulin resistance after gastric bypass. J Clin Endocrinol Metab 2014;99:E1466-E1470. ArticlePubMed
- 39. Kolaczynski JW, Nyce MR, Considine RV, Boden G, Nolan JJ, Henry R, Mudaliar SR, Olefsky J, Caro JF. Acute and chronic effects of insulin on leptin production in humans: studies in vivo and in vitro. Diabetes 1996;45:699-701. ArticlePubMed
- 40. Aizawa-Abe M, Ogawa Y, Masuzaki H, Ebihara K, Satoh N, Iwai H, Matsuoka N, Hayashi T, Hosoda K, Inoue G, Yoshimasa Y, Nakao K. Pathophysiological role of leptin in obesity-related hypertension. J Clin Invest 2000;105:1243-1252. ArticlePubMedPMC
- 41. Richardson SJ, Willcox A, Bone AJ, Foulis AK, Morgan NG. Islet-associated macrophages in type 2 diabetes. Diabetologia 2009;52:1686-1688. ArticlePubMedPDF
- 42. Hernandez ML, Harris B, Lay JC, Bromberg PA, Diaz-Sanchez D, Devlin RB, Kleeberger SR, Alexis NE, Peden DB. Comparative airway inflammatory response of normal volunteers to ozone and lipopolysaccharide challenge. Inhal Toxicol 2010;22:648-656. ArticlePubMedPMC
- 43. Dangleben NL, Skibola CF, Smith MT. Arsenic immunotoxicity: a review. Environ Health 2013;12:73ArticlePubMedPMCPDF
- 44. De Coster S, van Larebeke N. Endocrine-disrupting chemicals: associated disorders and mechanisms of action. J Environ Public Health 2012;2012:713696PubMedPMC
- 45. Upadhyaya S, Kadamkode V, Mahammed R, Doraiswami C, Banerjee G. Adiponectin and IL-6: mediators of inflammation in progression of healthy to type 2 diabetes in Indian population. Adipocyte 2014;3:39-45. ArticlePubMed
- 46. Ndisang JF, Jadhav A. Hemin therapy improves kidney function in male streptozotocin-induced diabetic rats: role of the heme oxygenase/atrial natriuretic peptide/adiponectin axis. Endocrinology 2014;155:215-229. ArticlePubMedPDF
- 47. Aleidi S, Issa A, Bustanji H, Khalil M, Bustanji Y. Adiponectin serum levels correlate with insulin resistance in type 2 diabetic patients. Saudi Pharm J 2015;23:250-256. ArticlePubMed
- 48. Abdelgadir M, Karlsson AF, Berglund L, Berne C. Low serum adiponectin concentrations are associated with insulin sensitivity independent of obesity in Sudanese subjects with type 2 diabetes mellitus. Diabetol Metab Syndr 2013;5:15ArticlePubMedPMCPDF
REFERENCES
Fig. 1
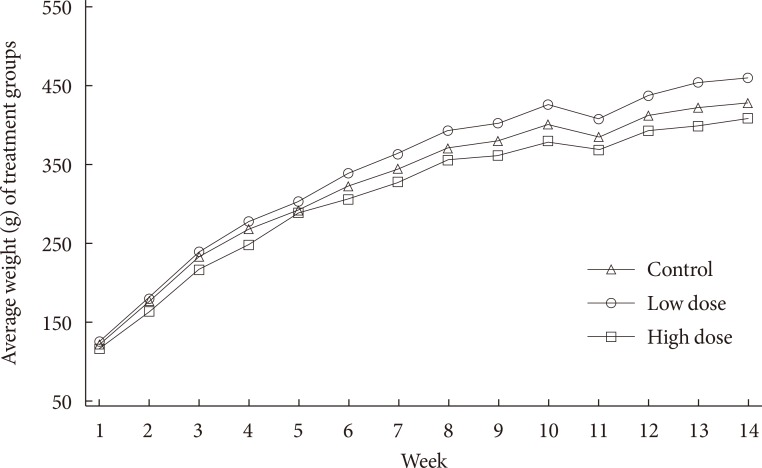
Mean weights, g, (n=12 to 15) of each treatment group over 14 weeks. Broadly, progeny were exposed to 0 mg/kg 2-aminoanthracene (2AA) diet (control), 50 mg/kg 2AA diet (low dose), and 100 mg/kg 2AA diet (high dose) in utero. Time seem to have an effect on weight gain, no statistical differences were noted with regards to 2AA treatment.
Fig. 2

Histologic characterization (H&E stain, 100 µm) of adipose tissue of Sprague Dawley rats exposed to (A) 0 mg/kg- (control [C] pup), (B) 50 mg/kg- (low dose [LD] pup), and (C) 100 mg/kg-2-aminoanthracene (high dose [HD] pup) from gestation through of the postnatal period (H&E stain). Older pups were fed moderate high and regular diet for 6 weeks. Select images include: (D) control female regular diet (CFR); (E) control male regular diet (CMR); (F) control high fat diet (CFH); (G) control male high fat diet (CMH); (H) low dose male high fat (LMH); and (I) high dose male high fat diet (HMH). Small to moderate numbers of macrophages are scattered between adipocytes in all three groups of young pups. Fewer numbers of macrophages are present in all groups of older pups.
Fig. 3

Numbers of CD68 positive cells (n=6 to 8) in adipose tissue of Sprague Dawley rats. (A) Intrauterine treatment to 2-aminoanthracene groups included: control (C) pup (0 mg/kg diet), low dose (LD) pup (50 mg/kg diet), and high dose (HD) pup (100 mg/kg diet). (B) In utero exposure was combined with dietary ingestions of regular diet (5M30 rodent diet; PMI Nutrition International) and high fat diet (Adjusted Fat Diet TD.96132) for 6 weeks 3 months postwean. Though the treated exposed rats indicated higher CD68 positive values, statistical inference showed they were not significant. CMH, control male high fat; CMR, control male regular diet; LMH, low dose male high fat; CFR, control female regular diet; LFR, low dose female regular diet; HFR, high dose female regular diet; HMH, high dose high fat.
Fig. 4

Mean size of adipocytes (pixels) (n=5 to 6). Significant increment in the adipocyte size observed for the LMH and HMH animals. CMH, control male high fat; CMR, control male regular diet; LMH, low dose male high fat; CFR, control female regular diet; LFR, low dose female regular diet; HFR, high dose female regular diet; HMH, high dose high fat. aP<0.05.
Fig. 5
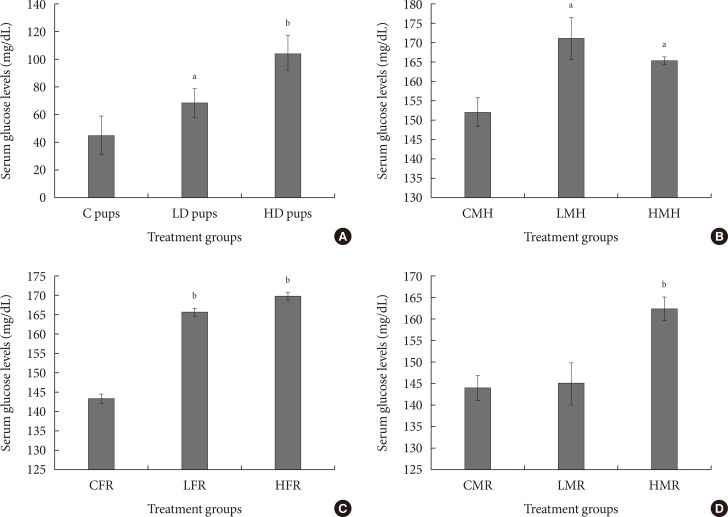
Mean serum glucose concentration (mg/dL) of neonates exposed to 2-aminoanthracene (2AA) in utero. (A) Dams ingested 0 mg/kg (control [C]); 50 mg/kg (low dose [LD]); and 100 mg/kg (high dose [HD])-2AA from gestation through 2 weeks postnatal period; (B) control male high fat (CMH), low dose male high fat (LMH), and high dose high fat (HMH); (C) control female regular diet (CFR), low dose female regular diet (LFR), and high dose female regular diet (HFR); (D) control male regular diet (CMR), low dose male regular diet (LMR), and high dose male regular diet (HMR). Significant differences in serum glucose concentration were noted as aP<0.05, bP<0.01.
Fig. 6
Relative expression (ΔCq) of adipose tissue genes involved in diabetic-related conditions. In utero exposure to 2-aminoanthracene (2AA) were 0 mg/kg 2AA diet (control [C]), 50 mg/kg diet (low dose [LD]), and 100 mg/kg diet (high dose [HD]) from gestation through 14 days postnatal. IL-6, interleukin-6; TNF-α, tumor necrosis factor α. Significant changes in differential gene expression is noted as aP<0.05, bP<0.01.
Fig. 7
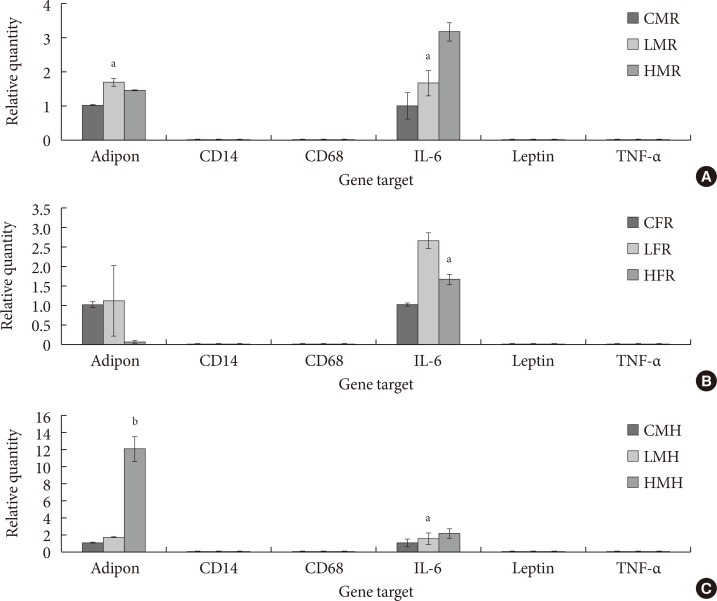
Relative expression (ΔCq) of adipokine and cytokines involved in diabetic-related conditions. (A) In utero exposure of 0 mg/kg 2-aminoanthracene diet (control), 50 mg/kg diet (low dose), and 100 mg/kg diet (high dose) from gestation through 14 days postnatal was combined with dietary ingestions of regular diet (5M30 rodent diet; PMI Nutrition International) and high fat diet (Adjusted Fat Diet TD.96132) for 6 weeks 3 months postwean. (A) Control male regular diet (CMR), low dose male regular diet (LMR), and high dose male regular diet (HMR). (B) Control female regular diet (CFR), low dose female regular diet (LFR), and high dose female regular diet (HFR). (C) Control male high fat (CMH), low dose male high fat (LMH), and high dose high fat (HMH). IL-6, interleukin-6; TNF-α, tumor necrosis factor α. Significant differences (aP<0.05, bP<0.01) in adiponectin and IL-6 mRNA expression were noted.
Fig. 8

(A-D) Serum adiponectin levels in rats exposed to 2-aminoanthracene (2AA) in utero and moderate high fat 3 months postwean. Changes in adiponectin amounts were significant (P<0.01) in neonatal rats but not significantly altered in the regular dietary female animals. Both the male regular and high fat dietary group showed significant (P<0.05) reduction of adiponectin in 2AA treated rats. C, control; LD, low dose; HD, high dose; CMH, control male high fat; LMH, low dose male high fat; HMH, high dose high fat; CFR, control female regular diet; LFR, low dose female regular diet; HFR, high dose female regular diet; CMR, control male regular diet; LMR, low dose male regular diet; HMR, high dose male regular diet. aP<0.05, bP<0.01.
Table 1
![dmj-40-494-i001.jpg]()
Nucleotide sequences designed as forward and reverse primers of each specific gene
Table 2
![dmj-40-494-i002.jpg]()
Changes in animal weights (g), (n=12 to 15) after administration of low and high doses of 2AA in combination to regular rat chow diet and moderate high fat diet fed Sprague Dawley rat progeny for 5 weeks
Figure & Data
References
Citations
Citations to this article as recorded by 
- The Role of Persistent Organic Pollutants in Obesity: A Review of Laboratory and Epidemiological Studies
Jan Aaseth, Dragana Javorac, Aleksandra Djordjevic, Zorica Bulat, Anatoly Skalny, Irina Zaitseva, Michael Aschner, Alexey Tinkov
Toxics.2022; 10(2): 65. CrossRef - The Association between Urinary Polycyclic Aromatic Hydrocarbons Metabolites and Type 2 Diabetes Mellitus
Xue Wang, Ang Li, Qun Xu
International Journal of Environmental Research and Public Health.2022; 19(13): 7605. CrossRef - Dietary ingestion of 2-aminoanthracene (2AA) and the risk for type-1 diabetes (T1D)
Isaiah Seise, Zachary A. Pilz, Moses Yeboah Kusi, Bethany Bogan, Brittany Jean McHale, Worlanyo E. Gato
Journal of Environmental Science and Health, Part A.2020; 55(14): 1638. CrossRef - Association of the IL6 Gene Polymorphism with Component Features of Metabolic Syndrome in Obese Subjects
Elham Barati, Hamideh Ghazizadeh, Fatemeh Sadabadi, Elham Kazemi, Gordon A. Ferns, Amir Avan, Majid Ghayour-Mobarhan
Biochemical Genetics.2019; 57(5): 695. CrossRef - The hepatic effects in dams that ingested 2-aminoanthracene during gestation and lactation
Raven E Ulieme, Surjania Awer, John C Stagg, Wilson Yau, Worlanyo E Gato
Toxicology and Industrial Health.2019; 35(9): 568. CrossRef
 PubReader
 Cite
Cite