- Current
- Browse
- Collections
-
For contributors
- For Authors
- Instructions to authors
- Article processing charge
- e-submission
- For Reviewers
- Instructions for reviewers
- How to become a reviewer
- Best reviewers
- For Readers
- Readership
- Subscription
- Permission guidelines
- About
- Editorial policy
Articles
- Page Path
- HOME > Diabetes Metab J > Volume 39(5); 2015 > Article
-
Original ArticlePathophysiology The Preventive Effects of 8 Weeks of Resistance Training on Glucose Tolerance and Muscle Fiber Type Composition in Zucker Rats
- Ji-yeon Kim1, Mi Jung Choi1, Byunghun So1, Hee-jae Kim1, Je Kyung Seong2,3, Wook Song1,4
-
Diabetes & Metabolism Journal 2015;39(5):424-433.
DOI: https://doi.org/10.4093/dmj.2015.39.5.424
Published online: October 22, 2015
1Health and Exercise Science Laboratory, Institute of Sports Science, Seoul National University College of Education, Seoul, Korea.
2Laboratory of Developmental Biology and Genomics, BK21 Program for Veterinary Science, Institute for Veterinary Science, Seoul National University College of Veterinary Medicine, Seoul, Korea.
3Korea Mouse Phenotyping Center (KMPC), Seoul, Korea.
4Institute on Aging, Seoul National University College of Medicine, Seoul, Korea.
- Corresponding author: Wook Song. Health and Exercise Science Laboratory, Institute of Sports Science and Institute on Aging, Seoul National University, 599 Gwanak-ro, Gwanak-gu, Seoul 08826, Korea. songw3@snu.ac.kr
Copyright © 2015 Korean Diabetes Association
This is an Open Access article distributed under the terms of the Creative Commons Attribution Non-Commercial License (http://creativecommons.org/licenses/by-nc/3.0/) which permits unrestricted non-commercial use, distribution, and reproduction in any medium, provided the original work is properly cited.
ABSTRACT
-
Background
- We investigated the therapeutic effects of resistance training on Zucker rats before and after the onset of diabetes to understand the importance of the timing of exercise intervention. We assessed whether 8 weeks of resistance training ameliorated impaired glucose tolerance and altered muscle fiber type composition in Zucker rats.
-
Methods
- Five-week-old male Zucker rats were divided into Zucker lean control (ZLC-Con), non-exercised Zucker diabetic fatty (ZDF-Con), and exercised Zucker diabetic fatty (ZDF-Ex) groups. The ZDF-Ex rats climbed a ladder three times a week for 8 weeks. Intraperitoneal glucose tolerance tests (IPGTT) were performed on the 1st and 8th weeks of training, and grip strength was measured during the last week. We also measured glucose transporter 4 (GLUT4) expression by Western blot and immunofluorescence. Moreover, immunohistochemistry was performed to assess muscle fiber type composition.
-
Results
- Fasting glucose levels and area under the curve responses to IPGTTs gradually increased as diabetes progressed in the ZDF-Con rats but decreased in the ZDF-Ex rats. Grip strength decreased in the ZDF-Con rats. However, resistance training did not improve grip strength in the ZDF-Ex rats. GLUT4 expression in the ZLC-Con and the ZDF-Con rats did not differ, but it increased in the ZDF-Ex rats. The proportions of myosin heavy chain I and II were lower and higher, respectively, in the ZDF-Con rats compared to the ZLC-Con rats. Muscle fiber type composition did not change in the ZDF-Ex rats.
-
Conclusion
- Our results suggest that regular resistance training initiated at the onset of diabetes can improve glucose tolerance and GLUT4 expression without changing muscle morphology in Zucker rats.
- Type 2 diabetes mellitus (T2DM) is rapidly becoming a worldwide epidemic because of a combination of sedentary lifestyles, physical inactivity, high nutrient intake, and genetic factors. T2DM is characterized by hyperglycemia and hyperinsulinemia. Impaired glucose tolerance (IGT) is an intermediate condition between normal and diabetic status [12]. Chronic T2DM leads to extensive muscle dysfunction, including loss of skeletal muscle mass, muscle weakness, reduced oxidative capacity, and peripheral insulin resistance [3].
- The Zucker diabetic fatty (ZDF) rat is a commonly used model for T2DM. This type of rat displays characteristics similar to T2DM in humans [45]. The progression of diabetes in the ZDF rats is defined by several age-dependent stages. The hyperglycemic condition rapidly progresses beginning at 4 weeks of age, and the blood glucose concentration reaches a maximal steady-state level after 12 weeks of age [5].
- Skeletal muscles undergo glucose utilization and lipid metabolism. The metabolic characteristics of skeletal muscle depend on its mass and fiber type [678]. Mature rat skeletal muscle fibers are generally classified according to the presence of four different myosin heavy chain (MHC) isoforms: type I (slow oxidative), IIa (fast glycolytic/oxidative), IIx (hybrid), and IIb (fast glycolytic). Adult skeletal muscle demonstrates plasticity, with the ability to transform its fiber types, generally by switching between adjacent MHC isoforms (I↔IIa↔IIx↔IIb) in response to various external stimuli, including chronic contractile activity, loading state, motor neuron activity, and environmental and pathological conditions [910111213].
- Chronic contractile activity during resistance training can stimulate transitions between muscle fiber types, which is accompanied by corresponding changes in metabolic function. Several studies have reported that resistance training can induce muscle fiber-type shifting from fast to slow and between MHC isoforms [141516171819]. Additionally, research suggests that hyperinsulinemia and diabetes cause muscle fiber-type switching from MHC I to MHC II [20]. Individuals with T2DM and their offspring have proportionally fewer type I fibers, and thus, oxidative enzyme activity is lower than in normal individuals. Additionally, glucose transporter protein 4 (GLUT4) expression, which is more abundant in slow muscle fibers than in fast muscle fibers, is decreased [21222324].
- A number of studies have reported the effects of exercise on intraperitoneal glucose tolerance and IGT in chronic T2DM. However, the therapeutic effects of resistance exercise before and after the onset of diabetes have not been elucidated. Therefore, to obtain a better understanding of the importance of the timing of exercise intervention, we introduced resistance exercise training during the period (6 to 13 weeks of age) where diabetes characteristics in Zucker rats change most rapidly. GLUT4 expression and muscle fiber type composition were assessed to elucidate the effects of resistance exercise on skeletal muscle in diabetic rats.
INTRODUCTION
- Animals and research design
- Five-week-old male Zucker rats were used for the experiments. The animals were randomly assigned to one of the following groups: Zucker lean control (ZLC-Con, Lepr+/+; n=4); Zucker diabetic fatty control (ZDF-Con, Leprfa/fa; n=4); or Zucker diabetic fatty exercise (ZDF-Ex, n=4). All of the rats were housed in a controlled environment with a 12:12-hour light:dark cycle, and room temperature was maintained at 22℃. All of the rats were provided with water and food ad libitum as recommended by Genetic Models Co. (Purina, St. Louis, MO, USA). The animals were cared for in accordance with the Guide for the Care and Use of Laboratory Animals issued by the Institute of Laboratory Animal Resources, USA, 1996. The experimental protocol was approved by the Institutional Animal Care and Use Committee of Seoul National University. All of the experiments were conducted to minimize suffering and the number of animals used.
- Resistance training protocol
- The laddering exercise protocol was conducted according to the method by Lee et al. [25] with modifications. The rats in the ZDF-Ex group were forced to climb a vertical ladder (1 m long with 2 cm grid steps, inclined at 85°) 3 day/week for 8 weeks. Initially, the rats gained familiarity with the ladder by climbing without weight for 3 days during the adaptation period. The only encouragement necessary was an occasional handclap near the animal's tail. A food reward or stimulation, such as an electric shock or forced air, was not required. The initial weight attached to each animal's tail was 50% of its body weight. The rat was positioned at the bottom of the vertical ladder and was encouraged to climb with a slight touch to the tail. When the rat reached the top of the ladder, it was allowed to rest for 2 minutes. After the rest period, an additional 20 g of weight was added, and the rat was returned to the bottom of the ladder for subsequent climbs. If the rat was able to climb the ladder, an additional 20 g of weight was added on the next climb. This procedure was repeated until the rat climbed 10 times or the rat failed to climb the entire length of the ladder. In the subsequent exercise session, the initial intensity was set at 50% of the maximal weight lifted in the previous session during weeks 1 to 3, 70% of the maximal weight during weeks 4 to 6, and 80% of the maximal weight during the remaining weeks.
- Intraperitoneal glucose tolerance test
- Blood glucose concentration was measured by intraperitoneal glucose tolerance test (IPGTT) after 1 week of exercise training. The rats were given an intraperitoneal injection of 50% D-glucose solution (2 g/kg) and were fasted for 6 hours. Blood samples were drawn from the tail vein at 0, 15, 30, 60, 90, and 120 minutes after glucose administration. Blood glucose levels were measured using a glucometer (ACCU-CHEK; Roche Diagnostics, Mannheim, Germany).
- Grip strength test
- In the grip strength test, the rat grasped a thin bar attached to a force gauge. The rat was then pulled away from the gauge until its hindlimb and forelimb released the bar. This test provided a value for the force of maximal grip strength. The force measurements were recorded in three separate trials, and the maximum strength results were used in the analyses. Grip strength was measured during the last week of the exercise period using a Grip Strength Meter (Bioseb, Vitrolles Cedex, France). Once the rat grasped the grid with all its' limbs, the rat was pulled back gently but steadily until it released its' grip. The maximum force (g) achieved by the rat before it released the grid was recorded.
- Sample collection
- Forty-eight hours after exercise training, the rat was anesthetized with 30 mg/kg Zoletil 50 (Virbac, Carros, France) and perfused transcardially with 0.1 M phosphate-buffered saline (PBS, pH 7.4). The right side of the medial gastrocnemius muscle was extracted, snap frozen in liquid nitrogen, and stored at -80℃. The rat was then perfused transcardially with 4% paraformaldehyde in 0.1 M phosphate buffer (PB, pH 7.4). The left side of the medial gastrocnemius muscle was removed, fixed in 4% paraformaldehyde in 0.1 M PB (pH 7.4) overnight, and then embedded with 30% sucrose overnight. The paraffin-embedded muscle tissue was serially cut into 4 µm thick sections using a microtome (Leica Microsystems, Wetzlar, Germany).
- Immunohistochemistry and immunofluorescence
- Tissue sections were incubated with diluted mouse anti-myosin fast skeletal antibody (MY-32, 1:2,000; Novus Biologicals, Littleton, CO, USA) or rabbit anti-GLUT4 antibody (1:1,000; Novus Biologicals) overnight at 4℃. After washing, the slides were subsequently incubated with biotinylated goat anti-mouse immunoglobulin G (1:200; Vector Lavoratories, Burlingame, CA, USA) or fluorescein isothiocyanate (FITC)-conjugated antibody (1:50; Novus Biologicals) for 1 hour at room temperature under a foil cover to prevent fluorophore fading. The Vectastain avidin-biotin complex (ABC) kit (Vector Laboratories) was used for the ABC method according to the manufacturer's instructions. Peroxidase activity was visualized with 3,3'-diaminobenzidine tetrachloride (Sigma-Aldrich Co., St. Louis, MO, USA) in 0.1 M PBS. The sections were dehydrated and mounted in Canada balsam (Kanto, Tokyo, Japan). For immunofluorescence, the sections were mounted in Vectashield antifading medium (Vector Laboratories). The images were captured using an inverted microscope (ECLIPSE E100; Nikon, Kanagawa, Japan), or the slides were viewed by fluorescence microscopy (BX50; Olympus, Milan, Italy). The images were analyzed using INFINITYlite software (Innerview 2.0; Lumenera, Ottawa, ON, Canada). Approximately 800 fibers were analyzed in each muscle cross-section.
- Western blot
- The medial gastrocnemius muscle was rapidly homogenized in 1.0 mL of extraction buffer (RIPA; Sigma-Aldrich). The extracts were then centrifuged at 12,000 rpm at 4℃ for 15 minutes to remove the insoluble materials. The concentration of protein in the supernatant was measured using a BCA protein assay kit (Pierce Biotechnology, Rockford, IL, USA). The proteins were treated with Laemmli sample buffer containing dithiothreitol and were boiled for 5 minutes. Aliquots containing similar amounts of protein (2.5 µg/µL) were loaded onto a 8% sodium dodecyl sulfate polyacrylamide gel electrophoresis (SDS-PAGE) gel in a miniature slab gel apparatus (Bio-Rad, Hercules, CA, USA) and subjected to SDS-PAGE. The proteins were transferred to a nitrocellulose membrane for 3 hours at 160 V (constant voltage) in a miniature transfer apparatus (Bio-Rad). Nonspecific antibody binding to the nitrocellulose was reduced by pre-incubation in a blocking buffer (5% skim milk in Tris buffered saline with Tween 20 [TBS-T]: 10 mmol/L Tris, 150 mmol/L NaCl, and 0.02% Tween 20) for 1 hour at 22℃. The membranes were incubated overnight at 4℃ with antibodies against GLUT4, which was diluted in 3% skim milk/TBS-T, and then washed for 30 minutes in TBS-T. The blots were subsequently incubated with a peroxidase-conjugated secondary antibody for 90 minutes at room temperature with gentle stirring and then washed for 30 minutes. The blots were incubated for 2 minutes with Amersham ECL Prime Western Blotting Detection Reagent (GE Healthcare Life Sciences, Piscataway, NJ, USA), and chemiluminescence was detected using a charge-coupled device camera (LAS-2000; Fujifilm Life Science, Düsseldorf, Germany). The signals were quantified using the Multi Gauge version 3.0 (Fuji Photo Film Co., Tokyo, Japan) and NIH ImageJ software. The protein levels were normalized to the levels of α-tubulin.
- Statistical analysis
- Values are presented as mean±standard error. Statistical comparisons between the subgroups were assessed by one-way analysis of variance (ANOVA) with Tukey's and Scheffe's post hoc test. The week-to-week changes in exercise performance were assessed with one-way ANOVA with repeated measures. A P value of less than 0.05 was considered statistically significant.
METHODS
- Changes in body weight and medial gastrocnemius muscle weight
- In the present study, the body weight of the ZDF-Con rats was higher than the ZLC-Con rats. However, the body weight of the ZDF-Ex and the ZDF-Con rats did not differ. The weight of the medial gastrocnemius muscle was not significantly different than any of the groups despite a relatively modest muscle weight gain of 10.1% in the ZDF-Ex rats. When muscle weight was divided by body weight, significant difference was observed between the ZLC-Con and the ZDF-Con rats (Table 1).
- Grip strength and exercise performance
- Muscle strength was approximately 36% lower in the ZDF-Con rats than in the ZLC-Con rats (P=0.009). Although a 30.3% increase in muscle strength was observed after 8 weeks of resistance exercise training, the change was not statistically significant (Table 2). Exercise performance progressively increased during the training period (P<0.001). At the end of training, the rats were able to lift 785 g, a weight 2.13-fold higher than their body weight (Table 3).
- Progression of diabetes
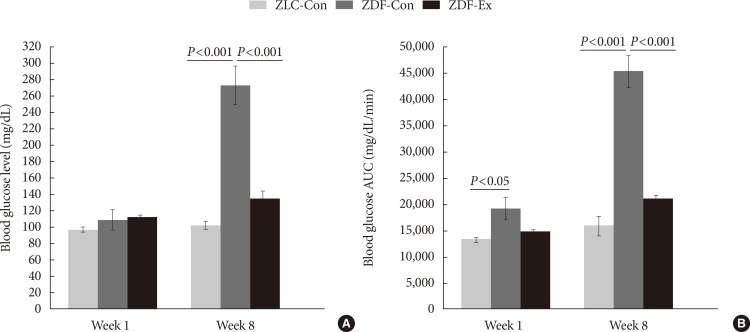
- Blood glucose levels and blood glucose area under the curve (AUC) responses were measured during the first week of exercise training, before the onset of diabetes, and during the last week of training, after the onset of diabetes (Fig. 1). Blood glucose levels in the ZLC-Con, ZDF-Con, and ZDF-Ex rats were not significantly different in the first week. However, blood glucose levels had increased significantly in the ZDF-Con rats by the end of the training period (P<0.001 vs. ZLC-Con), whereas blood glucose levels in the ZDF-Ex rats hardly changed (P<0.001 vs. ZDF-Con). The AUC responses to IPGTTs during the 1st and 8th weeks followed a similar pattern as the blood glucose levels, except that the AUC response in the ZDF-Con rats was significantly higher (P<0.05) than that in the other groups during the first week. These results indicate that resistance exercise training alleviated the progressive worsening of the rat's diabetes status.
- Effect of exercise on IPGTT
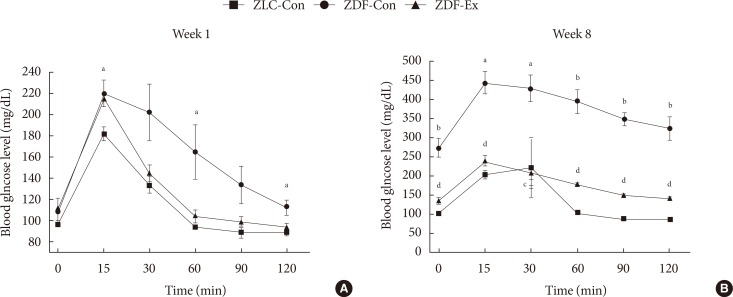
- The results of the IPGTTs in all of the groups are shown in Fig. 2. During the 1st week of exercise training, higher blood glucose levels were seen in the ZDF-Con rats compared to the ZLC-Con rats after injection (P=0.04), and the levels remained high for 120 minutes after the injection. However, there was no difference between the ZDF-Con rats and the ZDF-Ex rats (Fig. 2A). During the 8th week of exercise training, blood glucose levels remained high 120 minutes after glucose administration in the ZDF-Con rats (P<0.001). Blood glucose levels in the ZDF-Ex rats were significantly lower than the blood glucose levels in the ZDF-Con rats at each time point tested. These results suggest that 8 weeks of resistance exercise training was sufficient to control glucose intolerance in the ZDF-Ex rats.
- GLUT4 expression
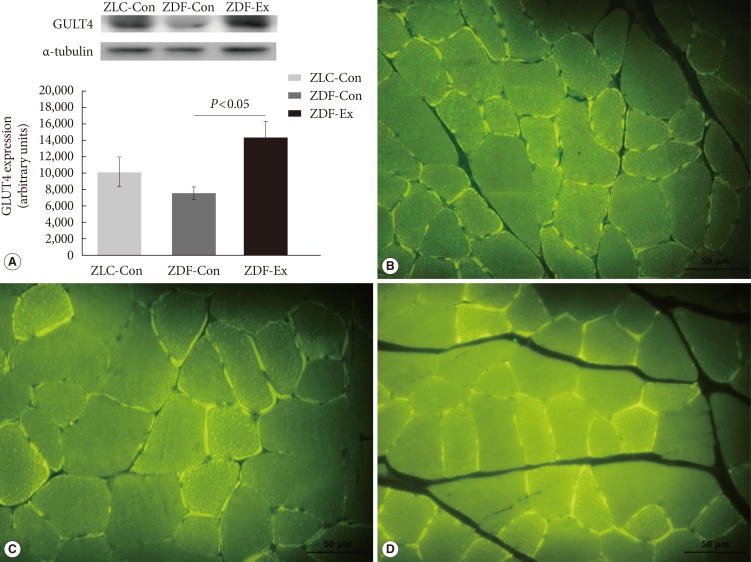
- The relative expression of GLUT4 in skeletal muscles was assessed by Western blot (Fig. 3A). In the ZDF-Con rats, a 25.6% decrease in GLUT4 density was observed (7,565.01±824.26 vs. 10,167.15±1,781.58 in ZLC-Con), but the difference was not statistically significant. Interestingly, GLUT4 protein levels increased markedly in the ZDF-Ex rats after 8 weeks of resistance exercise training (14,259.26±2,073.51, P=0.044 vs. ZDF-Con). In addition, we performed immunofluorescence to observe the expression of GLUT4 protein in a cross-sectional area of the gastrocnemius muscle. There was more intense GLUT4 staining in the ZDF-Ex rats compared to the ZLC-Con and the ZDF-Con rats (Fig. 3B-D).
- Muscle fiber type composition
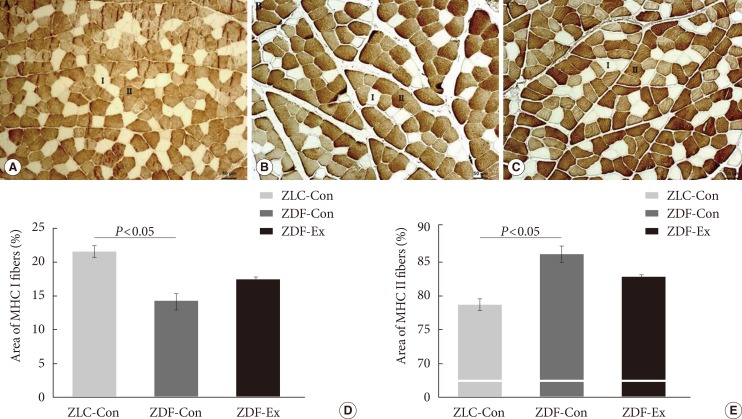
- We performed immunohistochemical staining with an MHC II (MY-32) antibody to classify the muscle fiber types and assess the composition of the medial gastrocnemius muscle (Fig. 4A-C). The percentage of MHC I fibers was significantly lower in the ZDF-Con rats than in the ZLC-Con rats, whereas the percentage of MHC II fibers was higher in the ZDF-Con rats than in the ZLC-Con rats (Fig. 4D and E). The ratio of MHC I:MHC II fibers in the ZLC-Con rats also differed from the ZDF-Con rats (0.28 in ZLC-Con rats and 0.17 in ZDF-Con rats, P=0.003) and the ZDF-Ex rats (0.21 in ZDF-Ex rats, P=0.004). However, the ratio in the ZDF-Ex rats was not significantly different from the ratio in the ZDF-Con rats (P=0.071). When the ZDF rats performed the resistance exercise, the percentage of MHC I fibers increased, while the percentage of MHC II fibers decreased. However, the results did not reach statistical significance (P=0.091).
RESULTS
- In this study, we investigated the therapeutic effects of resistance exercise training on Zucker rats before and after the onset of diabetes in order to obtain a better understanding of the importance of timing in exercise intervention. We also assessed the effects of exercise on GLUT4 expression in skeletal muscle and muscle fiber type composition. We found that progressive resistance training significantly: (1) reduced fasting blood glucose levels and AUC responses in diabetic rats and (2) increased GLUT4 levels in skeletal muscles. However, after 8 weeks of resistance training, skeletal muscle composition (fast/slow fiber) was not significantly altered.
- The animal model used in this study is a commonly used model of T2DM, in which the animals show characteristics similar to T2DM in humans [45]. The hyperglycemia observed in these animals is due to an increase in hepatic production of very low density lipoproteins. Adipocytes increase both in size and in number, and the largest increase in the number of fat cells occurs in subcutaneous fat deposits. In the present study, although we scheduled the training period as fast as the rats were capable of climbing the ladder to minimize the progression of diabetes, the results of IPGTT and AUC during the 1st week of training in the ZDF-Con rats were higher than the normal group (Fig. 1B and 2A). These observations might be due to the hyperglycemic condition of the ZDF rat model, which rapidly progresses from 4 to 12 weeks of age [5]. In addition, the ZDF rats present with insulin insufficiency between 7 and 8 weeks old, and impaired glucose disposal and hepatic glucose output suppression are considered factors that contribute to the progression of diabetes. Several studies have described the beneficial effects of exercise intervention on several diagnostic criteria of diabetes, such as fasting glucose levels, fasting insulin levels, and glycosylated hemoglobin results, in T2DM in both patients and animal models [262728]. In contrast to these studies, our study focused on the timing of the intervention with respect to the progression of T2DM in Zucker rats.
- We used a model of resistance training that comprised regular sessions of progressive ladder climbing. This model was developed to replicate exercise parameters and physiological changes in trained humans [29]. The resistance exercise stimulates various muscle groups, including the extensor digitorum longus, soleus, flexor hallucis longus, and gastrocnemius muscles. Studies have reported that the ladder climbing regimen produces a 5% to 34% increase in muscle mass, depending on the duration, frequency, and intensity of the training [30313233].
- In the present investigation, the ladder climbing exercise protocol described by Lee et al. [25] was modified to increase the exercise intensity. Despite this change, 8 weeks of training did not alter body weight and muscle weight (Table 1). It is possible that anthropometrical changes do not always accompany improvements in glucose tolerance. A previous study indicated that resistance exercise on its own improved glucose tolerance without affecting body weight or muscle weight [34]. Similarly, even though the ZDF-Ex rats were able to carry increasingly heavier weights (range, 240 to 785 g) over the course of the training period, the grip strength of the ZDF-Con and the ZDF-Ex rats did not differ (Tables 2 and 3). However, muscle strength in the ZDF-Con rats was 35.9% lower than in the ZLC-Con rats, suggesting that diabetic rats have poor glucoregulation and consequent muscle weakness (Table 2).
- In the present study, even though the resistance exercise training regimen was sufficient to improve glucose tolerance and insulin sensitivity through upregulation of GLUT4 expression (Fig. 3), it was not stringent enough to alter skeletal muscle fiber composition in the gastrocnemius of the ZDF rats (Fig. 4A-C). Histological analysis showed that the percentage of MHC I fibers increased by 28% and the percentage of MHC II fibers decreased by 8% in the ZDF-Ex rats, compared to the fiber composition in the ZDF-Con rats. However, the results did not reach statistical significance (P=0.091) (Fig. 4D and E).
- In this present study, a low sample size (n=4) and large variation may have limited our ability to obtain statistically significant results. For future studies, it would be beneficial to compare aerobic exercise training to resistance training with respect to monitoring improvements in glucose tolerance. Furthermore, additional, more detailed muscle fiber type analysis (fast/slow fiber) using different muscles (i.e., forelimb vs. hindlimb) recruited from the training would clearly elucidate the effect of resistance training on changes in fiber type composition.
- In conclusion, we demonstrated that 8 weeks of ladder climbing resistance training improved muscle glucose tolerance and insulin sensitivity in obese Zucker rats. Furthermore, GLUT4 levels in skeletal muscles increased as a result of the training. However, muscle composition was not altered. Taken together, our results indicate that three sessions per week of regular resistance training initiated at the onset of diabetes can improve glucose tolerance and GLUT4 expression without changing muscle morphology in Zucker rats. Thus, resistance training might serve as an adjunct therapy in diabetes. Our results have important practical relevance for the optimal design of exercise training programs for animal models of T2DM.
DISCUSSION
-
Acknowledgements
- This work was supported by National Research Foundation of Korea (NRF) funded by Ministry of Science, ICT and Future Planning (NRF-2013M3A9B046417, NRF-2013M3A9D5072550, and MEST 2011-0030135) and Ministry of Education (NRF-2014R1A1A2058645).
ACKNOWLEDGMENTS
-
CONFLICTS OF INTEREST: No potential conflict of interest relevant to this article was reported.
NOTES
- 1. Yoon KH, Lee JH, Kim JW, Cho JH, Choi YH, Ko SH, Zimmet P, Son HY. Epidemic obesity and type 2 diabetes in Asia. Lancet 2006;368:1681-1688. ArticlePubMed
- 2. Zimmet P, Alberti KG, Shaw J. Global and societal implications of the diabetes epidemic. Nature 2001;414:782-787. ArticlePubMedPDF
- 3. Petersen KF, Shulman GI. Pathogenesis of skeletal muscle insulin resistance in type 2 diabetes mellitus. Am J Cardiol 2002;90(5A):11G-18G.ArticlePubMed
- 4. Corsetti JP, Sparks JD, Peterson RG, Smith RL, Sparks CE. Effect of dietary fat on the development of non-insulin dependent diabetes mellitus in obese Zucker diabetic fatty male and female rats. Atherosclerosis 2000;148:231-241. ArticlePubMed
- 5. Etgen GJ, Oldham BA. Profiling of Zucker diabetic fatty rats in their progression to the overt diabetic state. Metabolism 2000;49:684-688. ArticlePubMed
- 6. Chalmers GR, Edgerton VR. Single motoneuron succinate dehydrogenase activity. J Histochem Cytochem 1989;37:1107-1114. ArticlePubMedPDF
- 7. Hirofuji C, Nakatani T, Ishihara A, Tanaka M, Itoh K, Itoh M, Katsuta S, Ibata Y. Cell size and succinate dehydrogenase activity of different types of fibers in different regions of the tibialis anterior muscle in mice and rats. Acta Histochem Cytochem 2000;33:295-303.Article
- 8. Nakatani T, Nakashima T, Kita T, Hirofuji C, Itoh K, Itoh M, Ishihara A. Cell size and oxidative enzyme activity of different types of fibers in different regions of the rat plantaris and tibialis anterior muscles. Jpn J Physiol 2000;50:413-418. ArticlePubMed
- 9. Hawley JA. Adaptations of skeletal muscle to prolonged, intense endurance training. Clin Exp Pharmacol Physiol 2002;29:218-222. ArticlePubMed
- 10. Fluck M, Hoppeler H. Molecular basis of skeletal muscle plasticity: from gene to form and function. Rev Physiol Biochem Pharmacol 2003;146:159-216. PubMed
- 11. Jarvis JC, Mokrusch T, Kwende MM, Sutherland H, Salmons S. Fast-to-slow transformation in stimulated rat muscle. Muscle Nerve 1996;19:1469-1475. ArticlePubMed
- 12. Hood DA. Invited review: contractile activity-induced mitochondrial biogenesis in skeletal muscle. J Appl Physiol (1985) 2001;90:1137-1157. ArticlePubMed
- 13. Pette D, Staron RS. Transitions of muscle fiber phenotypic profiles. Histochem Cell Biol 2001;115:359-372. ArticlePubMedPDF
- 14. Roy RR, Talmadge RJ, Fox K, Lee M, Ishihara A, Edgerton VR. Modulation of MHC isoforms in functionally overloaded and exercised rat plantaris fibers. J Appl Physiol (1985) 1997;83:280-290. ArticlePubMed
- 15. Carroll TJ, Abernethy PJ, Logan PA, Barber M, McEniery MT. Resistance training frequency: strength and myosin heavy chain responses to two and three bouts per week. Eur J Appl Physiol Occup Physiol 1998;78:270-275. ArticlePubMedPDF
- 16. Sharman MJ, Newton RU, Triplett-McBride T, McGuigan MR, McBride JM, Hakkinen A, Hakkinen K, Kraemer WJ. Changes in myosin heavy chain composition with heavy resistance training in 60- to 75-year-old men and women. Eur J Appl Physiol 2001;84:127-132. ArticlePubMedPDF
- 17. Adams GR, Hather BM, Baldwin KM, Dudley GA. Skeletal muscle myosin heavy chain composition and resistance training. J Appl Physiol (1985) 1993;74:911-915. ArticlePubMed
- 18. Andersen JL, Aagaard P. Myosin heavy chain IIX overshoot in human skeletal muscle. Muscle Nerve 2000;23:1095-1104. ArticlePubMed
- 19. Charette SL, McEvoy L, Pyka G, Snow-Harter C, Guido D, Wiswell RA, Marcus R. Muscle hypertrophy response to resistance training in older women. J Appl Physiol (1985) 1991;70:1912-1916. ArticlePubMed
- 20. Houmard JA, O'Neill DS, Zheng D, Hickey MS, Dohm GL. Impact of hyperinsulinemia on myosin heavy chain gene regulation. J Appl Physiol (1985) 1999;86:1828-1832. ArticlePubMed
- 21. Gaster M, Staehr P, Beck-Nielsen H, Schroder HD, Handberg A. GLUT4 is reduced in slow muscle fibers of type 2 diabetic patients: is insulin resistance in type 2 diabetes a slow, type 1 fiber disease? Diabetes 2001;50:1324-1329. PubMed
- 22. Henriksen EJ, Bourey RE, Rodnick KJ, Koranyi L, Permutt MA, Holloszy JO. Glucose transporter protein content and glucose transport capacity in rat skeletal muscles. Am J Physiol 1990;259(4 Pt 1):E593-E598. ArticlePubMed
- 23. Song XM, Ryder JW, Kawano Y, Chibalin AV, Krook A, Zierath JR. Muscle fiber type specificity in insulin signal transduction. Am J Physiol 1999;277(6 Pt 2):R1690-R1696. ArticlePubMed
- 24. Daugaard JR, Nielsen JN, Kristiansen S, Andersen JL, Hargreaves M, Richter EA. Fiber type-specific expression of GLUT4 in human skeletal muscle: influence of exercise training. Diabetes 2000;49:1092-1095. ArticlePubMedPDF
- 25. Lee S, Barton ER, Sweeney HL, Farrar RP. Viral expression of insulin-like growth factor-I enhances muscle hypertrophy in resistance-trained rats. J Appl Physiol (1985) 2004;96:1097-1104. ArticlePubMed
- 26. Leonard BL, Watson RN, Loomes KM, Phillips AR, Cooper GJ. Insulin resistance in the Zucker diabetic fatty rat: a metabolic characterisation of obese and lean phenotypes. Acta Diabetol 2005;42:162-170. ArticlePubMedPDF
- 27. Bacchi E, Negri C, Zanolin ME, Milanese C, Faccioli N, Trombetta M, Zoppini G, Cevese A, Bonadonna RC, Schena F, Bonora E, Lanza M, Moghetti P. Metabolic effects of aerobic training and resistance training in type 2 diabetic subjects: a randomized controlled trial (the RAED2 study). Diabetes Care 2012;35:676-682. PubMedPMC
- 28. Roden M. Exercise in type 2 diabetes: to resist or to endure? Diabetologia 2012;55:1235-1239. ArticlePubMedPMC
- 29. Hornberger TA Jr, Farrar RP. Physiological hypertrophy of the FHL muscle following 8 weeks of progressive resistance exercise in the rat. Can J Appl Physiol 2004;29:16-31. ArticlePubMed
- 30. Duncan ND, Williams DA, Lynch GS. Adaptations in rat skeletal muscle following long-term resistance exercise training. Eur J Appl Physiol Occup Physiol 1998;77:372-378. ArticlePubMedPDF
- 31. Ho KW, Roy RR, Tweedle CD, Heusner WW, Van Huss WD, Carrow RE. Skeletal muscle fiber splitting with weight-lifting exercise in rats. Am J Anat 1980;157:433-440. ArticlePubMed
- 32. Klitgaard H. A model for quantitative strength training of hindlimb muscles of the rat. J Appl Physiol (1985) 1988;64:1740-1745. ArticlePubMed
- 33. Hall KE, McDonald MW, Grise KN, Campos OA, Noble EG, Melling CW. The role of resistance and aerobic exercise training on insulin sensitivity measures in STZ-induced type 1 diabetic rodents. Metabolism 2013;62:1485-1494. ArticlePubMed
- 34. Ibanez J, Izquierdo M, Arguelles I, Forga L, Larrion JL, Garcia-Unciti M, Idoate F, Gorostiaga EM. Twice-weekly progressive resistance training decreases abdominal fat and improves insulin sensitivity in older men with type 2 diabetes. Diabetes Care 2005;28:662-667. ArticlePubMedPDF
REFERENCES
Fasting blood glucose levels (A) and blood glucose area under the curve (AUC) responses to intraperitoneal glucose tolerance tests (B) during the first and last weeks of exercise training; Zucker lean control (ZLC-Con), non-exercised Zucker diabetic fatty (ZDF-Con), and exercised Zucker diabetic fatty (ZDF-Ex). Values are presented as mean±standard error of mean.

Changes in blood glucose levels during the (A) first and (B) last weeks of exercise training in the Zucker lean control (ZLC-Con), non-exercised Zucker diabetic fatty (ZDF-Con), and exercised Zucker diabetic fatty (ZDF-Ex) rats at 0 (baseline), 15, 30, 60, 90, and 120 minutes after glucose administration (2 g/kg). Values are presented as mean±standard error of mean. aP<0.05 vs. ZLC-Con, bP<0.001 vs. ZLC-Con, cP<0.05 vs. ZDF-Con, dP<0.001 vs. ZDF-Con.

(A) Glucose transporter 4 (GLUT4) protein levels assessed by Western blot and immunofluorescence assay in the skeletal muscle of the (B) Zucker lean control (ZLC-Con), (C) non-exercised Zucker diabetic fatty (ZDF-Con), and (D) exercised Zucker diabetic fatty (ZDF-Ex) rats. Paraffin sections were incubated with GLUT4 antibody (1:1,000) and then with a fluorescein isothiocyanate-conjugated secondary antibody (1:50). Values are presented as mean±standard error of mean (immunofluorescence assay, ×400; scale bar=50 µm).
Immunohistochemistry was performed on the medial gastrocnemius muscle from the (A) Zucker lean control (ZLC-Con), (B) non-exercised Zucker diabetic fatty (ZDF-Con), and (C) exercised Zucker diabetic fatty (ZDF-Ex) rats. Paraffin sections of the muscle were immunostained with fast myosin heavy chain (MHC II) antibody (1:2,000 dilution). MHC I fibers were calculated from the unstained areas, and MHC II fibers were calculated from the stained areas, which appear dark (×100, scale bar=50 µm). The percentage of (D) MHC I-positive and (E) MHC II-positive areas were calculated using Innerview 2.0 software (Lumenera). Values are presented as mean±standard error of mean.
Body weight and gastrocnemius muscle characteristics
Grip-strength test
Changes in weekly exercise performance
Figure & Data
References
Citations
- Aerobic and resistance exercises affect the BDNF/TrkB signaling pathway, and hippocampal neuron density of high-fat diet-induced obese elderly rats.
Keshvari Maryam, Heidarianpour Ali
Physiology & Behavior.2023; 264: 114140. CrossRef - Nutritive/non-nutritive sweeteners and high fat diet contribute to dysregulation of sweet taste receptors and metabolic derangements in oral, intestinal and central nervous tissues
Yiyuan Zhang, Lu Chen, Jiefang Gao, Yahong Cheng, Fei Luo, Xinying Bai, Hong Ding
European Journal of Nutrition.2023; 62(8): 3149. CrossRef - Anti-osteoporosis mechanism of resistance exercise in ovariectomized rats based on transcriptome analysis: a pilot study
Qing Wang, Heng Weng, Yue Xu, Hui Ye, Yongqi Liang, Lulu Wang, Yutong Zhang, Yujie Gao, Jiayi Wang, Yuchen Xu, Zhiling Sun, Guihua Xu
Frontiers in Endocrinology.2023;[Epub] CrossRef - The effects of resistance exercise training followed by de-training on irisin and some metabolic parameters in type 2 diabetic rat model
Hassan Tavassoli, Ali Heidarianpour, Mehdi Hedayati
Archives of Physiology and Biochemistry.2022; 128(1): 240. CrossRef - Effect of a single bout of resistance exercise on zinc-α2-glycoprotein
Michihiro Kon, Yasuhiro Suzuki
Archives of Physiology and Biochemistry.2022; 128(1): 248. CrossRef - Decreased muscle‐derived musclin by chronic resistance exercise is associated with improved insulin resistance in rats with type 2 diabetes
Mio Shimomura, Naoki Horii, Shumpei Fujie, Kenichiro Inoue, Natsuki Hasegawa, Keiko Iemitsu, Masataka Uchida, Motoyuki Iemitsu
Physiological Reports.2021;[Epub] CrossRef - Associations Between Betatrophin with Irisin and Metabolic Factors: Effects of Two Exercise Trainings in Diabetic Rats
Hassan Tavassoli, Ali Heidarianpour
The American Journal of the Medical Sciences.2021; 362(5): 496. CrossRef - Resistance exercise affects catheter-related thrombosis in rats through miR-92a-3p, oxidative stress and the MAPK/NF-κB pathway
Cui Wen, Yanping Ying, Huihan Zhao, Qingjuan Jiang, Xiao Gan, Yan Wei, Jiani Wei, Xinxin Huang
BMC Cardiovascular Disorders.2021;[Epub] CrossRef - The hypoglycemic mechanism of catalpol involves increased AMPK-mediated mitochondrial biogenesis
Deng-qiu Xu, Chun-jie Li, Zhen-zhou Jiang, Lu Wang, Hong-fei Huang, Zhi-jian Li, Li-xin Sun, Si-si Fan, Lu-yong Zhang, Tao Wang
Acta Pharmacologica Sinica.2020; 41(6): 791. CrossRef - Long‐term insulin treatment leads to a change in myosin heavy chain fiber distribution in OLETF rat skeletal muscle
Oak‐Kee Hong, Yoon‐Hee Choi, Hyuk‐Sang Kwon, Hee‐Kyoung Jeong, Jang‐Won Son, Seong‐Su Lee, Sung‐Rae Kim, Kun‐Ho Yoon, Soon Jib Yoo
Journal of Cellular Biochemistry.2019; 120(2): 2404. CrossRef - Mitochondrial dysfunction and inhibition of myoblast differentiation in mice with high‐fat‐diet‐induced pre‐diabetes
Dengqiu Xu, Zhenzhou Jiang, Zeren Sun, Lu Wang, Guolin Zhao, Hozeifa M. Hassan, Sisi Fan, Wang Zhou, Shuangshuang Han, Luyong Zhang, Tao Wang
Journal of Cellular Physiology.2019; 234(5): 7510. CrossRef - Regulation of Skeletal Muscle Glucose Transport and Glucose Metabolism by Exercise Training
Parker L. Evans, Shawna L. McMillin, Luke A. Weyrauch, Carol A. Witczak
Nutrients.2019; 11(10): 2432. CrossRef - Relationship Between Grip Strength and Prediabetes in a Large-Scale Adult Population
Shan Hu, Yeqing Gu, Zuolin Lu, Qing Zhang, Li Liu, Ge Meng, Zhanxin Yao, Hongmei Wu, Xue Bao, Vu Thi Quynh Chi, Shunming Zhang, Mingyue Liu, Yanyan Wang, Liu Wang, Lixiao Zheng, Xiaona Wang, Chunling Tian, Jingzhu Fu, Shaomei Sun, Ming Zhou, Qiyu Jia, Kun
American Journal of Preventive Medicine.2019; 56(6): 844. CrossRef - Resistance exercise improves cardiac function and mitochondrial efficiency in diabetic rat hearts
Tae Hee Ko, Jubert C. Marquez, Hyoung Kyu Kim, Seung Hun Jeong, SungRyul Lee, Jae Boum Youm, In Sung Song, Dae Yun Seo, Hye Jin Kim, Du Nam Won, Kyoung Im Cho, Mun Gi Choi, Byoung Doo Rhee, Kyung Soo Ko, Nari Kim, Jong Chul Won, Jin Han
Pflügers Archiv - European Journal of Physiology.2018; 470(2): 263. CrossRef - Effects of Resistance Exercise Training on Leptin Receptor (Ob-R), GLUT2 mRNA of the Hypothalamus and GLUT4 mRNA Expression of the Skeletal Muscle in OLETF Rats
Eun-Mi Lim, Se-Hwan Park, Jin-Hwan Yoon
Exercise Science.2018; 27(4): 303. CrossRef - Association of sericin and swimming on the phenotype, motor plate, and functionality of the denervated plantar muscle of Wistar rats
André Junior Santana, Jean Carlos Debastiani, Regina Inês Kunz, Pamela Buratti, Rose Meire Costa Brancalhão, Lucinéia de Fátima Chasko Ribeiro, Márcia Miranda Torrejais, Gladson Ricardo Flor Bertolini
Journal of Exercise Rehabilitation.2018; 14(1): 24. CrossRef - Effects of Treadmill Exercise on Muscle Transcription Factors and TGF-β1 Expression in Aged Rats
Yeon-Hee Kim, Jin-Hwan Yoon, You-Mi Kim
The Korean Journal of Physical Education.2017; 56(1): 683. CrossRef - GLUT4 Is Not Necessary for Overload-Induced Glucose Uptake or Hypertrophic Growth in Mouse Skeletal Muscle
Shawna L. McMillin, Denise L. Schmidt, Barbara B. Kahn, Carol A. Witczak
Diabetes.2017; 66(6): 1491. CrossRef - Effects of leucine supplementation and resistance training on myopathy of diabetic rats
Carlos Eduardo C. Martins, Vanessa B. de S. Lima, Brad J. Schoenfeld, Julio Tirapegui
Physiological Reports.2017; 5(10): e13273. CrossRef - Autophagy activation, not peroxisome proliferator‐activated receptor γ coactivator 1α, may mediate exercise‐induced improvements in glucose handling during diet‐induced obesity
Megan E. Rosa‐Caldwell, Jacob L. Brown, David E. Lee, Thomas A. Blackwell, Kyle W. Turner, Lemuel A. Brown, Richard A. Perry, Wesley S. Haynie, Tyrone A. Washington, Nicholas P. Greene
Experimental Physiology.2017; 102(9): 1194. CrossRef - α-Motoneurons maintain biophysical heterogeneity in obesity and diabetes in Zucker rats
Christopher W. MacDonell, Jeremy W. Chopek, Kalan R. Gardiner, Phillip F. Gardiner
Journal of Neurophysiology.2017; 118(4): 2318. CrossRef - Relationships among muscle fiber type composition, fiber diameter and MRF gene expression in different skeletal muscles of naturally grazing Wuzhumuqin sheep during postnatal development
Qimuge Siqin, Tadayuki Nishiumi, Takahisa Yamada, Shuiqing Wang, Wenjun Liu, Rihan Wu, Gerelt Borjigin
Animal Science Journal.2017; 88(12): 2033. CrossRef - Evaluation of treadmill exercise effect on muscular lipid profiles of diabetic fatty rats by nanoflow liquid chromatography–tandem mass spectrometry
Jong Cheol Lee, Il Yong Kim, Yeri Son, Seul Kee Byeon, Dong Hyun Yoon, Jun Seok Son, Han Sol Song, Wook Song, Je Kyung Seong, Myeong Hee Moon
Scientific Reports.2016;[Epub] CrossRef - Increased Muscular 5α-Dihydrotestosterone in Response to Resistance Training Relates to Skeletal Muscle Mass and Glucose Metabolism in Type 2 Diabetic Rats
Naoki Horii, Koji Sato, Noboru Mesaki, Motoyuki Iemitsu, Marcia B. Aguila
PLOS ONE.2016; 11(11): e0165689. CrossRef
 PubReader
 Cite
Cite