
- Current
- Browse
- Collections
-
For contributors
- For Authors
- Instructions to authors
- Article processing charge
- e-submission
- For Reviewers
- Instructions for reviewers
- How to become a reviewer
- Best reviewers
- For Readers
- Readership
- Subscription
- Permission guidelines
- About
- Editorial policy
Articles
- Page Path
- HOME > Diabetes Metab J > Volume 39(1); 2015 > Article
-
ReviewEpidemiology The Optimal Cutoff Value of Glycated Hemoglobin for Detection of Diabetic Retinopathy
- Jung Min Kim1, Dong-Jun Kim2
-
Diabetes & Metabolism Journal 2015;39(1):16-26.
DOI: https://doi.org/10.4093/dmj.2015.39.1.16
Published online: February 16, 2015
1Department of Internal Medicine, Cardiovascular and Metabolic Disease Center, Inje University Sanggye Paik Hospital, Inje University College of Medicine, Seoul, Korea.
2Department of Internal Medicine, Inje University Ilsan Paik Hospital, Inje University College of Medicine, Goyang, Korea.
- Corresponding author: Dong-Jun Kim. Department of Internal Medicine, Inje University Ilsan Paik Hospital, Inje University College of Medicine, 170 Juhwa-ro, Ilsanseo-gu, Goyang 411-706, Korea. djkim@paik.ac.kr
Copyright © 2015 Korean Diabetes Association
This is an Open Access article distributed under the terms of the Creative Commons Attribution Non-Commercial License (http://creativecommons.org/licenses/by-nc/3.0/) which permits unrestricted non-commercial use, distribution, and reproduction in any medium, provided the original work is properly cited.
ABSTRACT
- With standardization of measurement of glycated hemoglobin (A1C), the International Expert Committee Report in 2009 and the American Diabetes Association in 2010 recommended incorporating A1C ≥6.5% into the previous diagnostic criteria using fasting plasma glucose and/or 2-hour plasma glucose. Whereas the association of A1C with cardiovascular diseases and other diabetic microvascular complications was linear without evidence of a distinct threshold, several studies suggested a threshold value for A1C in diabetic retinopathy (DR). In studies about the optimal cutoff value for A1C in DR, the A1C values range from 5.2% to 7.8%. There are several possible reasons why these values for DR differ so widely (differences in the definition and/or methods for DR, variation in statistical methods, differences in study population, differences in exclusion criteria, and difference in methods for measuring A1C). With these wide variations in the study method, drawing a conclusive cutoff value for A1C in DR is impossible. In published studies, the cutoff values for moderate or severe DR were higher than those for any or mild DR (6.4% to 7.0% vs. 5.5% to 6.5%).
- Type 2 diabetes mellitus (T2DM) is the most common endocrine disease. It is a complex disease characterized by hyperglycemia and is associated with long-term diabetic complications, such as diabetic retinopathy (DR), nephropathy, and neuropathy. The diagnosis of T2DM has been based on fasting plasma glucose (FPG) levels or 2-hour plasma glucose levels after an oral glucose tolerance test (OGTT) [1]. Recently, glycated hemoglobin (HbA1c, A1C) ≥6.5% was recommended for the diagnosis of T2DM by a leading diabetes organization [2,3] and the World Health Organization [4]. The most important reason to define T2DM is to identify persons with a high risk for diabetes complications. The association between A1C and cardiovascular diseases has been found in a glucose range usually considered to be nondiabetic [5,6], and there might be no threshold or a threshold below the prediabetic range [7]. For other diabetic microvascular complications except for DR, the association with A1C was linear without evidence of a distinct threshold [8]. In this paper, we will first review the history of A1C measurement and then review the studies for determining the optimal cutoff value for A1C in the presence of DR.
INTRODUCTION
- The heterogeneity of human hemoglobin (Hb) was demonstrated for the first time in 1958 using cation exchange chromatography [9]. The unexpected elution of Hb peaks (HbA1) before the major HbA fraction (HbA0) was found, and these peaks were designated as HbA1a to HbA1e based on the chromatographic elution order [10]. The HbA1 fraction results from the binding of various adducts to HbA. In 1962, Huisman and Dozy [11] reported an increase in the HbA1 fraction in red blood cells from patients with DM. In 1968, Rahbar [12] had shown an elevated percentage of A1C compared to total Hb in patients with DM. In the late 1970s, sugars or sugar phosphates were found to form HbA1, which is incidentally A1C [13]. Glucose was identified to generate A1C, which was shown to be an Amadori product formed by the irreversible binding of glucose to the β-N-terminal valine residues of globin changes [14] during the 120-day lifespan of the erythrocytes [15]. The close relationship between A1C values and glucose control resulted in the periodic monitoring of A1C for glycemic control [16,17]. The epidemiologic studies of the Diabetes Control and Complications Trial [18] and the United Kingdom Prospective Diabetes Study [19] demonstrated a link between A1C and chronic diabetic complications.
- There have been various methods based on different principles (i.e., ion-exchange chromatography, affinity chromatography, electrophoresis, colorimetric assay, and immunoassay) and methodologies (i.e., micro- and minicolumn chromatography, low-pressure liquid chromatography, high-pressure liquid chromatography, manual assays, and automated assays) without standardized procedures [20]. In the United States, the National Glycohemoglobin Standardization Program (NGSP) formed an efficient network of laboratories, monitored by a committee [21], but the reference system supporting the NSGP standardization was not appropriate to support the long-term international standardization of the assay [22]. Therefore, the International Federation of Clinical Chemistry and Laboratory Medicine-Working Group (IFCC-WG) proposed a reference, which was used to establish an internally approved IFCC reference method for A1C [23]. The IFCC recommended changing the A1C units from a percentage of A1C to total Hb ("NGSP units") to a molar ratio of A1C to HbA0 in mmol/mol (SI units, of "IFCC units") [24].
HISTORY OF A1C MEASUREMENT
- Ideally, the optimal cutoff value of A1C to diagnose diabetes is determined in a way that individuals with A1C levels above the cutoff value have a much larger probability of having or developing a diabetic complication, and individuals with A1C levels below the cutoff value have a much lower probability of having or getting diabetic complications. Three cross-sectional epidemiological studies that included Pima Indians [25], an Egyptian population [26], and the third National Health and Nutrition Examination Survey (NHANES) population in the United States [27] showed glycemic levels below which there was a low prevalence of DR and above which the prevalence of DR increased in an apparently linear fashion. The prevalence of DR rose abruptly in the highest decile of each variable, corresponding to FPG ≥120 mg/dL, 2-hour plasma glucose ≥195 mg/dL, and A1C ≥6.2% [25,26]. With standardization of measurement for A1C, the International Expert Committee Report (IECP) in 2009 [2], the American Diabetes Association in 2010 [3], and the WHO in 2011 [4] recommended incorporating A1C ≥6.5% into the previous diagnostic criteria formed by FPG and/or 2-hour plasma glucose. There have been several studies about the optimal cutoff value for A1C in DR. While most of them are cross-sectional studies [8,25,26,27,28,29,30,31,32,33,34,35,36,37,38,39], only few of them are longitudinal studies (Table 1) [25,38,40,41]. The results for each study are described below in chronological order.
- Cross-sectional studies
- In 1994, a Pima Indian study showed a threshold value of A1C between the 80th (6.5%) and 90th percentiles (7.5%), below which DR is absent or rare and above which the prevalence is considerably higher, with 960 Pima Indians not taking antihyperglycemic agents or insulin [25]. This study also demonstrated that the optimal cutoff value of A1C was 7.0%, which produced the highest sum of sensitivity (78.1%) and specificity (84.7%) using a point-wise area under the receiver operating characteristic curve (ROC). In this study, a direct ophthalmoscopic examination through a dilated pupil was performed by a physician. In 1997, an Egyptian study found that the optimal cutoff of HbA1c was approximately 6.9% (n=1,018) [26]. After excluding subjects taking antihyperglycemic medication, the optimal cutoff of HbA1c was approximately 7.5%. In this study, only one retinal photograph was taken per eye. In 1997, the Expert Committee on the Diagnosis and Classification of Diabetes Mellitus in the United States reported that an A1C of 6.2% was the optimal cutoff for predicting DR in the analysis of the third NHANES population (n=2,821) [27]. In this study, only one retinal photograph was taken per eye.
- In 2004, the Hisayama study [36] showed that the prevalence of DR dramatically increased in the tenth decile of A1C (5.5% to 5.7%), and the optimal cutoff level for DR was 5.7% for A1C by ROC analysis (86.5% sensitivity, 90.1% specificity) in a Japanese population (n=1,637). In this study, fundus photographs (45°) were taken, and DR was defined as the presence of any mild nonproliferative DR or more severe DR.
- In 2006, the Australian Diabetes Obesity and Lifestyle (AusDiab) study, conducted in 1999 to 2000, included subjects ≥25 years of age (n=2,182; 34.5% diabetes, 46.6% impaired glucose tolerance or impaired fasting glucose) and found that above the top 2 deciles of A1C, the prevalence of DR rose markedly and the threshold for increasing the prevalence of DR was 6.1% [32]. In this study, using different analysis methods and/or adjustments, the threshold was changed. Using the change-point model, the threshold was 5.2%. After adjusting for age, sex, and blood pressure, the threshold was changed to 5.6%. After further adjusting for diabetes duration, the threshold was changed to 6.0%. In this study, retinal photographs were taken with a nonmydriatic retinal camera. The level of DR was defined according to a simplified version of the Wisconsin grading system [42]. DR was defined as the presence of at least one definite retinal hemorrhage and or microaneurysm.
- In 2009, a Singapore study of 3,190 Malay adults aged 40 to 80 years showed that the optimal cutoff values for mild DR (Early Treatment Diabetic Retinopathy Study [ETDRS] >20) and moderate DR (ETDRS >43) were 6.6% (87.0% sensitivity, 77.1% specificity) and 7.0% (82.9% sensitivity, 82.3% specificity), respectively. The prevalences of mild and moderate DR were <1% below the optimal cutoff values. In this study, after pupil dilatation, two photographs were taken of both eyes of each participant using a digital retinal camera [8].
- In 2009, a report including 1,066 individuals aged ≥40 years from the 2005 to 2006 NHANES showed that the steepest increase in DR prevalence occurred among individuals with an A1C ≥5.5%, using Joint point regression analysis [29]. In this study, two 45° nonmydriatic color digital images of the retina were taken of each eye. DR was defined as a level ≥14 on the ETDRS severity scale [43].
- In 2011, the Atherosclerosis Risk in Communities (ARIC) study did not find a threshold value for A1C in DR in middle-aged Americans without diabetes using a cubic spline model. The study showed that in the absence of diagnosed diabetes, A1C was cross-sectionally associated with the presence of moderate/severe DR (ETDRS ≥35), with adjusted odds ratios of 1.42 (0.69 to 2.92) and 2.91 (1.19 to 7.11) for A1C 5.7% to <6.5% and ≥6.5%, respectively, compared to <5.7% (P trend=0.011). In this study, the relationship between A1C and DR was different according to the presence of diabetes, and there was a strong association with mild DR (ETDRS 14 to 20) in patients with diabetes and weak or no association with mild DR in patients without diabetes [31].
- In 2011, the DETECT-2 collaboration study [30], using a data-pooling analysis of nine studies from five countries with 44,623 participants aged 20 to 79 years with gradable retinal photographs, showed that the diabetes-specific retinopathy prevalence (moderate/severe DR, ETDRS 40 to 47/50 to 53) was low for A1C <6.0% but increased above this level. Based on vigintile (20 groups with equal numbers) distributions, the A1C threshold for diabetes-specific retinopathy was observed over the range of 6.3% to 6.7%. The threshold for diabetes-specific retinopathy based on ROC analysis was 6.4% for A1C.
- In 2012, a cross-sectional population-based study of 2,551 Chinese (representing a population of 1,660,500 in a Beijing district) between 19 to 79 years of age showed that the prevalence of DR increased in the ninth decile of A1C, corresponding to an A1C of ≥6.4% (85.1% sensitivity, 82.1% specificity) according to the Joint point regression method [39]. After excluding individuals receiving antihyperglycemic medication, the threshold increased up to 6.7% of A1C (60.7% sensitivity, 91.6% specificity). The cutoff points for A1C by maximizing the sensitivity and specificity were higher than by Joint point regression (6.8% of A1C, 85.1% sensitivity, 88.0% specificity in the total population; 6.9% of A1C, 60.7% sensitivity, 93.6% specificity in the subpopulation not receiving antihyperglycemic medications). In this study, two 45° color digital images of the retina were taken of each eye, and DR was defined as the presence of any mild nonproliferative DR or more severe DR.
- In 2013, a Korean cross-sectional study including 3,403 adults from the Ansung Cohort Study showed that the optimal A1C cutoff for detecting any DR was 6.6% (76.2% sensitivity, 84.2% specificity) and was 6.9% for moderate or severe retinopathy (77.1% sensitivity, 88.7% specificity) in the ROC analysis [34]. In this study, DR was assessed with single-field 45 nonmydriatic fundus photography of each eye using a digital fundus camera and classified by the International Clinical Diabetic Retinopathy Disease Severity Scale.
- In 2014, a report using data from the Korea National Health and Nutrition Examination Survey 2001 including 5,212 adults showed that the optimal A1C cutoff for detecting any DR was 6.2% (93.9% sensitivity, 89.7% specificity). In this study, retinal photographs were taken using a digital nonmydriatic fundus camera, and for each participant, one 45° retinal image was taken per eye (two images per person in total) [44].
- Longitudinal studies
- In 2003, the Hoorn study [41] investigated the effect of cardiovascular risk factors including A1C on the incidence of DR in 233 individuals aged 50 to 74 years who were not taking oral hyperglycemic agents or insulin, with an average follow-up of 9.4 years. The adjusted odds ratios for retinopathy were 2.36 for hypertension, 3.29 for the highest tertiles for A1C, and 8.67 for the highest tertiles for waist-hip ratio. The results showed no threshold for retinopathy using calculated odds ratios for DR by logistic regression.
- In 2011, the French DESIR study, which included 700 participants who were evaluated for DR using a nonmydriatic digital camera (three images per eye), reported that over the preceding 9 years, 235 had diabetes, 227 had an impaired fasting glucose at least once, and 238 always had normal glucose levels. Additionally, the study showed that the positive predictive values for retinopathy increased sharply from 6.0% for A1C [40].
- In 2012, an analysis of longitudinal data for 19,897 Japanese adults who underwent a health checkup and were followed up 3 years later showed a possible threshold for the risk of incident DR at A1C levels of 6.0% to 7.0% using the restricted cubic spline model, but there was no threshold in the analysis of prevalent retinopathy [38]. In this study, one digital photograph was taken per eye (total of two images per participant) through a nonpharmacologically dilated pupil.
- Possible reasons for discrepancy among study results
- In studies about the optimal cutoff value for A1C in DR in Western people, the A1C values ranged from 5.2% to 7.8% [25,26,27,28,29,30,31,32,33,40,41], and in Asian people, the range was 5.5% to 7.2% [8,34,35,36,37,38,39]. There are several possible reasons why the optimal cutoff value of A1C for DR differs so widely in the studies thus far.
- In most of the studies, the method for eye examination was a retinal photograph centered on the macular and optic nerve for each eye or one eye with or without pupil dilatation. Three earlier studies using direct opthalmoscopic examination or a retinal photograph of one field per eye (the Pima Indian study [25], the Egyptian study [26], and NHANES III [27]) reported that DR is uncommon within a normal FPG range. Additionally, in these earlier studies, there was a strong association of hyperglycemia with DR, and a sharp threshold of A1C was observed (7.0% in the Pima Indian study, 6.9% in the Egyptian study, and 6.2% in the NHANES III). A report of the 2005 to 2006 NHANES showed that the steepest increase in DR prevalence occurred among individuals with an A1C ≥5.5%, which was lower than that observed in some previous studies [29]. The authors suggested that one of the reasons could be that in their study, DR was assessed by two retinal photographs for each eye. Pooled analyses including three cross-sectional populations (the Blue Mountain Eye Study [45], the AusDiab study [32], and the Multi-Ethnic Study of Atherosclerosis [46]), using retinal photographs of multiple fields, reported inconsistent evidence for a uniform FPG threshold for prevalent and incident retinopathy, with analyses suggesting a continuous relationship [47]. Using retinal photographs of multiple fields in this pooled analysis, the authors reported that DR occurs in 7% to 13% of the population below the normal FPG range, that the association between FPG and DR was much weaker as indicated by ROC and that no sharp threshold could be observed anymore. These findings suggested that the sensitivity of the technique for DR could be one of the determinants for the optimal cutoff value for A1C in DR.
- The optimal cutoff value for A1C in DR may also depend on the definition of DR; a study defined DR as the presence of at least one microaneurysm or hemorrhage [25], and other studies defined retinopathy using the modified Airlie House classification system, as used in the ETDRS [26,28,29,30,31,33,36,44]. However, although using the same ETDRS level, the definition for DR was different (ETDRS level ≥14 [29,31] or ≥15 [8]). While some studies investigated any retinopathy [25,26,29,31,32,33,36,37,39,40,41,44], some studies investigated moderate or more severe DR [28,30,38,48]. A Korean study and a Singapore study showed that the threshold for A1C was different according to the definition of DR; the threshold for A1C for any or mild retinopathy was lower than that for moderate retinopathy (6.5% for any DR, and 6.9% for moderate or more severe DR in a Korean study; 6.6% for mild DR, and 7.0% for moderate or more severe DR in a Singapore study) [8,34]. In studies between 2000 and 2014, the optimal cutoff value for any DR was 5.7% in the Hisayama Study [36], 6.1% in the AusDiab Study [32], 5.5% in the NHANES 2005 to 2006 [29], 6.4% in a Chinese study [39], and 6.2% in the Korean NHANES [44], and for moderate or more severe DR, it was 6.4% in the DETECT-2 study [30].
- There are several statistical methods to determine the optimal cutoff value for A1C in DR, including visual inspection, change-point model, regression model (logistic, and Joint point), restricted cubic spline analysis, and ROC analysis. The cutoff value for A1C varied even for the same data when different methods were applied [25,30,32,36]. To give an example, in the AusDiab study, the cutoff was 6.1% by visual inspection. When change-point models were used, the cutoff value was 5.2% [32]. Considering the Hoorn study showed that not only A1C but also hypertension and abdominal obesity were determinants for DR [41], and the cutoff value of A1C for DR could be dependent of any adjustment of factors that may affect the development of DR. In the AusDiab study, without adjustment, a cutoff value of 5.2% was calculated with change-point model analysis; with adjustment for age, sex, and blood pressure, the cutoff value was 5.6%, and after further adjustment for diabetes duration, the cutoff was 6.0%. Mainly from the DETECT-2 findings, the International Expert Committee recommended a cutoff of 6.5% for an A1C-based diagnosis of diabetes [2]. In the DETECT-2 study, the largest cross-sectional analysis of nine studies from five countries with 44,623 multiethnic participants aged 20 to 79 years in an unadjusted analysis was conducted [30].
- Other reasons for variability in the optimal cutoff points could be the different clinical characteristics of each study population (ethnicities, age, and nonglycemic factors for determining A1C). A1C distribution could be different according to age and sex distribution of the population.
- A1C levels appear to increase with age [49,50,51,52,53]. In analyses of the Framingham Offspring and participants of the NHANES 2001 to 2004, Pani et al. [49] tried to investigate the effect of age on the A1C level and found a 0.10% to 0.14% A1C increase with each decade increase in age. In this study, people 70 years of age without DM appeared to have higher A1C values of approximately 0.4% compared to those 40 years of age [49].
- There was a report suggesting that an A1C-based diagnosis of diabetes has a different impact on prevalence in different ethnic groups [54]. In this study, while 91% of white participants with an A1C ≥6.5% had diabetes by the 2-hour plasma glucose criterion after an OGTT, only 61% of South Asian participants and 50% of black participants with an A1C ≥6.5% had diabetes by the 2-hour plasma glucose criterion after an OGTT. The Diabetes Prevention Program study showed a difference in A1C by race and ethnicity among patients with impaired glucose tolerance, and in this study, the A1C values for Afro-Caribbeans were approximately 0.4% higher than white Europeans with apparently the same glucose tolerance [55]. Another study showed a similar difference between South Asians and White Europeans [56].
- Several nonglycemic factors may affect the results of A1C measurement. A Korean study found that the optimal A1C cutoff value for diagnosing diabetes based on FPG and 2-hour plasma glucose after an OGTT rose by approximately 0.1% with each decade increase of age in a Korean population [50]. This association of higher A1C with increasing age seemed to be due to changes in the rate of glycation associated with aging [53]. Some Hb variants could interfere with some A1C assay methods [57]. In the USA, 10% of 26 million African-American citizens have HbS or HbC trait [58]. Any condition that changes erythrocyte turnover, such as hemolytic anemia, chronic malaria, major blood loss, blood transfusions, splenomegaly or splenectomy, rheumatoid arthritis, or drugs such as antiretrovirals, ribavirin, and dapsone could lead to spurious A1C results. Hemolytic anemia can lead to an A1C that is lower than expected because of a decreased erythrocyte lifespan [59]. Iron deficiency anemia can increase the A1C level, which falls after iron therapy [60]. Renal failure was identified as an influencing condition because of the following: (1) a decreased erythrocyte life-span, as described above; (2) erythropoietin therapy, which increases red cell production [59]; and (3) increased formation of carbamylated Hb due to the binding to N-terminal β-chains of Hb of isocyanic acid, a urea byproduct formed in excess because of hyperuremia [61].
- If A1C distributions were not the same for different populations due to these differences in clinical characteristics, the cut-off value would be changed with a shift in the A1C distribution to the left or right.
- The cutoff A1C values for DR depend on the choice of exclusion criteria. Most studies included individuals using oral hypoglycemic agents or insulin. In an Egyptian study, the optimal cutoff for HbA1c was 6.9% in the entire study population [26]. However, the optimal cutoff for HbA1c was changed to 7.5% after excluding subjects taking an antihyperglycemic medication. In a Chinese study, a cutoff of 6.4% was determined for the entire study population [39]. After excluding individuals receiving antidiabetes medication, the cutoff was 6.7% using the same method.
- The ARIC study showed the relationships of A1C and DR separately, in diabetic and nondiabetic individuals, demonstrating differential associations of A1C with DR in diabetic (strong association with mild DR) and nondiabetic individuals (weak or no association) [31]. The authors suggested that examining the cross-sectional association of A1C and prevalent DR in populations that include individuals with diabetes who may have received lifestyle and/or pharmacologic interventions to lower A1C could be problematic; the onset of DR may have occurred years earlier, and the 'risk thresholds' observed for A1C in these studies may not accurately reflect values at which risk begins to increase.
- The variability in optimal cutoff points could be due to assay differences in measuring A1C, especially in earlier studies before the standardization of measurements for A1C. The limitation of A1C as a marker for chronic hyperglycemia exposure could be one of the reasons for the variability in optimal cutoff points of A1C because A1C was measured at a single time-point and we did not collect information on previous hyperglycemia exposure.
THE OPTIMAL CUTOFF VALUE FOR A1C IN DIABETIC RETINOPATHY
Studies in the 1990s
Studies in the 2000s
Recent Western studies
Recent Asian studies
Difference in definition and/or methods for detecting DR
Variation in statistical methods
Differences in study population: ethnicities, age, and nonglycemic factors for determining A1C
Differences in exclusion criteria: diabetes and/or using antidiabetes medication
Others
- While the association of A1C with cardiovascular disease and other diabetic microvascular complications was linear without evidence of a distinct threshold, several studies suggested a threshold value for A1C in DR. In studies about the optimal cutoff value for A1C in DR, the values of A1C ranged from 5.2% to 7.8%. There are several possible reasons why these values for DR differ so widely (differences in definition and/or methods for detection of DR, variation in statistical methods, differences in study populations, differences in exclusion criteria, and differences in methods for measuring A1C). With these wide variations in study methods, drawing a conclusive cutoff value for A1C in DR is impossible.
- In earlier studies, using direct opthalmoscopic examination or a retinal photograph of one field per eye, there was a strong association of hyperglycemia with DR, and a sharp threshold for A1C was observed [25,26,27]. A pooled analysis with three cross-sectional populations using retinal photographs with multiple fields reported inconsistent evidence for a uniform glycemic threshold for prevalent and incident retinopathy [47]. These findings suggested that the sensitivity of the technique for DR could be one determinant for the optimal cutoff value for A1C in DR. The DETECT-2 collaboration study [30] showed that the A1C threshold for moderate or more severe retinopathy was observed over the range of 6.3% to 6.7%. The threshold for diabetes-specific retinopathy from ROC analysis was 6.4% for A1C. In published studies, the cutoff values for moderate or more severe DR were higher than those for any or mild DR (6.4% to 7.0% vs. 5.5% to 6.5%).
CONCLUSIONS
- 1. World Health Organization. WHO Expert Commitee on diabetes mellitus: second report: Technical Report Series 646 1980;cited 2015 Jan 8. Available from: http://whqlibdoc.who.int/trs/WHO_TRS_646.pdf?ua=1.
- 2. International Expert Committee. International Expert Committee report on the role of the A1C assay in the diagnosis of diabetes. Diabetes Care 2009;32:1327-1334. ArticlePubMedPMCPDF
- 3. American Diabetes Association. Diagnosis and classification of diabetes mellitus. Diabetes Care 2010;33(Suppl 1):S62-S69. ArticlePubMedPMCPDF
- 4. World Health Organization. Use of glycated haemoglobin (HbA1c) in the diagnosis of diabetes mellitus: abbreviated report of a WHO consultation cited 2015 Jan 8. Available from: http://www.who.int/diabetes/publications/diagnosis_diabetes2011/en/.
- 5. Santos-Oliveira R, Purdy C, da Silva MP, dos Anjos Carneiro-Leao AM, Machado M, Einarson TR. Haemoglobin A1c levels and subsequent cardiovascular disease in persons without diabetes: a meta-analysis of prospective cohorts. Diabetologia 2011;54:1327-1334. ArticlePubMedPDF
- 6. Sarwar N, Aspelund T, Eiriksdottir G, Gobin R, Seshasai SR, Forouhi NG, Sigurdsson G, Danesh J, Gudnason V. Markers of dysglycaemia and risk of coronary heart disease in people without diabetes: Reykjavik prospective study and systematic review. PLoS Med 2010;7:e1000278ArticlePubMedPMC
- 7. Coutinho M, Gerstein HC, Wang Y, Yusuf S. The relationship between glucose and incident cardiovascular events. A metaregression analysis of published data from 20 studies of 95,783 individuals followed for 12.4 years. Diabetes Care 1999;22:233-240. ArticlePubMedPDF
- 8. Sabanayagam C, Liew G, Tai ES, Shankar A, Lim SC, Subramaniam T, Wong TY. Relationship between glycated haemoglobin and microvascular complications: is there a natural cut-off point for the diagnosis of diabetes? Diabetologia 2009;52:1279-1289. ArticlePubMedPDF
- 9. Allen DW, Schroeder WA, Balog J. Observations on the chromatographic heterogeneity of normal adult and fetal human hemoglobin: a study of the effects of crystallization and chromatography on the heterogeneity and isoleucine content. J Am Chem Soc 1958;80:1628-1634.Article
- 10. Huisman TH, Meyering CA. Studies on the heterogeneity of hemoglobin. I. The heterogeneity of different human hemoglobin types in carboxymethylcellulose and in amberlite IRC-50 chromatography qualitative aspects. Clin Chim Acta 1960;5:103-123. PubMed
- 11. Huisman TH, Dozy AM. Studies on the heterogeneity of hemoglobin. V. Binding of hemoglobin with oxidized glutathione. J Lab Clin Med 1962;60:302-319. PubMed
- 12. Rahbar S. An abnormal hemoglobin in red cells of diabetics. Clin Chim Acta 1968;22:296-298. ArticlePubMed
- 13. Dolhofer R, Wieland OH. In vitro glycosylation of hemoglobins by different sugars and sugar phosphates. FEBS Lett 1978;85:86-90. ArticlePubMedPDF
- 14. Koenig RJ, Blobstein SH, Cerami A. Structure of carbohydrate of hemoglobin AIc. J Biol Chem 1977;252:2992-2997. ArticlePubMed
- 15. Bunn HF, Haney DN, Kamin S, Gabbay KH, Gallop PM. The biosynthesis of human hemoglobin A1c. Slow glycosylation of hemoglobin in vivo. J Clin Invest 1976;57:1652-1659. ArticlePubMedPMC
- 16. Koenig RJ, Peterson CM, Jones RL, Saudek C, Lehrman M, Cerami A. Correlation of glucose regulation and hemoglobin AIc in diabetes mellitus. N Engl J Med 1976;295:417-420. ArticlePubMed
- 17. Gabbay KH, Hasty K, Breslow JL, Ellison RC, Bunn HF, Gallop PM. Glycosylated hemoglobins and long-term blood glucose control in diabetes mellitus. J Clin Endocrinol Metab 1977;44:859-864. ArticlePubMed
- 18. The Diabetes Control and Complications Trial Research Group. The effect of intensive treatment of diabetes on the development and progression of long-term complications in insulin-dependent diabetes mellitus. N Engl J Med 1993;329:977-986. ArticlePubMed
- 19. UK Prospective Diabetes Study (UKPDS) Group. Intensive blood-glucose control with sulphonylureas or insulin compared with conventional treatment and risk of complications in patients with type 2 diabetes (UKPDS 33). Lancet 1998;352:837-853. ArticlePubMed
- 20. John WG. Haemoglobin A1c: analysis and standardisation. Clin Chem Lab Med 2003;41:1199-1212. ArticlePubMed
- 21. NGSP. Harmonizing hemoglobin A1c testing cited 2014 Oct 10. Available from: http://www.ngsp.org/.
- 22. Castagnola M, Caradonna P, Salvi ML, Rossetti D. Investigation of the heterogeneity of hemoglobin by cation-exchange chromatography on Bio-REX 70. J Chromatogr 1983;272:51-65. ArticlePubMed
- 23. Finke A, Kobold U, Hoelzel W, Weykamp C, Miedema K, Jeppsson JO. Preparation of a candidate primary reference material for the international standardisation of HbA1c determinations. Clin Chem Lab Med 1998;36:299-308. ArticlePubMed
- 24. Consensus Committee. Consensus statement on the worldwide standardization of the hemoglobin A1C measurement: the American Diabetes Association, European Association for the Study of Diabetes, International Federation of Clinical Chemistry and Laboratory Medicine, and the International Diabetes Federation. Diabetes Care 2007;30:2399-2400. PubMed
- 25. McCance DR, Hanson RL, Charles MA, Jacobsson LT, Pettitt DJ, Bennett PH, Knowler WC. Comparison of tests for glycated haemoglobin and fasting and two hour plasma glucose concentrations as diagnostic methods for diabetes. BMJ 1994;308:1323-1328. ArticlePubMedPMC
- 26. Engelgau MM, Thompson TJ, Herman WH, Boyle JP, Aubert RE, Kenny SJ, Badran A, Sous ES, Ali MA. Comparison of fasting and 2-hour glucose and HbA1c levels for diagnosing diabetes. Diagnostic criteria and performance revisited. Diabetes Care 1997;20:785-791. ArticlePubMedPDF
- 27. Report of the Expert Committee on the diagnosis and classification of diabetes mellitus. Diabetes Care 1997;20:1183-1197. ArticlePubMedPDF
- 28. Almdal TP, Handlos LN, Valerius M, Juul E, Nielsen KE, Vistisen D, Nielsen LB, Sheikh A, Belhadj M, Nadir D, Zinai S, Raposo J, Lund-Andersen H, Witte DR. Glycaemic threshold for diabetes-specific retinopathy among individuals from Saudi Arabia, Algeria and Portugal. Diabetes Res Clin Pract 2014;103:e44-e46. ArticlePubMed
- 29. Cheng YJ, Gregg EW, Geiss LS, Imperatore G, Williams DE, Zhang X, Albright AL, Cowie CC, Klein R, Saaddine JB. Association of A1C and fasting plasma glucose levels with diabetic retinopathy prevalence in the U.S. population: implications for diabetes diagnostic thresholds. Diabetes Care 2009;32:2027-2032. PubMedPMC
- 30. Colagiuri S, Lee CM, Wong TY, Balkau B, Shaw JE, Borch-Johnsen K. DETECT-2 Collaboration Writing Group. Glycemic thresholds for diabetes-specific retinopathy: implications for diagnostic criteria for diabetes. Diabetes Care 2011;34:145-150. PubMed
- 31. Selvin E, Ning Y, Steffes MW, Bash LD, Klein R, Wong TY, Astor BC, Sharrett AR, Brancati FL, Coresh J. Glycated hemoglobin and the risk of kidney disease and retinopathy in adults with and without diabetes. Diabetes 2011;60:298-305. ArticlePubMedPDF
- 32. Tapp RJ, Zimmet PZ, Harper CA, de Courten MP, McCarty DJ, Balkau B, Taylor HR, Welborn TA, Shaw JE. AusDiab Study Group. Diagnostic thresholds for diabetes: the association of retinopathy and albuminuria with glycaemia. Diabetes Res Clin Pract 2006;73:315-321. ArticlePubMed
- 33. Tsugawa Y, Mukamal KJ, Davis RB, Taylor WC, Wee CC. Should the hemoglobin A1c diagnostic cutoff differ between blacks and whites? A cross-sectional study. Ann Intern Med 2012;157:153-159. ArticlePubMedPMC
- 34. Cho NH, Kim TH, Woo SJ, Park KH, Lim S, Cho YM, Park KS, Jang HC, Choi SH. Optimal HbA1c cutoff for detecting diabetic retinopathy. Acta Diabetol 2013;50:837-842. ArticlePubMedPDF
- 35. Ito C, Maeda R, Ishida S, Harada H, Inoue N, Sasaki H. Importance of OGTT for diagnosing diabetes mellitus based on prevalence and incidence of retinopathy. Diabetes Res Clin Pract 2000;49:181-186. ArticlePubMed
- 36. Miyazaki M, Kubo M, Kiyohara Y, Okubo K, Nakamura H, Fujisawa K, Hata Y, Tokunaga S, Iida M, Nose Y, Ishibashi T, Hisayama s. Comparison of diagnostic methods for diabetes mellitus based on prevalence of retinopathy in a Japanese population: the Hisayama Study. Diabetologia 2004;47:1411-1415. ArticlePubMedPDF
- 37. Mukai N, Yasuda M, Ninomiya T, Hata J, Hirakawa Y, Ikeda F, Fukuhara M, Hotta T, Koga M, Nakamura U, Kang D, Kitazono T, Kiyohara Y. Thresholds of various glycemic measures for diagnosing diabetes based on prevalence of retinopathy in community-dwelling Japanese subjects: the Hisayama Study. Cardiovasc Diabetol 2014;13:45ArticlePubMedPMC
- 38. Tsugawa Y, Takahashi O, Meigs JB, Davis RB, Imamura F, Fukui T, Taylor WC, Wee CC. New diabetes diagnostic threshold of hemoglobin A(1c) and the 3-year incidence of retinopathy. Diabetes 2012;61:3280-3284. ArticlePubMedPMCPDF
- 39. Xin Z, Yuan MX, Li HX, Hua L, Feng JP, Shi J, Zhu XR, Cao X, Yang JK. Evaluation for fasting and 2-hour glucose and HbA1c for diagnosing diabetes based on prevalence of retinopathy in a Chinese population. PLoS One 2012;7:e40610ArticlePubMedPMC
- 40. Massin P, Lange C, Tichet J, Vol S, Erginay A, Cailleau M, Eschwege E, Balkau B. DESIR (Data From an Epidemiological Study on the Insulin Resistance Syndrome) Study Group. Hemoglobin A1c and fasting plasma glucose levels as predictors of retinopathy at 10 years: the French DESIR study. Arch Ophthalmol 2011;129:188-195. ArticlePubMedPMC
- 41. van Leiden HA, Dekker JM, Moll AC, Nijpels G, Heine RJ, Bouter LM, Stehouwer CD, Polak BC. Risk factors for incident retinopathy in a diabetic and nondiabetic population: the Hoorn study. Arch Ophthalmol 2003;121:245-251. ArticlePubMed
- 42. Aldington SJ, Kohner EM, Meuer S, Klein R, Sjolie AK. Methodology for retinal photography and assessment of diabetic retinopathy: the EURODIAB IDDM complications study. Diabetologia 1995;38:437-444. ArticlePubMedPDF
- 43. Diabetic retinopathy study. Report number 6. Design, methods, and baseline results. Report number 7. A modification of the Airlie House classification of diabetic retinopathy. Prepared by the diabetic retinopathy. Invest Ophthalmol Vis Sci 1981;21(1 Pt 2):1-226.
- 44. Park YM, Ko SH, Lee JM, Kim DJ, Kim DJ, Han K, Bower JK, Ahn YB. Committee of Clinical Practice Guideline, Korean Diabetes Association. Glycaemic and haemoglobin A1c thresholds for detecting diabetic retinopathy: the fifth Korea National Health and Nutrition Examination Survey (2011). Diabetes Res Clin Pract 2014;104:435-442. ArticlePubMed
- 45. Yu T, Mitchell P, Berry G, Li W, Wang JJ. Retinopathy in older persons without diabetes and its relationship to hypertension. Arch Ophthalmol 1998;116:83-89. ArticlePubMed
- 46. Bild DE, Bluemke DA, Burke GL, Detrano R, Diez Roux AV, Folsom AR, Greenland P, Jacob DR Jr, Kronmal R, Liu K, Nelson JC, O'Leary D, Saad MF, Shea S, Szklo M, Tracy RP. Multi-ethnic study of atherosclerosis: objectives and design. Am J Epidemiol 2002;156:871-881. ArticlePubMed
- 47. Wong TY, Liew G, Tapp RJ, Schmidt MI, Wang JJ, Mitchell P, Klein R, Klein BE, Zimmet P, Shaw J. Relation between fasting glucose and retinopathy for diagnosis of diabetes: three population-based cross-sectional studies. Lancet 2008;371:736-743. ArticlePubMedPMC
- 48. Muller RA, Kleinhans N, Courchesne E. Linguistic theory and neuroimaging evidence: an fMRI study of Broca's area in lexical semantics. Neuropsychologia 2003;41:1199-1207. ArticlePubMed
- 49. Pani LN, Korenda L, Meigs JB, Driver C, Chamany S, Fox CS, Sullivan L, D'Agostino RB, Nathan DM. Effect of aging on A1C levels in individuals without diabetes: evidence from the Framingham Offspring Study and the National Health and Nutrition Examination Survey 2001-2004. Diabetes Care 2008;31:1991-1996. PubMedPMC
- 50. Lee H, Oh JY, Sung YA, Kim DJ, Kim SH, Kim SG, Moon S, Park IeB, Rhee EJ, Chung CH, Kim BJ, Ku BJ. Optimal hemoglobin A1C cutoff value for diagnosing type 2 diabetes mellitus in Korean adults. Diabetes Res Clin Pract 2013;99:231-236. ArticlePubMed
- 51. Kramer CK, Araneta MR, Barrett-Connor E. A1C and diabetes diagnosis: the Rancho Bernardo Study. Diabetes Care 2010;33:101-103. ArticlePubMedPDF
- 52. Kim JM, Hong JW, Won JC, Noh JH, Ko KS, Rhee BD, Kim DJ. Glycated hemoglobin value for fasting plasma glucose of 126 mg/dL in Korean: the 2011 Korea National Health and Nutrition Examination Survey. Diabetes Metab J 2014;38:480-483. ArticlePubMedPMC
- 53. Kilpatrick ES, Dominiczak MH, Small M. The effects of ageing on glycation and the interpretation of glycaemic control in type 2 diabetes. QJM 1996;89:307-312. ArticlePubMed
- 54. Christensen DL, Witte DR, Kaduka L, Jorgensen ME, Borch-Johnsen K, Mohan V, Shaw JE, Tabak AG, Vistisen D. Moving to an A1C-based diagnosis of diabetes has a different impact on prevalence in different ethnic groups. Diabetes Care 2010;33:580-582. ArticlePubMedPDF
- 55. Herman WH, Ma Y, Uwaifo G, Haffner S, Kahn SE, Horton ES, Lachin JM, Montez MG, Brenneman T, Barrett-Connor E. Diabetes Prevention Program Research Group. Differences in A1C by race and ethnicity among patients with impaired glucose tolerance in the Diabetes Prevention Program. Diabetes Care 2007;30:2453-2457. ArticlePubMedPDF
- 56. Likhari T, Gama R. Glycaemia-independent ethnic differences in HbA(1c) in subjects with impaired glucose tolerance. Diabet Med 2009;26:1068-1069. ArticlePubMed
- 57. Roberts WL, Safar-Pour S, De BK, Rohlfing CL, Weykamp CW, Little RR. Effects of hemoglobin C and S traits on glycohemoglobin measurements by eleven methods. Clin Chem 2005;51:776-778. ArticlePubMedPDF
- 58. Mostafa SA, Davies MJ, Webb D, Gray LJ, Srinivasan BT, Jarvis J, Khunti K. The potential impact of using glycated haemoglobin as the preferred diagnostic tool for detecting type 2 diabetes mellitus. Diabet Med 2010;27:762-769. ArticlePubMed
- 59. John WG. UK Department of Health Advisory Committee on Diabetes. Use of HbA1c in the diagnosis of diabetes mellitus in the UK. The implementation of World Health Organization guidance 2011. Diabet Med 2012;29:1350-1357. ArticlePubMed
- 60. El-Agouza I, Abu Shahla A, Sirdah M. The effect of iron deficiency anaemia on the levels of haemoglobin subtypes: possible consequences for clinical diagnosis. Clin Lab Haematol 2002;24:285-289. ArticlePubMedPDF
- 61. Jaisson S, Pietrement C, Gillery P. Carbamylation-derived products: bioactive compounds and potential biomarkers in chronic renal failure and atherosclerosis. Clin Chem 2011;57:1499-1505. ArticlePubMedPDF
REFERENCES
Studies examining the threshold for HbA1c in detecting diabetic retinopathy
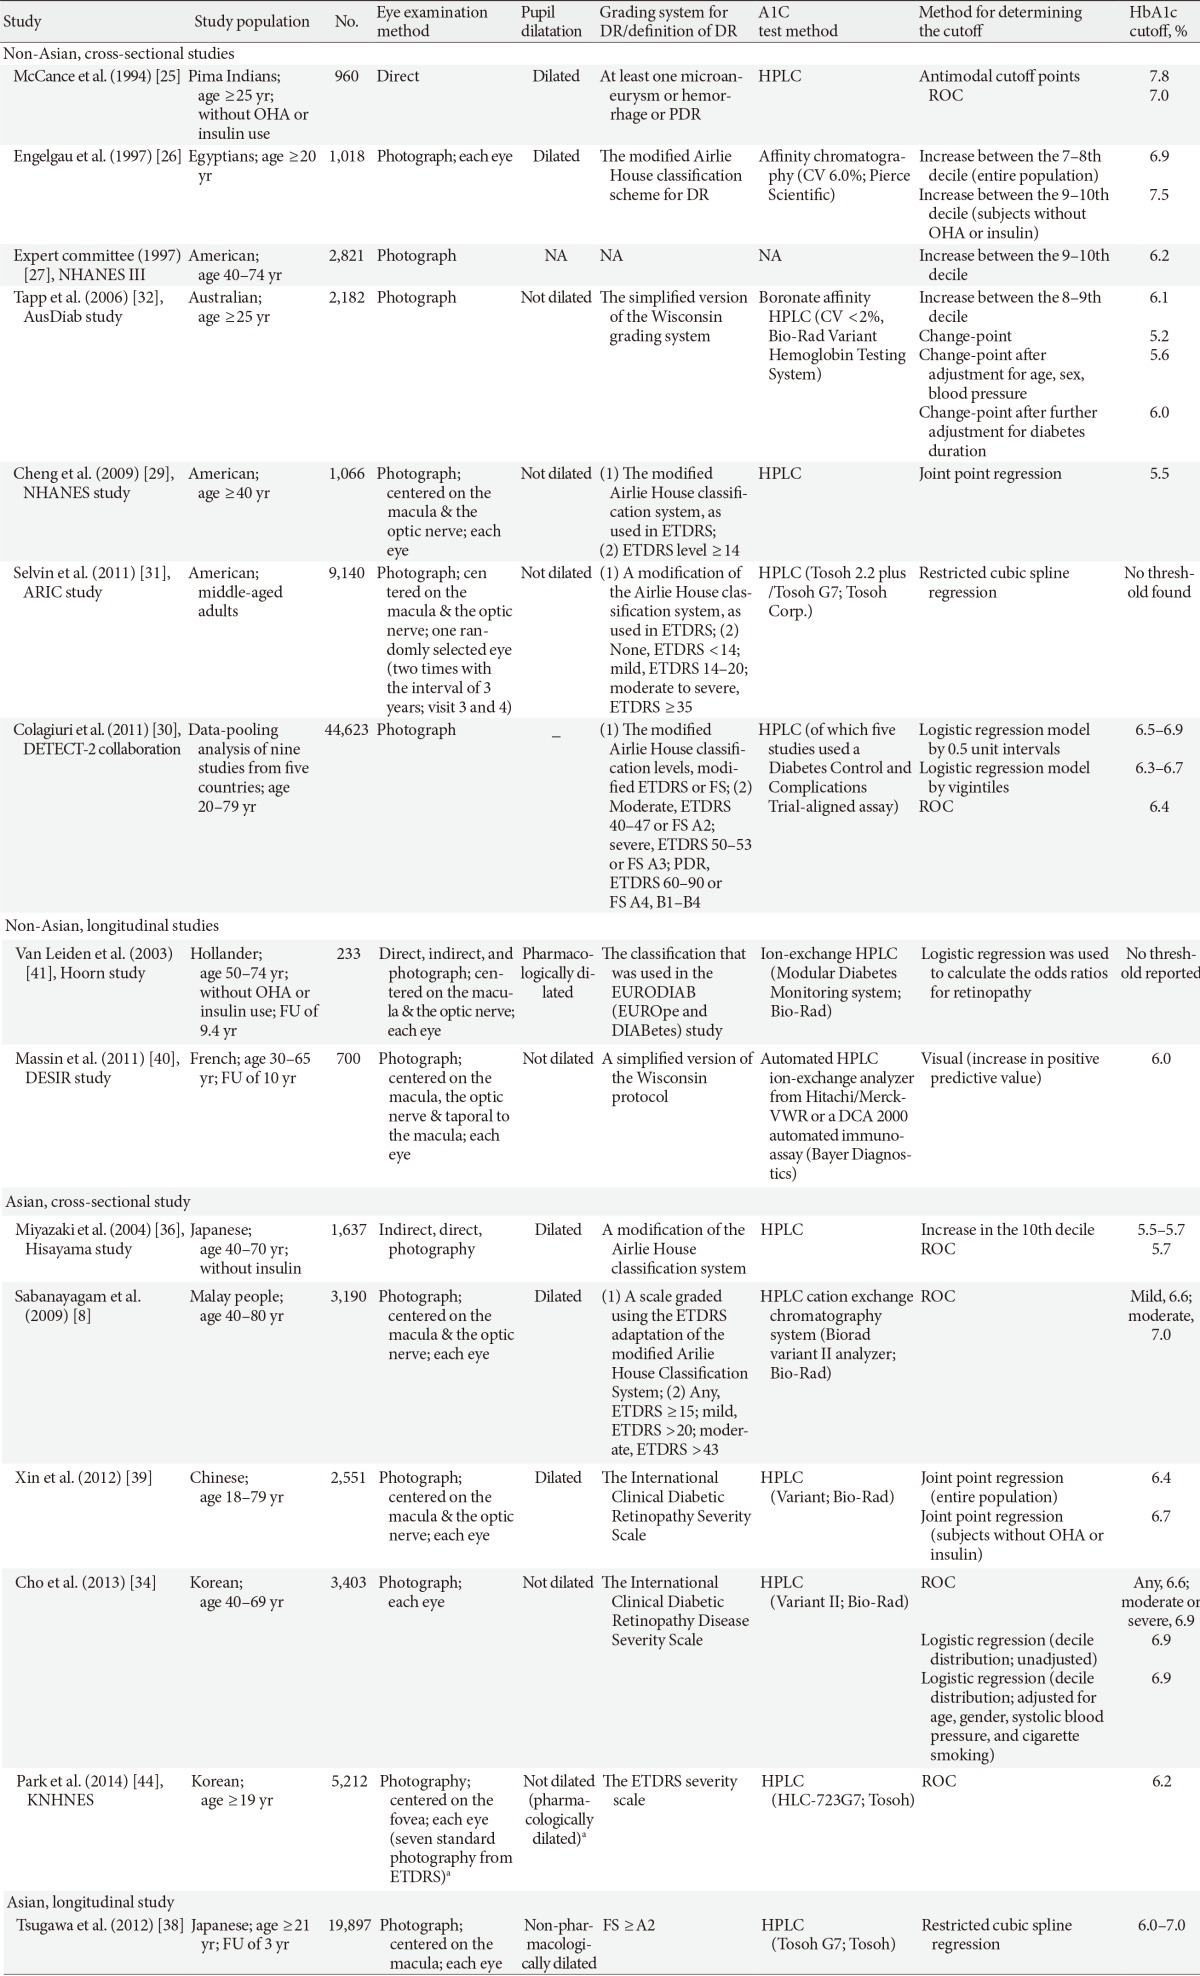
HbA1c, glycated hemoglobin; DR, diabetic retinopathy; OHA, oral hypoglycemic agents; PDR, proliferative diabetic retinopathy; HPLC, high-pressure liquid chromatography; ROC, receiver operating characteristic curve; CV, coefficient of variation; NHANES, National Health and Nutrition Examination Survey; AusDiab, Australian Diabetes Obesity and Lifestyle; NA, not available; ETDRS, the Early Treatment Diabetic Retinopathy Study; ARIC, Atherosclerosis Risk in Communities; DETECT-2, the Evaluation of Screening and Early Detection Strategies for Type 2 Diabetes and Impaired Glucose Tolerance; FS, Fukuda Standard; FU, follow-up; DESIR, Data From an Epidemiological Study on the Insulin Resistance Syndrome.
aIn participants who had a history of diabetes or a random blood glucose level of ≥200 mg/dL and/or suspicion of diabetes retinopathy in nonmydriatic fundus photography.
Figure & Data
References
Citations
- What Difference Does a Diagnosis Make?
Mattan Alalouf, Sarah Miller, Laura R. Wherry
American Journal of Health Economics.2024; 10(1): 97. CrossRef - EFFECTS OF GLYCEMIC VARIABILITY ON THE PROGRESSION OF DIABETIC RETINOPATHY AMONG PATIENTS WITH TYPE 2 DIABETES
Jae Yong Park, Je Hyung Hwang, Min Ji Kang, Ha Eun Sim, Jae Suk Kim, Kyung Soo Ko
Retina.2021; 41(7): 1487. CrossRef - Simple diagnosis of HbA1c using the dual-plasmonic platform integrated with LSPR and SERS
Nam Su Heo, Cheol Hwan Kwak, Hoomin Lee, Dongjoo Kim, Sunmook Lee, Gi-bum Kim, Soonjo Kwon, Woo Sik Kim, Yun Suk Huh
Journal of Crystal Growth.2017; 469: 154. CrossRef - Insulin resistance and beta-cell dysfunction in people with prediabetes according to criteria based on glycemia and glycosylated hemoglobin
Andrea Tura, Christian Göbl, Ermanno Moro, Giovanni Pacini
Endocrine Journal.2017; 64(1): 117. CrossRef - DIABETIC RETINOPATHY-RISK FACTORS, STAGING & MANAGEMENT
Naidu A. P. R., Satyavathidevi P
Journal of Evidence Based Medicine and Healthcare.2016; 3(2): 94. CrossRef
 PubReader
 Cite
Cite


